Article Text

Abstract
Objective Contrary to the long-standing prerequisite of inducing selective (ie, bifidogenic) effects, recent findings suggest that prebiotic interventions lead to ecosystem-wide microbiota shifts. Yet, a comprehensive characterisation of this process is still lacking. Here, we apply 16S rDNA microbiota profiling and matching (gas chromatography mass spectrometry) metabolomics to assess the consequences of inulin fermentation both on the composition of the colon bacterial ecosystem and faecal metabolites profiles.
Design Faecal samples collected during a double-blind, randomised, cross-over intervention study set up to assess the effect of inulin consumption on stool frequency in healthy adults with mild constipation were analysed. Faecal microbiota composition and metabolite profiles were linked to the study's clinical outcome as well as to quality-of-life measurements recorded.
Results While faecal metabolite profiles were not significantly altered by inulin consumption, our analyses did detect a modest effect on global microbiota composition and specific inulin-induced changes in relative abundances of Anaerostipes, Bilophila and Bifidobacterium were identified. The observed decrease in Bilophila abundances following inulin consumption was associated with both softer stools and a favourable change in constipation-specific quality-of-life measures.
Conclusions Ecosystem-wide analysis of the effect of a dietary intervention with prebiotic inulin-type fructans on the colon microbiota revealed that this effect is specifically associated with three genera, one of which (Bilophila) representing a promising novel target for mechanistic research.
Trial registration number NCT02548247.
- COLONIC MICROFLORA
- PREBIOTIC
- CONSTIPATION
This is an Open Access article distributed in accordance with the Creative Commons Attribution Non Commercial (CC BY-NC 4.0) license, which permits others to distribute, remix, adapt, build upon this work non-commercially, and license their derivative works on different terms, provided the original work is properly cited and the use is non-commercial. See: http://creativecommons.org/licenses/by-nc/4.0/
Statistics from Altmetric.com
Significance of this study
What is already known on this subject?
Dietary interventions with prebiotics constitute one of the main strategies to modulate gut microbiota composition and activity.
The effect of consumption of inulin-type fructans on the colon Bifidobacterium population is well documented.
With recent findings in mice studies pointing towards a broad-spectrum effect, the specificity of a prebiotic effect has become subject of debate.
What are the new findings?
Inulin-type fructans have a selective effect on the human gut microbiota.
The only genera consistently impacted by inulin supplementation are Bifidobacterium, Anaerostipes and Bilophila.
Decreased Bilophila abundance on inulin consumption is linked with improved constipation-related quality-of-life metrics.
How might it impact on clinical practice in the foreseeable future?
This study is the first to assess the effect of a dietary inulin intervention on the gut microbiota using next-generation sequencing technology. The demonstrated selectivity of the effect of inulin allows customised interventions based on the nature of the dysbiosis targeted. The link between Bilophila abundance and well-being combined with the susceptibility of the genus to inulin interventions opens new perspectives for prebiotic research.
Introduction
The prebiotic concept was introduced in 1995, referring to a ‘non-digestible food ingredient that beneficially affects the host by selectively stimulating the growth and/or activity of one or a limited number of bacteria in the colon, and thus improves health’.1 Ever since, proposals to amend this definition have been made on a regular basis. Recent amendments proposed the extension of the concept to body sites other than the large intestine as well as the inclusion of benefits on host well-being as intervention targets, but also the removal of the restriction of selectivity of a prebiotic effect on colon ecosystem composition.2 ,3 The latter is remarkable, since the prebiotic concept emerged from observations of selective stimulation of Bifidobacterium growth on inulin fermentation.4–6 However, the targeted nature of the methods most often used in prebiotic research to quantify bacterial abundances does not allow to exclude a prebiotic effect beyond the taxonomic clusters under investigation.3 Using sequencing approaches that do allow microbiota-wide assessment of relative abundance shifts, two recent mice studies indicated a broad-spectrum response of the gut microbial community following prebiotic stimulation,7 ,8 resulting from both expected cross-feeding interactions and changes in the gut environment.9 Next to the growing consensus regarding a community-level microbiota response to prebiotics, the necessity of selective bacterial stimulation to enable a beneficial effect on host health has also been questioned.3 Many projected health benefits of prebiotic interventions are attributed to enhanced saccharolytic fermentation and the resulting increased production of short-chain fatty acids10 – both common features among colon bacteria.11 Hence, an emerging opinion in the field is that the requirement of selectivity of prebiotic stimulation is unnecessarily strict – an opinion that has grown to become a topic of hot debate both in academia and industry.2
To date, the impact of prebiotic interventions on the totality of the human colon bacterial ecosystem has not been investigated using meta-omics approaches that have proven their worth in a wide range of research areas. Here, we set out to rectify this anachronism through the analysis of faecal material collected throughout a dietary intervention study with inulin-type fructans. The trial was set up as a randomised, double-blind, placebo-controlled, cross-over trial during which healthy adults with mild constipation consumed 12 g of chicory-derived Orafti inulin on a daily basis along a 4-week treatment period (figure 1). A significant increase in stool frequency resulting from inulin consumption was established,12 leading to a first positive opinion by the European Food Safety Authority on chicory inulin and ‘maintenance of normal defecation’.13 Meanwhile, based on the scientific opinion a proprietary health claim (article 13.5) on chicory inulin and bowel function has been authorised by the European Commission. Using 16S rDNA gene amplicon sequencing and matching gas chromatography mass spectrometry (GC-MS) metabolite analysis, we analysed the samples collected to assess the impact of inulin treatment on faecal microbiota composition and metabolite profiles and relate findings to the study's clinical outcome as well as to quality-of-life measurements.

Randomised, double-blind, placebo-controlled, cross-over trial. Participants were randomly distributed over two study arms, with the order of placebo and treatment interventions switching between arms. After each run-in and intervention period, faecal samples for microbiota and metabolite analyses as well as metadata were collected (visits V2–V5).
Results and discussion
Prebiotic intervention modulates microbiome composition
First, we set out to investigate the modulating effect of inulin consumption on colon ecosystem composition. To do so, we defined intra-individual variation of microbiota composition by exploiting the full potential of the time-series data collected (figure 1). Carry-over analysis of genus abundances profiles ruled out potential persistence of treatment effects beyond the duration of the washout period integrated in the study design (Wilcoxon test, q-values >0.5; see online supplementary table S1). Therefore, samples taken at the end of run-in periods and placebo intervention could be regarded as snapshots of the natural variation in the gut ecosystem. These snapshots allowed estimating baseline individual microbiome variation over time through calculation of reciprocal Bray-Curtis (BC) dissimilarities. Comparison of baseline variation with dissimilarity between prebiotic intervention and run-in/placebo samples should then reveal the occurrence of a potential inulin-induced shift in microbiome composition. Based on these assumptions, we observed increased BC dissimilarity associated with inulin consumption as compared with baseline variation (mean BC dissimilarity of 0.27 vs 0.25, SD 0.09 and 0.10; Wilcoxon test, p=0.0045). While our analyses demonstrate that the effect of inulin supplementation on faecal microbiome composition is sufficiently large to emerge against a background of baseline temporal variation, matching analyses based on faecal volatile metabolite profiles did not reveal significant effects associated with inulin consumption (mean BC dissimilarity of 0.29 vs 0.27, SD 0.09 and 0.09; Wilcoxon test, p=0.0731). Faecal bacterial metabolite concentrations off course only partially reflect actual production, given the delicate balance between bacterial production, cross-feeding and host absorption – a balance crucial to both ecosystem stability and host health. It also needs to be mentioned that the faecal metabolome analysis did not cover the complete metabolome but focused on volatile metabolites. As a consequence, potential changes in more polar metabolites may have been missed.
supplementary tables
Prebiotic effect size aligns with microbiome covariates
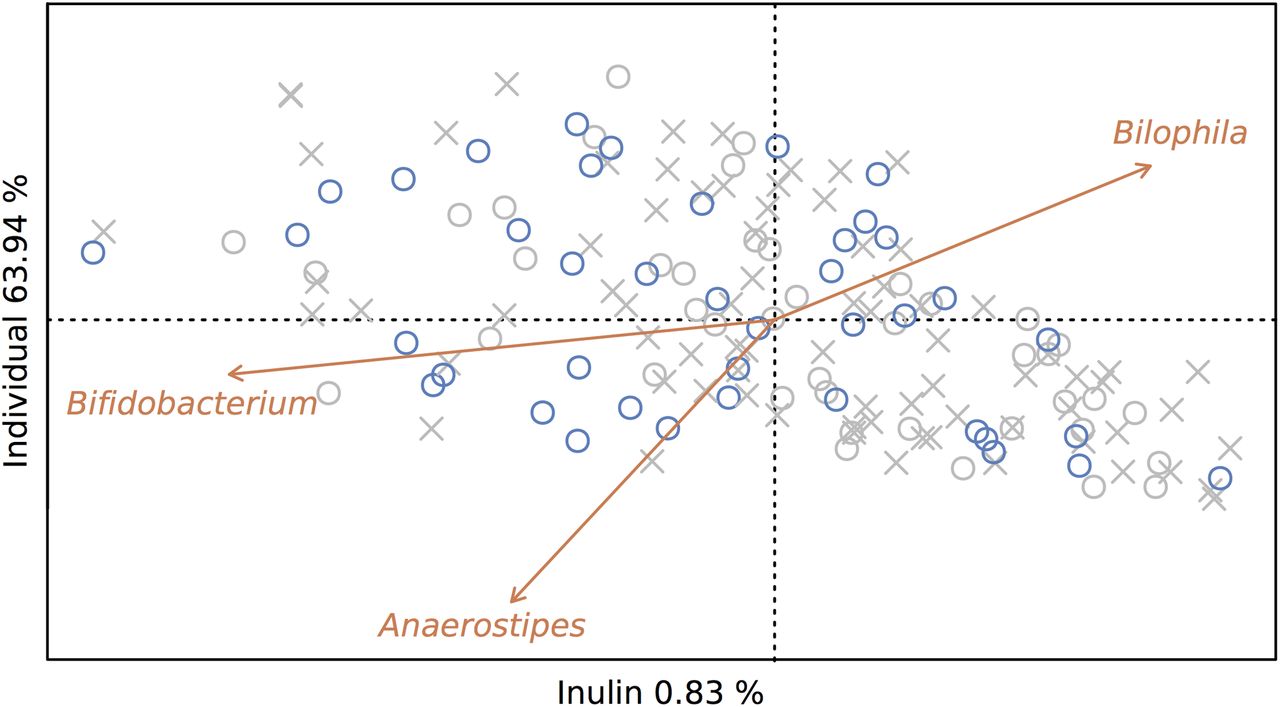
Next, we calculated the effect size of prebiotic treatment on microbiome variation by performing a Constrained Principal Coordinates Analysis (CAP). Using the sequencing data of all 165 samples collected, microbiome variation induced by inulin consumption was estimated at 0.8% (permutation test, p<0.01; figure 2). When restricting the analysis to samples taken at the end of placebo and inulin intervention periods, estimated effect size increased to 1.2% (permutation test, p<0.05). While these percentages might appear rather modest (interindividual variation was estimated at 63.9% and 77.2%, respectively), they would place the prebiotic intervention in terms of effect size among the top covariates recently identified in a population-level analysis of microbiome variation.14 A parallel analysis did not reveal a significant effect of inulin consumption on faecal metabolite profiles (see online supplementary figure S1). Capitalising on the study's original cross-over design, we explored the effect of inulin-type fructan fermentation on the colon ecosystem in more detail. In terms of conventional microbiome markers, cross-over analysis allowed us to identify a treatment-induced decrease in observed microbiota richness (p<0.05; see online supplementary table S2). In spite of reported associations with both stool consistency15 ,16 and transit time,17 the observed inulin-triggered richness reduction did not correlate with variation in Bristol Stool Scale score nor stool frequency (Spearman's test, r=−0.004 and −0.156, respectively, q-values >0.05; see online supplementary table S2). No significant differences in microbiota evenness or diversity were detected between treatment and placebo samples, nor was sample distribution over enterotypes (prevalent microbiome community constellations18) affected by the prebiotic intervention (see online supplementary tables S2 and S3). Enterotype shifts (an individual's microbiome changing from one prevalent microbiota constellation to another) did not occur more frequently after inulin intake (19%) than after placebo intake (19%) (see online supplementary table S3).

Prebiotic treatment accounts for 0.8% of between-sample microbiome variation. Prebiotic treatment was used as a constraining factor in a Principal Coordinates Analysis with Bray Curtis distance (CAP) on samples taken at the end of intervention (o) as well as run-in periods (x). Samples taken after inulin supplementation (blue) account for 0.8% of between-sample microbiome variation (permutation test, p<0.01). Genera responsive to prebiotic treatment (Bifidobacterium, Anaerostipes and Bilophila, Wilcoxon test, q-value <10−4, <10−3 and <0.01, respectively) were plotted on the ordination.
supplementary figures
Selective effect on Bifidobacterium, Anaerostipes and Bilophila
Genus-level cross-over analysis of amplicon profiles revealed only few specific effects on microbial taxa. We observed increased relative abundances of Bifidobacterium and Anaerostipes spp. on inulin consumption (Wilcoxon test, q-values <10−4 and <10−3, respectively; figure 3; see online supplementary table S4). In addition, the prebiotic intervention resulted in a decrease of the Bilophila population (q-value <0.01; figure 3; see online supplementary table S4). While absent for Anaerostipes and Bifidobacterium, we observed a strong correlation between inulin-induced shifts in relative abundances and initial numbers of Bilophila (Pearson's correlation, r=−0.71, p<10−6; see online supplementary figure S2 and table S5A). No links between magnitudes of treatment-associated shifts in relative abundance of Anaerostipes, Bifidobacterium and Bilophila could be established (see online supplementary table S5B). Using a hypothesis-driven approach, hence reducing the burden of multiple testing correction, we evaluated potential changes in abundances of some taxa with previously reported susceptibility towards prebiotic stimulation.19–21 No significant shifts in Akkermansia, Eubacterium, Faecalibacterium or Lactobacillus populations were associated with inulin consumption (see online supplementary table S6). Regarding faecal metabolites, cross-over analyses only revealed increased concentrations of dodecanal after inulin consumption (Wilcoxon test, q-value <0.001; see online supplementary table S7). This result was confirmed using Sparse Partial Least Square Discriminant Analysis (see online supplementary figure S3). However, it is important to note that the analytical techniques applied do not allow detection of all metabolites present in faecal water. Some potentially relevant metabolites (lactate, succinate and formate among others) are therefore not included in our data. Analysis of potential correlations with inulin-responsive genera over the complete dataset showed that the magnitudes of dodecanal concentration shifts between consecutive samples were associated with both Anaerostipes and Bifidobacterium abundance variation (Spearman's test, r=0.50, q-value <10−9 and rho=0.29, q-value <0.05, respectively; see online supplementary figure S4 and table S8). While dodecanal might be of dietary origin,22 increased faecal concentrations seem to suggest altered intestinal lipid digestion associated with inulin treatment.23

Inulin consumption increases Bifidobacterium and Anaerostipes abundances, while Bilophila numbers drop. Genus-level cross-over analysis of amplicon profiles shows increase in relative abundances of Bifidobacterium and Anaerostipes spp. on prebiotic intervention (Wilcoxon test, q-value <10−4 and <10−3, respectively) and reveals a decrease in the Bilophila population (q-value <0.01).
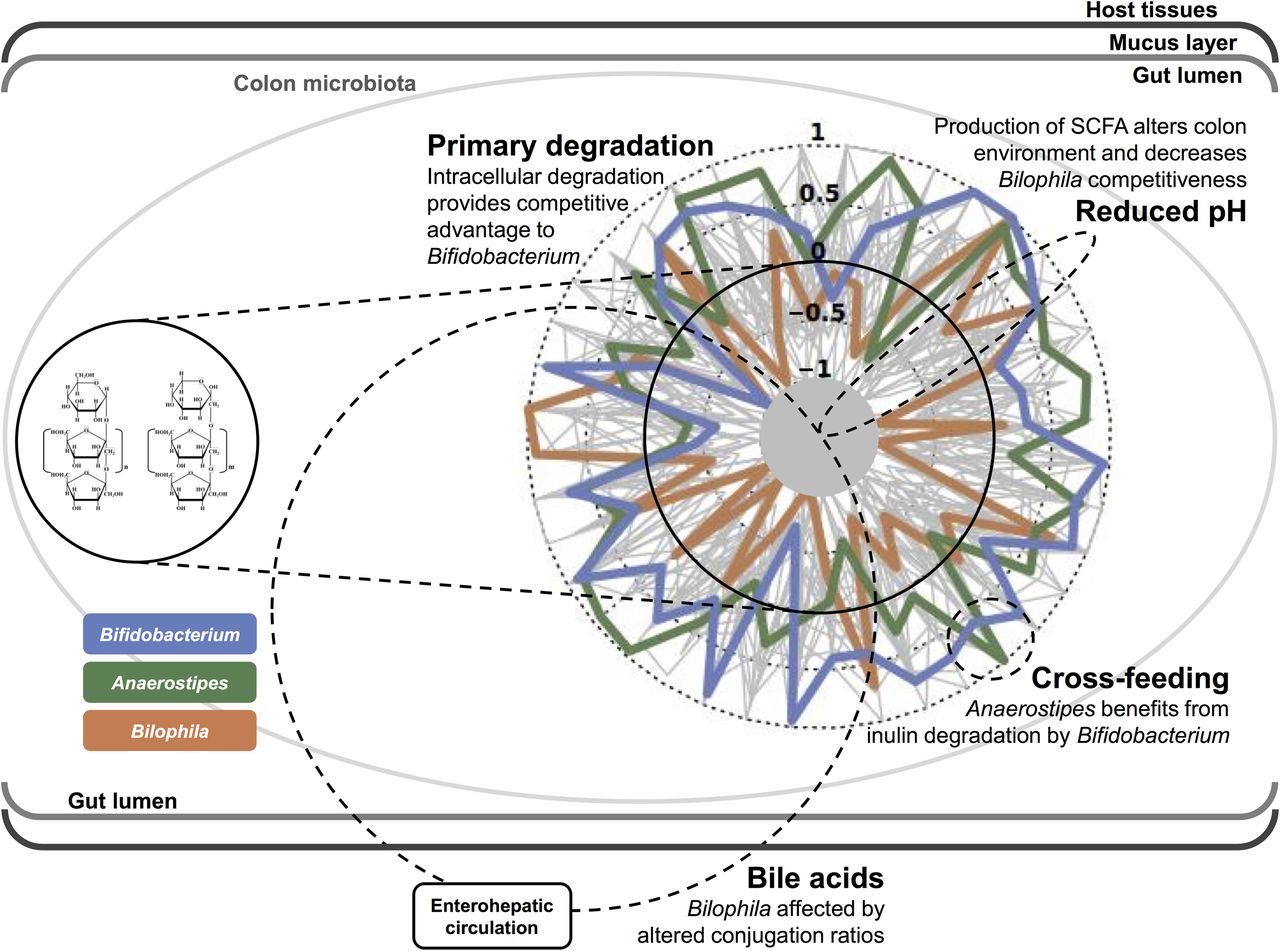
The specific effect of treatment on ecosystem composition (the limited number of consistently responsive taxa beyond interindividual variation) is remarkable and contrasts with findings of amplicon sequencing studies carried out in rodents.7 ,8 Although a growing number of colon bacteria have been identified as inulin-degraders,21 ,24 the specificity of the inulin intervention points to Bifidobacterium spp., long-standing targets of prebiotic research. Hence, our study confirms the bifidogenic nature of inulin-type fructans, which has been attributed to the ability of genus to efficiently take up and intracellularly degrade larger fructooligosaccharides.25 Other than bifidobacteria, Anaerostipes and Bilophila figured among inulin treatment-responsive taxa. The former is a butyrate-producing genus comprising both inulin degraders21 and species capable of cross-feeding on both monosaccharides and fermentation products resulting from primary inulin degradation by bifidobacteria.26 Of note, increased abundance of Anaerostipes was also observed following a 3-month dietary intervention with inulin-type fructans in obese women.27 The most prominent intestinal isolate of the latter genus is Bilophila wadsworthia, an asaccharolytic, sulfate-reducing taxon, generally comprising <0.1% of the normal human GI microbiota28 and associated with consumption of an animal-based diet.29 Given its unique ability to perform anaerobic respiration using taurine-derived sulfite as an electron acceptor,30 the observed shifts in Bilophila abundances hint to inulin-induced quantitative or qualitative changes in bile acid production. Indeed, the – to our knowledge – only study looking at prebiotic-induced changes in gallbladder bile profiles reports an increase of up to 100% in glycine-to-taurine conjugation ratio following inulin consumption in an animal model.31 While these findings remarkably well fit our observations, other mechanistic hypotheses cannot be discarded: a lowered intestinal luminal pH resulting from inulin-type fructan fermentation32 could also create a less favourable environment for Bilophila to thrive.33 An overview of inulin-induced compositional changes in the gut microbiota – complemented with some mechanistic hypotheses – is presented in figure 4. However, it remains important to stress that our analyses focus on healthy, mildly constipated individuals and that care needs to be taken when extrapolating results to phenotypically distinct populations. For example, our results differ from those observed in an inulin intervention in obesity-associated dysbiosis; these differences could be due to methodological differences, and to the different physiological context of the intervention.27 ,34 Likewise, in the same study, fructan consumption was found associated with a shift in faecal short-chain fatty acid profiles.35

Overview of inulin-induced compositional changes in the gut microbiota complemented with mechanistic hypotheses. Radar plot shows scaled variation in relative genus abundances (end riI vs end I) per individual, with decreased abundance of the genus over the inulin intervention situated within and increased abundance outside the solid circle (zero). Variation in abundances of genera identified as inulin-responsive are highlighted.
Quality of life as a potential target for prebiotic interventions
We then evaluated associations between the genera and metabolites identified as responsive to prebiotic intervention and dietary or GI parameters. For each individual, we calculated a distance metric assessing the shift in metadata, metabolite and genus parameters between consecutive samples. Next, correlations between the resulting parameter variations were assessed. No significant associations between dodecanal variation and any of the metadata recorded were observed (see online supplementary table S9). Similarly, no associations between variation of Bifidobacterium, Anaerostipes and Bilophila relative abundances and changes in dietary patterns apart from the prebiotic intervention could be detected (see online supplementary table S10). However, with regard to non-dietary metadata, a correlation between Bilophila abundance variation and changes in stool consistency (one-sided Spearman's test, r=−0.22, q-value <0.05) was found. Moreover, this analysis revealed an association between Bilophila and Patient Assessment of Constipation Quality of Life (PACQoL)-assessed physical discomfort and treatment satisfaction scores (r=0.20, q-value <0.05 and r=−0.30, q-value <0.01; see online supplementary figure S5 and table S11). To our knowledge, this is a first report of a shift in abundance of a bacterial genus being associated with both softer stools and a favourable change in constipation-specific quality-of-life measures following a dietary intervention with inulin. Based on its frequent detection in patient groups,28 its ample virulence potential36 and the potentially deleterious nature of its metabolic end products,28 ,37 B. wadsworthia is often classified as a pathobiont.37 Hence, the observed association between Bilophila decreases on inulin consumption and quality-of-life increase urges the need for further research on the role of this taxon in host well-being.
Conclusions
To our knowledge, the present study is the first to assess the effect of inulin supplementation throughout a double-blind, randomised, cross-over intervention combining ecosystem-wide microbiome and metabolome profiling techniques.38 Our analyses demonstrated that the effect of inulin-type fructans supplementation on the faecal microbiota is mainly restricted to changes in Anaerostipes, Bilophila and Bifidobacterium relative abundances. Despite the application of the same analyses as used for the microbiome data on the faecal metabolites, only dodecanal was found to increase abundance with the inulin intervention. Hence, it can be concluded that inulin-type fructans indeed selectively influence growth of a limited number of colon bacteria, meeting the most debated criterion of the definition of prebiotics. Furthermore, we find first indications that reduction of Bilophila, a genus containing known pathobionts, is associated with enhanced host well-being and could play a role in the inulin-associated prebiotic mechanism.
Methods
Study design
For an extensive overview of study design and procedures, we refer to Micka et al.12 Briefly, this study was set up as a randomised, double-blind, placebo-controlled, cross-over trial (Clinical Trials.gov ID: NCT02548247) targeted to investigate the effect of chicory-derived inulin (Orafti inulin) on bowel function in healthy individuals with constipation (see online supplementary table S12). Ethical approval was obtained from the Landesärztekammer Baden-Württemberg, Stuttgart, Germany (F-2010-092#A1). Study design consisted of two 4-week intervention periods during which either 12 g of inulin (treatment) or maltodextrin (placebo control) were consumed on a daily basis (figure 1). Each intervention period was preceded by a 2-week run-in phase during which the subjects were administered the placebo control. A washout phase was incorporated after the first intervention period. Metadata collected included personal data (age, gender, body mass index, patient's history of constipation and smoking status) and study-course dependent variables such as dietary information (weight and percentage of energy intake from fat, protein and carbohydrates consumed), GI parameters (stool consistency, stool frequency, feeling of bloating, incomplete emptying, straining, abdominal discomfort and passage of gas) and PACQoL parameters (treatment satisfaction and physical discomfort), which were recorded at each visit (V2–V5).12 Faecal samples for gut microbiota phylogenetic analyses and metabolite profiling were taken at visits V2, V3, V4 and V5 (figure 1). All analyses were performed on the per-protocol cohort (42 participants of the valid-case cohort (n=44) provided stool samples).
Faecal metabolite profiling
Volatile organic compounds (VOC) were determined following the method of De Preter et al.39 In brief, faecal material was suspended in water and 2-ethylbutyrate was spiked in as an internal standard. Sodium sulfate and sulfuric acid were added to the sample to salt out and acidify the solution, respectively. VOC were analysed using GC-MS (DSQ, Thermo Electron, San Jose, California, USA) coupled to a purge-and-trap system (Velocity, Teledyne Tekmar, Mason, Ohio, USA). Chromatograms were analysed using AMDIS V.2.1 software (National Institute of Standards and Technology (NIST), Gaithersburg, Maryland, USA). Identification of the metabolites detected was performed using the NIST library. Compounds showing mass spectra with match factors ≥90% in the NIST library were positively identified. Relative indices of all VOC vs 2-ethylbutyrate as internal standard were calculated. Metabolite profiles of 165 samples were determined. A total of 382 VOC were identified and quantified over all samples.
Faecal microbiota phylogenetic profiling
Faecal microbiota profiling was performed as described by Falony et al.14 Briefly, DNA was extracted from faecal material using the MoBio PowerMicrobiome RNA isolation kit. The V4 region of the 16S rRNA gene was amplified with primer pair 515F/806R, with single multiplex identifier and adaptors according to Kozich et al.40 This primer pair has been shown to allow adequate detection of a broad taxonomic range of colon bacteria, including Bifidobacterium spp.41 Sequencing was performed using Illumina MiSeq sequencer and sequencing kit MiSeq V2 to produce 250 bp paired-end reads. After demultiplexing, fastq sequences were merged using FLASH42 software with default parameters. Successfully combined reads were filtered based on quality (>90% of nucleotides must have quality score 30 or higher for every read) using Fastx tool kit (http://hannonlab.cshl.edu/fastx_toolkit/). Chimeras were removed with UCHIME43 and each sample depth was downsized to 10,000 reads by random selection of reads. The taxonomy of reads was assigned using RDP classifier.44 In total, 165 samples of 42 individuals (3 missing samples in the per protocol cohort) were analysed covering 293 genera with an average of 80 genera per sample.
Faecal microbiome analysis
Observed richness, estimated richness, Pielou's evenness index (J) and Shannon diversity index were calculated with the R package PHYLOSEQ.45 Enterotyping (http://enterotype.embl.de/enterotypes.html) based on Partitioning Around Medoids using Jensen-Shannon divergence18 was performed on a combined genus-abundance matrix including study samples complemented with 1000 samples originating from Flemish Gut Flora Project14 in order to increase enterotyping accuracy.
Statistical analyses
All statistical analyses were performed in R (V.3.1.0). Given the similarities between microbiome and metabolite data structure (multidimensional, zero-enriched data matrices), analyses of both data sets were performed following a likewise similar strategy. As both genera abundances and metabolite concentrations are not normally distributed, non-parametric tests were used. Multiple testing correction was performed when applicable.
Carry-over analysis
A paired Wilcoxon test was used to evaluate differences between samples taken at the start of intervention periods (V4–V2, IP arm; figure 1) to assess possible carry-over of treatment effects. The absence of any significant (q-value <0.05) difference between both samples was assumed to exclude carry-over between interventions.
Baseline versus treatment analysis
Mean BC dissimilarity between non-treatment samples (end riI, riP and P; figure 1) was compared with mean dissimilarity between treatment (end I) and non-treatment samples using a one-sided Wilcoxon test, both on microbiome and metabolome data, in order to assess ecosystem-level effects of the inulin intervention. In parallel, BC dissimilarity induced by placebo (end riP vs end P) and inulin (end riI vs end I) intervention was compared using a paired Wilcoxon test on both dissimilarities.
Constrained analysis of principal coordinates
To determine the effect of inulin intake on the microbial composition, we applied CAP (R package VEGAN,46 function cap scale) using BC dissimilarity as a distance metric and with inulin as the constraining factor and participant's ID as a conditioning factor. Significance was calculated with a permutation test (function anova.cca, default parameters). Genera responsive to inulin treatment were fitted onto the ordination (function envfit).
Cross-over analysis
Matching the specific format of the cross-over design, we used dedicated statistical analyses to assess the potential effect of inulin treatment.47 In short, for each individual and parameter under study (richness, evenness, taxon or metabolite abundance), read-outs observed at the end of each intervention period were subtracted (V5–V3; figure 1). Cross-over analysis consisted in evaluating differences between study arms (IP vs PI; figure 1) in the resulting output using Wilcoxon test, imposing cohort stratification when required (enterotype, gender) and applying Benjamini Hochberg false discovery rate (BH-FDR;48) to correct for multiple testing.
Correlations
Correlations between variation in observed richness and both stool consistency and frequency induced by inulin treatment (end riI vs end I) were assessed using Spearman's correlation.
For genera identified as responsive to inulin treatment, correlations between the magnitude of the observed shifts in relative abundances on inulin consumption (end riI vs end I) and their initial abundances (end riI) were assessed using Pearson's correlation. Also correlations between the magnitudes of inulin-induced shifts (end riI vs end I) of different responsive genera were evaluated using Pearson's correlation. Correlations between shifts in relative abundance of responsive genera and responsive metabolites (consecutive samples: V3–V2, V4–V3, V5–V4, using all 165 samples) were tested using Spearman's correlation.
Sparse partial least square discriminant analysis
Sparse partial least square discriminant analysis (sPLS-DA) was performed with the R package mixOmics on all 165 samples of the per-protocol cohort. Inulin supplementation class (yes (41) vs no (124)) was used as a stratifying factor on the faecal metabolite matrix. Removing all metabolites with near to zero variance (function nearZeroVar), the faecal metabolite matrix was reduced to 147 variables. The optimal number of components was chosen based on the averaged balanced classification error rate with centroids distance over 50 repeats of a 10-fold cross-validation of a PLS-DA model with 10 components (function perf). The optimal number of selected variables for each component was chosen based on the lowest average balanced classification error rate with centroids after tuning of the sPLS-DA model (function tune.spldsda; using 4 components and 10-fold cross-validation with 50 repeats; see online supplementary figure S3). Stability frequency scores of the selected metabolites were calculated (function perf) on the final sPLS-DA model with 10-fold cross-validation and 10 repetitions.
Integrated microbiota, metabolite and metadata analysis
Using all four samples collected during the study, shifts in abundance of inulin-responsive genera, concentrations of treatment-affected metabolites and metadata read-outs between consecutive samples were calculated, adjusting for missing samples. Correlations between shifts were evaluated using a Spearman's test. BH-FDR was applied on all tests to correct for multiple testing.
Acknowledgments
We would like to thank all study participants, Leen Rymenans and Chloë Verspecht for faecal DNA extraction and library preparation, and all members of the Raes Lab for participating in scientific discussions regarding the manuscript.
References
Footnotes
DV and GF contributed equally.
Contributors Conception and design of the study (ST), data collection (ST, KV and JR), data preparation (MS, ST, JW, DV and KV), data analysis and interpretation (DV, GF and SV-S), writing and critical revision of the manuscript (DV, GF, SV-S, MS, ST, KV and JR). All authors approved the final version for publication.
Funding DV is funded by the Agency for Innovation by Science and Technology (IWT). SV-S and JW are supported by a postdoctoral fellowship from Research Foundation Flanders (FWO). The study was funded by BENEO GmbH, Mannheim, Germany, a member of the Südzucker Group. The study results and data contained in the publication have been developed by and/or for BENEO GmbH. BENEO GmbH reserves the exclusive right to use the results and data for possible Health Claim requests.
Competing interests MS and ST are employees of BENEO/Südzucker Group. The authors alone are responsible for the content and writing of this article.
Ethics approval Landesärztekammer Baden-Württemberg, Stuttgart, Germany.
Provenance and peer review Not commissioned; externally peer reviewed.
Data sharing statement Data is made available at the European Genotyping Agency (https://www.ebi.ac.uk/ega/)—study no. EGAS00001002173.