Article Text

Abstract
Objective The latest model of vibration-controlled transient elastography (VCTE) automatically selects M or XL probe according to patients’ body built. We aim to test the application of a unified interpretation of VCTE results with probes appropriate for the body mass index (BMI) and hypothesise that this approach is not affected by hepatic steatosis.
Design We prospectively recruited 496 patients with non-alcoholic fatty liver disease who underwent VCTE by both M and XL probes within 1 week before liver biopsy.
Results 391 (78.8%) and 433 (87.3%) patients had reliable liver stiffness measurement (LSM) (10 successful acquisitions and IQR:median ratio ≤0.30) by M and XL probes, respectively (p<0.001). The area under the receiver operating characteristic curves was similar between the two probes (0.75–0.88 for F2–4, 0.83–0.91 for F4). When used in the same patient, LSM by XL probe was lower than that by M probe (mean difference 2.3 kPa). In contrast, patients with BMI ≥30 kg/m2 had higher LSM regardless of the probe used. When M and XL probes were used in patients with BMI <30 and ≥30 kg/m2, respectively, they yielded nearly identical median LSM at each fibrosis stage and similar diagnostic performance. Severe steatosis did not increase LSM or the rate of false-positive diagnosis by XL probe.
Conclusion High BMI but not severe steatosis increases LSM. The same LSM cut-offs can be used without further adjustment for steatosis when M and XL probes are used according to the appropriate BMI.
- liver cirrhosis
- liver biopsy
- fatty liver
- nonalcoholic steatohepatitis
- hepatic fibrosis
Statistics from Altmetric.com
Significance of this study
What is already known on this subject?
Vibration-controlled transient elastography (VCTE) is an accurate non-invasive test of liver fibrosis.
XL probe was developed for liver stiffness measurement (LSM) in obese patients, but has been shown to generate lower measurement than M probe when used in the same patient.
High body mass index (BMI) and severe hepatic steatosis may be confounders of LSM.
What are the new findings?
XL probe generated lower LSM than M probe in both patients with BMI <30 and ≥30 kg/m2, suggesting that the skin-to-liver capsule distance alone cannot fully explain the difference.
For the same fibrosis stage, patients with BMI ≥30 kg/m2 had higher LSM than those with BMI <30 kg/m2.
When M and XL probes were used in patients with BMI <30 and ≥30 kg/m2, respectively, the median LSM at each fibrosis stage was nearly identical.
Simple LSM cut-offs of <10 kPa and ≥15 kPa could be used to exclude and diagnose compensated advanced chronic liver disease, respectively.
Severe hepatic steatosis did not increase the false-positive diagnosis of fibrosis by XL probe.
How might it impact on clinical practice in the foreseeable future?
When used according to the appropriate body built, the same LSM cut-offs can be applied for both M and XL probes. Using the latest model of VCTE, probe selection can be done automatically.
Adjustment for severe hepatic steatosis is unnecessary when XL probe is used in obese patients.
Introduction
Non-alcoholic fatty liver disease (NAFLD) affects 25% of the global adult population and is one of the leading causes of cirrhosis and hepatocellular carcinoma in western countries.1 By 2030, NAFLD and resulting non-alcoholic steatohepatitis (NASH) are projected to cause 105 430 cases of decompensated cirrhosis, 12 240 cases of hepatocellular carcinoma and 78 300 cases of liver-related deaths.2 Nevertheless, only a minority of patients with NAFLD would develop these complications.3 Therefore, current guidelines recommend non-invasive tests of liver fibrosis as initial assessment of NAFLD.4–6
Among non-invasive tests of fibrosis, vibration-controlled transient elastography (VCTE) is a point-of-care test validated against liver histology in American, European and Asian patients with NAFLD.7–10 Although the applicability of VCTE is lower in obese patients, the use of XL probe allows successful liver stiffness measurement (LSM) in most patients.11–13 The latest models of VCTE also include automatic probe selection based on the skin-to-liver capsule distance, and newer studies followed the probe selection tool and combined the analysis regardless of the probe used.10–14 However, several questions concerning the application of VCTE remain.
First, when applied on the same patient, XL probe generates a lower LSM than M probe.15 On the other hand, high body mass index (BMI) is also associated with increased LSM independent of the fibrosis stage.16 17 Because few studies applied both M and XL probe measurements on the same patients, it is unclear if the same LSM cut-offs can be used when M and XL probes are used according to the appropriate BMI.
Second, although studies have suggested different optimal LSM cut-offs, those represent trade-offs between sensitivity and specificity and may cause confusion when the results are applied in real-life practice. In 2015, experts at the Baveno VI Consensus Workshop recommended LSM cut-offs of 10 and 15 kPa to rule out and rule in compensated advanced chronic liver disease (cACLD), respectively.18 This simple algorithm is easy to apply but needs to be validated in patients with NAFLD for both M and XL probes.
Third, some but not all studies showed that hepatic steatosis led to falsely high LSM by M probe.19 20 The effect of hepatic steatosis on XL probe measurement has not been systematically evaluated.
To answer these three questions, we analysed data from prospective patients with biopsy-proven NAFLD who underwent VCTE by both M and XL probes. We hypothesise that we can apply a unified set of simple LSM cut-offs (‘rule of 5’ as described below) when M and XL probes are used according to the appropriate BMI, and it is unnecessary to adjust for hepatic steatosis when XL probe is used for obese patients.
Patients and methods
Study population
This was a cross-sectional study of a prospective cohort of patients who underwent liver biopsy at two university centres (Bordeaux University Hospital, France and Prince of Wales Hospital, Hong Kong). We included patients aged 18 years or above with biopsy-proven NAFLD. Patients with excessive alcohol consumption (>30 g/day in men and >20 g/day in women), secondary fatty liver (eg, use of methotrexate or tamoxifen), positive hepatitis B surface antigen or anti-HCV antibody, evidence of other liver diseases and malignancies in the past 5 years were excluded.
Clinical assessment
We performed clinical assessments within 1 week before liver biopsy. We recorded the medical history and performed anthropometric measurements including body weight, body height and waist circumference. Waist circumference was measured at a level midway between the lower rib margin and iliac crest with the tape all around the body in the horizontal position. BMI was calculated as body weight (kg) divided by body height (m) squared. We divided the patients into BMI <30 and ≥30 kg/m2 according to the European recommendation on M and XL probe selection.21 In addition, central obesity was defined as a waist circumference ≥94 cm in men from France, ≥90 cm in men from Hong Kong and ≥80 cm in women from both centres according to ethnic-specific cut-offs.22
Vibration-controlled transient elastography
LSM by VCTE (FibroScan; Echosens, Paris, France) was performed using both M and XL probes within 1 week before liver biopsy according to the instructions and training by the manufacturer as described previously.15 All patients were fasted overnight for at least 8 hours for blood tests and LSM. An examination was considered reliable if we obtained ≥10 valid measurements and the IQR:median ratio (IQR:M) of LSM was ≤0.3. All operators were blinded to the diagnosis and clinical data, and had performed more than 50 examinations before the beginning of this study. To validate simple LSM cut-offs to facilitate clinical application, we primarily evaluated the ‘rule of 5’ modified from the Baveno VI recommendations: <5 kPa to rule out significant fibrosis, <10 kPa to rule out cACLD and >15 kPa to rule in probable cACLD.18 The term cACLD was proposed to better reflect that the spectrum of severe fibrosis and cirrhosis is a continuum in asymptomatic patients, and patients with cACLD are at risk of clinically significant portal hypertension and hepatic complications. For the purpose of this study, we validated LSM against both F3–F4 and F4 disease at cut-offs of 10 and 15 kPa.
Liver histology
Liver histology served as the reference standard of this study. We performed percutaneous liver biopsy using the 16G Temno Tru-Cut needle. Two experienced pathologists (AW-HC and BLB) evaluated liver histology and were blinded to the clinical data. Each pathologist scored all specimens from the respective centre. Liver specimens were scored using the NASH Clinical Research Network system.23 In particular, a five-point (0–4) fibrosis staging system was used, with F3=bridging fibrosis and F4=cirrhosis.23 Steatosis was scored according to the percentage of parenchymal involvement by steatosis, with S1=5%–33%, S2=34–66% and S3=>66%.
Statistical analysis
All statistical tests were performed using IBM SPSS Statistics V.24 (IBM) and R software V.2.5.1 (R Development Core Team, Vienna, Austria). Continuous variables were expressed as mean±SD or median (IQR) and compared using the unpaired t-test and Mann-Whitney U test as appropriate; categorical variables were compared using the χ2 test. We evaluated the accuracy of LSM in detecting various fibrosis stages by the area under the receiver operating characteristic curve (AUROC) and calculated the corresponding sensitivities, specificities, positive and negative predictive values, and overall accuracies. DeLong test was used to compare AUROC of different tests in the same patient population, whereas AUROC of the same tests in different patient populations was compared using the method by Hanley and McNeil.24 For all analysis comparing the performance of M and XL probes, we included patients with reliable measurements by both probes. A two-sided p value of <0.05 was taken as statistically significant. A sample size of 496 patients provided the statistical power to determine AUROC with a SE of 0.03–0.04 at a 5% significance level. Because the study validated existing LSM cut-offs, the cohort was not further divided into derivation and validation cohorts.
Results
From October 2009 to December 2017, 600 adult patients with NAFLD underwent liver biopsy and VCTE. After excluding 104 patients with suboptimal liver specimens (53 French patients and 51 Hong Kong patients had <15 mm in length and/or <6 portal tracts), 496 patients were included in the final analysis (232 from France and 264 from Hong Kong). Both centres included middle-aged patients with slight female preponderance (table 1). French patients had higher BMI and aspartate aminotransferase and gamma-glutamyltransferase levels, but were less likely to have diabetes. French patients also had higher NAFLD activity score and fibrosis stage. Overall, 36.7% of the entire cohort had F3–F4 fibrosis.
Clinical characteristics of patients with NAFLD
Reliable LSM by M and XL probes
Ten successful measurements were obtained with M probe in 420 (84.7%) patients (177/232 (76.3%) in France and 243/264 (92.0%) in Hong Kong; p<0.001) and with XL probe in 482 (97.2%) patients (224/232 (96.6%) in France and 258/264 (97.7%) in Hong Kong; p=0.43). Among patients with 10 successful measurements, IQR:M was ≤0.30 in 391/420 (93.1%) patients (164/177 (92.7%) in France and 227/243 (93.4%) in Hong Kong; p=0.76) by M probe and in 433/482 (89.8%) patients (196/224 (87.5%) in France and 237/258 (91.9%) in Hong Kong; p=0.11) by XL probe. Taken together, 391 (78.8%) patients had reliable M probe LSM (164/232 (70.7%) in France and 227/264 (86.0%) in Hong Kong; p<0.001) and 433 (87.3%) patients had reliable XL probe LSM (196/232 (84.5%) in France and 237/264 (89.8%) in Hong Kong; p=0.078).
Correlation between M and XL probes
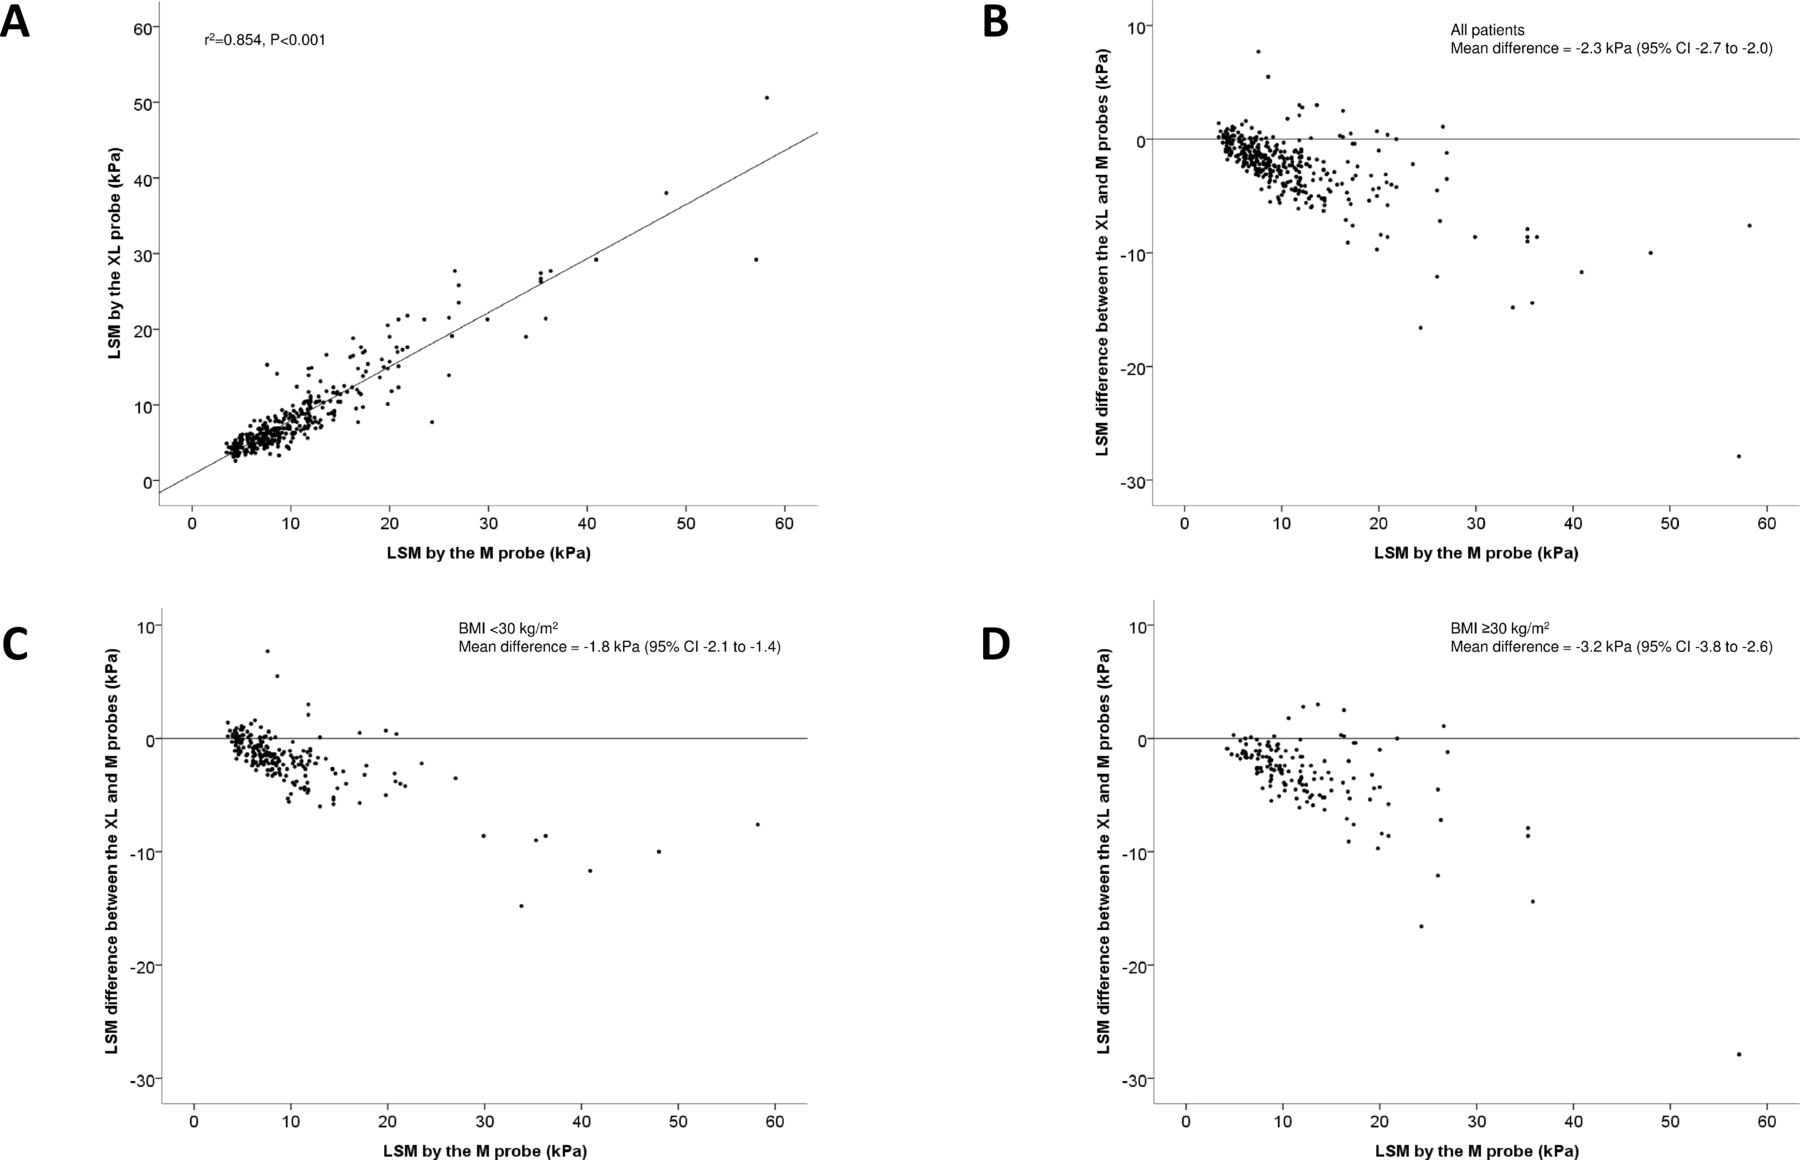
LSM by M and XL probes had good correlation between each other (r2=0.854, p<0.001; figure 1A). However, LSM by XL probe was lower than that by M probe in the majority of cases (mean difference=−2.3 kPa, 95% CI −2.7 to −2.0; figure 1B). This corresponds to a median percentage difference of −21% (IQR −9% to −32%). In the overall population, the median LSM was 5.8 versus 4.8 kPa for F0, 6.8 versus 6.1 kPa for F1, 8.8 versus 6.9 kPa for F2, 11.8 versus 8.8 kPa for F3 and 16.3 versus 14.8 kPa for F4 using M and XL probes, respectively (online supplementary table 1). A significant difference in the LSM by M and XL probes was observed in both patients with BMI <30 and ≥30 kg/m2 (figure 1C and D). Among patients with BMI <30 kg/m2, the median LSM was 5.1 versus 4.7 kPa for F0, 6.7 versus 5.6 kPa for F1, 7.9 versus 6.2 kPa for F2, 11.4 versus 8.4 kPa for F3 and 14.0 versus 14.8 kPa for F4 using M and XL probes, respectively (online supplementary table 1). Among patients with BMI ≥30 kg/m2, the median LSM was 8.1 versus 5.5 kPa for F0, 7.6 versus 6.8 kPa for F1, 9.7 versus 7.4 kPa for F2, 12.0 versus 8.9 kPa for F3 and 17.3 versus 14.9 kPa for F4 using M and XL probes, respectively.
Supplementary file 1

(A) Correlation between liver stiffness measurement (LSM) by M and XL probes in the entire population. (B–D) Bland-Altman plots depicting the difference in LSM by M and XL probes in the entire population (B) and in patients with body mass index (BMI) <30 (C) and ≥30 kg/m2 (D).
Validating probe selection by BMI
In the entire population, the AUROC of LSM to detect F2–F4, F3–F4 and F4 fibrosis ranged from 0.81 to 0.89, with no significant difference between M and XL probes (table 2). Likewise, both probes yielded similar AUROC in patients with BMI <30 or ≥30 kg/m2. The AUROC for F2–F4 and F3–F4 tended to be lower in patients with BMI ≥30 kg/m2 for both probes, but the AUROC for F4 was similar in patients with different BMI.
AUROC of liver stiffness measurement by the M probe and XL probe
Although XL probe generated lower LSM than M probe in all subgroups, patients with BMI ≥30 kg/m2 also consistently had higher LSM than those with BMI <30 kg/m2 at all fibrosis stages and for both probes (online supplementary table 1). Importantly, the mean and median LSM was similar when M probe was used for patients with BMI <30 kg/m2 and XL probe was used for those with BMI ≥30 kg/m2 (figure 2), suggesting that the same cut-offs might be used when the probe was selected according to BMI. Likewise, patients without central obesity and with central obesity had similar LSM at the same fibrosis stage when the M and XL probes were used, respectively (online supplementary table 2).

Boxplot of liver stiffness measurement in patients with non-alcoholic fatty liver disease. When M probe was used in patients with body mass index (BMI) <30 kg/m2 and XL probe in those with BMI ≥30 kg/m2, the median liver stiffness at each fibrosis stage was similar. The horizontal lines in the boxes represent median values, whereas the boxes present the IQRs. The whiskers represent 1.5 times the IQR.
Furthermore, because Asian patients tend to have central fat deposition and start to develop NAFLD at a lower BMI,25 we further explored if BMI at a level of 25–29.9 kg/m2 also had an impact on LSM. Overall, the AUROC of LSM for each fibrosis target did not differ between patients with BMI <25 and 25–29.9 kg/m2 in both the French and Hong Kong cohorts (online supplementary table 3). In addition, at F0–F2, Hong Kong patients with BMI <25 and 25–29.9 kg/m2 had similar LSM, which was lower than that in patients with BMI ≥30 kg/m2 (online supplementary table 4).
‘Rule of 5’
Table 3 shows the detailed diagnostic performance of M and XL probe in BMI subgroups. As expected, because M probe generated higher LSM than XL probe, the former had a higher sensitivity and negative predictive value but a lower specificity and positive predictive value when the same cut-offs were used in the same subgroups. Similarly, when the same probe was used, LSM had a lower sensitivity but higher specificity in patients with BMI <30 kg/m2 than those ≥30 kg/m2. The positive and negative predictive values in the BMI subgroups could not be directly compared because of different fibrosis stage distribution.
Application of unified LSM cut-offs when M and XL probes were used in patients with BMI <30 and ≥30 kg/m2, respectively
When M probe was used for patients with BMI <30 kg/m2 and XL probe was used for those with BMI ≥30 kg/m2, the sensitivity for F2–F4 fibrosis was 97.4% for M probe and 91.8% for XL probe at an LSM cut-off of 5 kPa (table 3). At a cut-off of 10 kPa, the corresponding sensitivity for F3–F4 fibrosis was 72.7% and 56.3%, and the sensitivity for F4 fibrosis was 84.4% and 78.4%, respectively. At a cut-off of 15 kPa, the specificity for F3–F4 fibrosis was 98.7% and 96.5%, and the specificity for F4 fibrosis was 95.5% and 93.0%, respectively.
Impact of hepatic steatosis
In general, grade 3 steatosis was not associated with increased LSM by M and XL probes (table 4). Grade 3 steatosis did not increase the LSM by XL probe at all fibrosis stages. Likewise, grade 3 steatosis did not increase the false-positive rate by XL probe at a range of LSM cut-offs for different fibrosis stages (table 5). The same holds true for patients with BMI <30 and ≥30 kg/m2.
LSM by fibrosis stage in patients with different steatosis grades
False-positive diagnosis of different fibrosis stages according to probe selection and steatosis grades
Discussion
We set out to answer three questions regarding the use of XL probe in patients with NAFLD. First, we showed that when M and XL probes were used in patients with BMI <30 and ≥30 kg/m2, respectively, they generated similar liver stiffness values for each fibrosis stage, and the same cut-offs could be used. Second, the ‘rule of 5’ cut-offs had reasonable accuracy in excluding and ruling in significant fibrosis and cACLD. Third, severe hepatic steatosis did not affect LSM by XL probe or increase the risk of false-positive results.
When XL probe was first introduced, it was immediately apparent that it led to a higher success rate of measurements in obese individuals but generated lower LSM than M probe when used in the same patient.15 There were two possible explanations for this observation. First, M and XL probes measure the liver at different depths (25–65 mm and 35–75 mm from the skin surface, respectively).26 In obese patients, part of the tissues measured by M probe are outside the liver, and this may affect LSM. Second, the difference may be due to an inherent physical property from the use of different ultrasound frequencies (3.5 MHz for M probe and 2.5 MHz for XL probe), which in turn would affect the estimation of Young’s modulus. In our study, a significant difference between LSM by M and XL probes was observed in both patients with BMI <30 and ≥30 kg/m2 (figure 1C and D). This suggests that the depths of measurement alone cannot fully explain the difference in liver stiffness values.
On the other hand, consistent with previous reports, we showed that BMI ≥30 kg/m2 was associated with higher liver stiffness values regardless of the probe used (online supplementary table 1).16 17 Because XL probe generates lower liver stiffness values and obesity increases liver stiffness values, the two confounding effects partially cancel each other. In fact, when we used M probe in patients with BMI <30 kg/m2 and XL probe in those ≥30 kg/m2, the mean and median LSM by fibrosis stage was almost identical (online supplementary table 1, figure 2). Our findings support the European and Latin American guidelines, which recommend the use of XL probe in patients with BMI ≥30 kg/m2.21 While the AUROC of M probe measurements remained high in patients with BMI ≥30 kg/m2, a higher set of LSM cut-offs would be needed, adding complexity and confusion to the application of LSM in clinical practice.
Notably, the overall accuracy for F2–F4 and F3–F4 fibrosis was lower in patients with BMI ≥30 kg/m2 (table 2). When stratified by centre, this observation only occurred in the French but not Hong Kong cohort (online supplementary table 3). The main reason is probably because the French cohort was more obese. Although the XL probe allows a measurement depth of 35–75 mm, this may still be insufficient among patients with severe obesity. In such patients, inadequate penetration of ultrasound wave into the liver parenchyma and suboptimal probe placement may affect LSM performance. This calls for further probe refinement for patients with morbid obesity. Alternatively, magnetic resonance elastography is a good alternative in this context.27 28
Because of different study populations, previous studies have proposed different LSM cut-offs for various fibrosis stages.7 11 14 15 19 29 After all, the selection of cut-offs represents a trade-off between sensitivity and specificity. It is also understood the probability of advanced fibrosis increases as the liver stiffness value is farther from the cut-off.30 To simplify matters, the Baveno VI Faculty has proposed simple cut-offs for routine clinical use.18 In this study, we confirmed that a cut-off of 10 kPa had >90% negative predictive value in excluding F4 disease, and a cut-off of 15 kPa had 86%–92% positive predictive value in diagnosing F3–F4 fibrosis (table 3). On the other hand, while both M and XL probes had >90% sensitivity for F2–F4 fibrosis at a cut-off of 5 kPa, the negative predictive values were 93% for M probe in non-obese patients but only 58% for XL probe in obese patients. This reflects the higher pretest probability of significant fibrosis in obese patients. Thus, LSM may be sufficient to exclude F3–F4 fibrosis but not F2–F4 fibrosis in obese patients.
The final question addressed by this study is whether LSM by XL probe is affected by severe steatosis. Previous studies using M probe have yielded conflicting results.7 8 19 20 In our study, XL probe yielded almost identical mean and median LSM in patients with grade 1–2 versus grade 3 steatosis (table 4). Grade 3 steatosis also did not increase the false-positive rate for the diagnosis of different fibrosis stages (table 5). We believe BMI rather than steatosis grade is the more important confounder of LSM.
The strengths of our study include the large sample size and the use of both M and XL probes, allowing detailed analysis of probe performance in different patient groups. We also included patients from both Europe and Asia. On the other hand, our study also has a few limitations. First, liver biopsy is an imperfect reference standard with potential sampling bias. We therefore only included good-quality biopsy samples which were read by two experienced pathologists. Second, the patients were from referral centres and were more likely to have advanced disease. We expect the negative predictive values of LSM to be even higher at primary and secondary care settings. Third, our study focused on BMI and did not use skin-to-liver capsule distance for probe selection. However, the main advantage of VCTE is that it is a quick point-of-care assessment. The need for additional ultrasonographic assessment before LSM will unlikely gain wide acceptance. Besides, now that the VCTE machine also provides an automatic probe selection tool, measurement of skin-to-liver capsule distance has become obsolete. Finally, for historical reasons, controlled attenuation parameter was not available for patients who were recruited earlier and was therefore not included in the analysis. Nevertheless, as even severe hepatic steatosis did not affect the performance of XL probe, adjustment for controlled attenuation parameter is unlikely to be necessary.
In conclusion, clinicians may use the same LSM cut-offs when M and XL probes are used according to BMI. Based on our results, XL probe is preferred in patients with BMI ≥30 kg/m2 even when it is possible to measure LSM with M probe. The ‘rule of 5’ modified from the Baveno VI Consensus is a simple algorithm that can be applied in routine clinical practice. BMI but not steatosis affects LSM by XL probe. Interpretation of LSM by XL probe does not need to be adjusted for hepatic steatosis. Together with our recent work on varices in patients with NASH-associated cirrhosis, clinicians may make management decisions based on LSM (figure 3).31

Unified interpretation of liver stiffness measurement in patients with non-alcoholic fatty liver disease (NAFLD) based on the ‘rule of 5’. When M and XL probes are used according to body mass index (BMI), the same liver stiffness cut-offs may be used. cACLD, compensated advanced chronic liver disease; HCC, hepatocellular carcinoma.
Acknowledgments
We would like to thank Mr Yee-Kit Tse for his statistical support.
Part of the data were presented at the annual meeting of the American Association for the Study of Liver Diseases on 11 November 2018 (Wong et al. Unified interpretation of liver stiffness measurement by M and XL probes in nonalcoholic fatty liver disease patients with different body mass index and steatosis grades. Hepatology 2018;68(Suppl):997A).
References
Footnotes
Contributors VW-SW, WKC and VdL designed the study. VW-SW, MI, GL-HW, SS, AW-HC, WM, SS-TS, JF, BLB and VdL collected patient data. AW-HC and BLB performed histological assessment. HL-YC and VdL provided administrative support. VW-SW and VdL performed statistical analysis and drafted the manuscript. All authors approved the final version of the manuscript.
Funding This project was partially supported by a grant from the Research Grant Council of the Hong Kong SAR Government (Project Ref 14108916).
Competing interests VW-SW, GL-HW, HL-YC and VdL have served as speakers for Echosens.
Patient consent Obtained.
Ethics approval The study protocol was approved by the institutional review boards of Bordeaux University Hospital, France and Prince of Wales Hospital, Hong Kong.
Provenance and peer review Not commissioned; externally peer reviewed.