Article Text

Abstract
Objective Non-coeliac gluten sensitivity (NCGS) is characterised by intestinal and extraintestinal symptoms related to the ingestion of gluten-containing foods, in the absence of coeliac disease (CD) and wheat allergy. No biomarkers are available to diagnose NCGS and the gold standard double-blind placebo-controlled gluten challenge is clinically impractical. The aim of our work was to investigate the role of serum zonulin as a diagnostic biomarker of NCGS and to develop a diagnostic algorithm.
Design In a multicentre study, we enrolled 86 patients with either self-reported or double-blind confirmed NCGS, 59 patients with diarrhoea-predominant IBS (IBS-D), 15 patients with CD and 25 asymptomatic controls (AC). Zonulin serum levels were assessed and the associated diagnostic power calculated. Clinical and symptomatic data were recorded. The effect of diet on zonulin levels was evaluated in a subgroup of patients with NCGS.
Results Compared with ACs, the NCGS, irrespective of modality of diagnosis, and patients with CD had significantly increased levels of zonulin, as did both NCGS and patients with CD compared with participants with IBS-D. Self-reported NCGS showed increased zonulin levels compared with double-blind confirmed and not-confirmed NCGS. Six-month wheat avoidance significantly reduced zonulin levels only in HLA-DQ2/8-positive participants with NCGS. The diagnostic accuracy of zonulin levels in distinguishing NCGS from IBS-D was 81%. After exclusion of CD, a diagnostic algorithm combining zonulin levels, symptoms and gender improved the accuracy to 89%.
Conclusion Zonulin can be considered a diagnostic biomarker in NCGS and combined with demographic and clinical data differentiates NCGS from IBS-D with high accuracy. Wheat withdrawal was associated with a reduction in zonulin levels only in NCGS carrying HLA genotype.
- epithelial barrier
- functional bowel disorder
- irritable bowel syndrome
- nutrition
Statistics from Altmetric.com
Significance of this study
What is already known on this subject?
Non-coeliac gluten sensitivity (NCGS) is characterised by intestinal and extraintestinal symptoms related to the ingestion of gluten-containing foods, in the absence of coeliac disease (CD) and wheat allergy.
No biomarkers are available to diagnose NCGS.
What are the new findings?
Zonulin can be considered a diagnostic biomarker in NCGS and combined with clinical data differentiates NCGS from IBS-D with high accuracy.
How might it impact on clinical practice in the foreseeable future?
Distinguishing NCGS from IBS-D is of greater value in clinical practice, where the clinician is confronted with the dilemma of placing a patient on a gluten-free diet.
In addition, simplicity and non-invasiveness of the proposed test suggest that zonulin and the related algorithm could be a clinically valid diagnostic biomarker in NCGS.
Introduction
Non-coeliac gluten sensitivity (NCGS) is an increasingly recognised condition characterised by intestinal and extraintestinal symptoms related to the ingestion of gluten-containing foods in patients for whom coeliac disease (CD) and wheat allergy have been excluded.1 Symptoms of NCGS are indistinguishable from those of functional GI disorders and particularly from irritable bowel syndrome (IBS).2 In the absence of available biomarkers, the distinction of NCGS from IBS relies on double-blind gluten challenge protocols, which are impractical in the daily clinical setting. The identification of a valid biomarker for NCGS would help in establishing a positive diagnosis, validate the condition, and guide gluten avoidance strategies.
It has been proposed that patients with NCGS mount mucosal and systemic autoimmunity against gluten.3 4 Tight junction opening increases intestinal permeability and has been claimed as an initiating event in NCGS and CD, as suggested by studies in mucosal explants obtained from patients in gluten-containing (GCD) versus non-gluten-containing diets.5
Zonulin is a single-chain protein corresponding to prehaptoglobin 2, the endogenous counterpart of Vibrio cholerae toxin and the only known human protein that can reversibly open tight junctions.6 In CD and type 1 diabetes, higher zonulin release7 8 correlates with increased epithelial permeability.8 Gliadin, a known symptom trigger in CD, NCGS5 and IBS,9 increases intestinal permeability through the release of zonulin from epithelial cells.10–12
The aim of the present work was to investigate the role of serum zonulin as a diagnostic biomarker in NCGS and to define an algorithm to differentiate NCGS from IBS.
Materials and methods
Participants
Participants were consecutively recruited from three Italian academic centres (Department of Medical and Surgical Sciences of the University of Bologna; First Department of Internal Medicine, S. Matteo Hospital Foundation, University of Pavia and Department of Life, Health and Environmental Sciences, Gastroenterology Unit, University of L’Aquila) from January to December 2015. The population breakdown included asymptomatic controls (AC, n=25, Bologna, n=15, L’Aquila, n=10), patients with NCGS (n=86, Bologna, n=36; Pavia, n=35; L’Aquila n=15), patients with Rome III predominant-diarrhoea IBS (IBS-D, n=59, Bologna, n=25, Pavia, n=20, L’Aquila, n=14) and patients with CD (n=15).
AC were recruited among patients undergoing colonoscopy for colorectal cancer screening or follow-up for polypectomy after exclusion of GI symptoms and among healthy volunteers in whom the presence of digestive symptoms was excluded by the Italian version of the Gastrointestinal Symptom Rating Score (GSRS).
All patients with NCGS reported intestinal and/or extraintestinal symptoms after ingestion of gluten-containing foods, including wheat, rye or barley were further characterised using a modified version of the GSRS designed to rate symptoms associated with NCGS.13 14 The NCGS group was made up by a subgroup of 49 patients with NCGS belonging to a previously published randomised, double-blind, placebo-controlled, cross-over study15 and 27 had a confirmed diagnosis. The confirmation of the diagnosis was achieved by applying a modified version of previously published criteria.16 Patients were asked to fill in a daily questionnaire to assess a rating scale of both intestinal and extraintestinal symptoms.15 The overall symptom score15 was calculated for gluten week (ScoreG) and placebo week (ScoreP). The patients who reported a difference between ScoreG and ScoreP over 30% of ScoreP were considered sensitive to gluten (from now on called confirmed-NCGS). In addition, in the study were prospectively included also 37 patients with NCGS meeting self-reported NCGS criteria.1 A decrease of the overall symptom score after 6 months of gluten-free diet (GFD) ≥50% of the score recorded during GCD was considered as positive diagnosis to be included in the present study as self-reported NCGS. Finally, symptoms recurred after re-introduction of gluten-containing foods lasting for up to 1 month.
Patients with IBS-D were diagnosed according to Rome III criteria.17 Exclusion criteria for participants with IBS and NCGS, all assessed through patient history, consultations and laboratory tests, were consuming a GFD during the past 6 months; a positive test result for specific IgA anti-endomysial and/or anti-tissue transglutaminase (tTG) autoantibodies; intestinal histology findings characteristic of CD; a positive test result for wheat allergy (specific IgE serology, skin prick test); corticosteroid or non-steroidal anti-inflammatory drug use; major abdominal surgery and organic or severe psychiatric disorders. Patients with CD were all seen in dedicated outpatient clinics (Bologna) and diagnosis was based on histological, serological and genetic criteria according to established guidelines.18 Histological grading was based on Marsh classification modified by Oberhüber et al 19; serology involved detection of anti-tTG and anti-endomysial IgA antibodies and genotyping involved human leucocyte antigen (HLA) identification of DQ2-DQ8 haplotypes characteristic of CD. No data on HLA-genotype were available for the IBS-D group.
The effect of diet on zonulin serum levels was evaluated in a subgroup of 44 patients with NCGS: 32 belonged to a previously published study,15 while the remaining 12 underwent gluten withdrawal for the present study. In all cases, the same protocol was applied: zonulin serum levels during a GCD were compared with zonulin serum levels after 6 months of a self-monitored diet free of wheat, rye and barley (GFD).
Clinical and laboratory data
Clinical data recorded for the studied population included IgA anti-tTG, IgG deamidated gliadin peptide (DGP) and total-IgE antibody titres. Small intestinal biopsy was obtained in NCGS and patients with CD on a GCD and evaluated according to the Marsh-Oberhüber classification.
Each patient completed an Italian, modified version of the Bowel Disease Questionnaire to assess symptoms.
Briefly, this questionnaire rates the severity and frequency of abdominal pain and distension using a 5-point Likert scale. Symptom severity was graded based on symptom influence on a patient’s usual activity, as previously reported,20 while frequency was graded as follows: 0=absent; 1=up to 1 day per week; 2=2 or 3 days per week; 3=4–6 days per week and 4=daily. Quality of life, as an expression of general well-being, was monitored using a 0–10 visual analogue scale (0=“I have never felt so bad” to 10=“I have never felt so good”).20
Additional biological and clinical data in patients with NCGS
Anti-gliadin antibodies (AGA, IgA and IgG) and HLA genotype were analysed in patients with NCGS. The following extraintestinal symptoms (tiredness, headache, anxiety, foggy mind, numbness, joint/muscle pain, skin rash, weight loss, anaemia, depression, dermatitis, rhinitis, asthma) were recorded according to previously published criteria1 using the following scale: 0=absent; 1=occasionally present; 2=frequently present and 3=always present with a severe worsening of quality of life.
Zonulin assay
All subjects underwent zonulin serum assay while on normal GCD; a subgroup of 44 patients with NCGS underwent gluten withdrawal and in these patients zonulin levels were assessed during GCD and after 6 months of gluten withdrawal.
Blood samples were centrifuged at 3000 rpm for 7 min, and serum was collected and stored at −20°C until analysis. Protein was quantified using a NanoDrop 2000 spectrophotometer (Thermo Scientific, Milan, Italy).
ELISA was performed using a Zonulin ELISA Kit (Cusabio, Hubei, China) following the manufacturer’s instructions (detection range: 0.625–40 ng/mL; sensitivity: 0.156 ng/mL). Each sample was analysed in duplicate and zonulin normalised to total protein and reported as picograms of zonulin per milligram total protein. All the samples were centralised in Bologna and analysed in a blinded fashion.
Sample size determination
The sample size determination was based on data obtained from our previous pilot studies,21 and was determined with the aid of “PS Power and Sample Size Calculations” package22 adopting the Dupont and Plummer procedure.23 24 (online supplementary appendix, “Power calculation and sample size”).
Supplemental material
Statistical analysis
Study quality was assessed using the STAndards for the Reporting of Diagnostic Accuracy (STARD) initiative criteria with a 30-point STARD checklist.
Scalar data are reported as mean±SD, as well as median and IQR (within brackets) while absolute and relative frequencies are reported for discrete data. All statistical analyses were performed using IBM SPSS Statistics package (V.23.0 for Windows, IBM, Armonk, New York, USA). The significance of overall differences of scalar data among groups was assessed by the Kruskal-Wallis test and the post hoc comparison between pairs of groups was evaluated by means of the Kruskal-Wallis test adjusted by the Bonferroni correction for multiple tests. The Pearson’s χ2 test and the Fisher’s exact test were used to analyse discrete data. Paired comparisons were assessed by using the Wilcoxon test while the Spearman’s test was applied for correlation analyses. Receiver operating characteristic (ROC) curve analyses were used to evaluate the accuracy in discriminating between different conditions according to zonulin serum levels and diagnostic index values. The best cut-off of these discrimination values were chosen by using a maximum likelihood method.25 In addition, an a priori aim of the present study was the evaluation of the accuracy of zonulin in discriminating gluten-related disorders (ie, patients with NCGS plus CD) and gluten-unrelated conditions (AC plus IBS-D). Finally, zonulin serum levels and diagnostic index values were compared between confirmed, not-confirmed and self-reported NCGS. Two-tailed p values <0.05 were considered to be statistically significant.
Algorithm procedure
Backward stepwise multivariate logistic regression was applied to identify variables to be included in a diagnostic algorithm able to distinguish NCGS and IBS-D (online supplementary appendix, ‘Algorithm procedure’). The probabilities associated with the diagnosis of IBS-D or NCGS were calculated as reported in online supplementary appendix.
Results
Participants
Table 1 reports the demographic, biological and clinical data of study participants. The percentage of female was different among the groups (p=0.001) and NCGS group had a higher percentage of females compared with IBS-D group (p<0.001). Anti-tTG and anti-DGP antibodies were positive in all patients with CD and negative in all patients with IBS. One subject with anti-tTG-positive antibodies and three subjects with anti-DGP-positive antibodies were categorised as patients with NCGS because both genetic and histology features were negative for CD. The percentage of patients positive for IgE was significantly higher in the NCGS group compared with CD group (p<0.001). On duodenal biopsies, 65.1% of patients with NCGS were Marsh 0 and 34.9% were Marsh 1. Patients with NCGS showed lower quality-of-life VAS values compared with patients with IBS and CD (p<0.001 and p<0.01, respectively) and higher distension severity and frequency scores compared with IBS (p=0.004 and p=0.002, respectively).
Demographic, biological, histopathological and clinical characteristics of the four study groups. Data are shown as mean±SD, median and IQR (in brackets) or absolute and relative frequencies
Biological and clinical data of patients with NCGS are shown in online supplementary table S1. A lower percentage of positive patients was found for IgA AGA (>15 IU/mL: n=4; 4.7%) than for IgG AGA (>50 IU/mL: n=23; 27.1%), and 18 patients were HLA-DQ2 positive (20.9%). Among the extraintestinal symptoms, tiredness and headache had the highest scores, and no patient with NCGS had asthma.
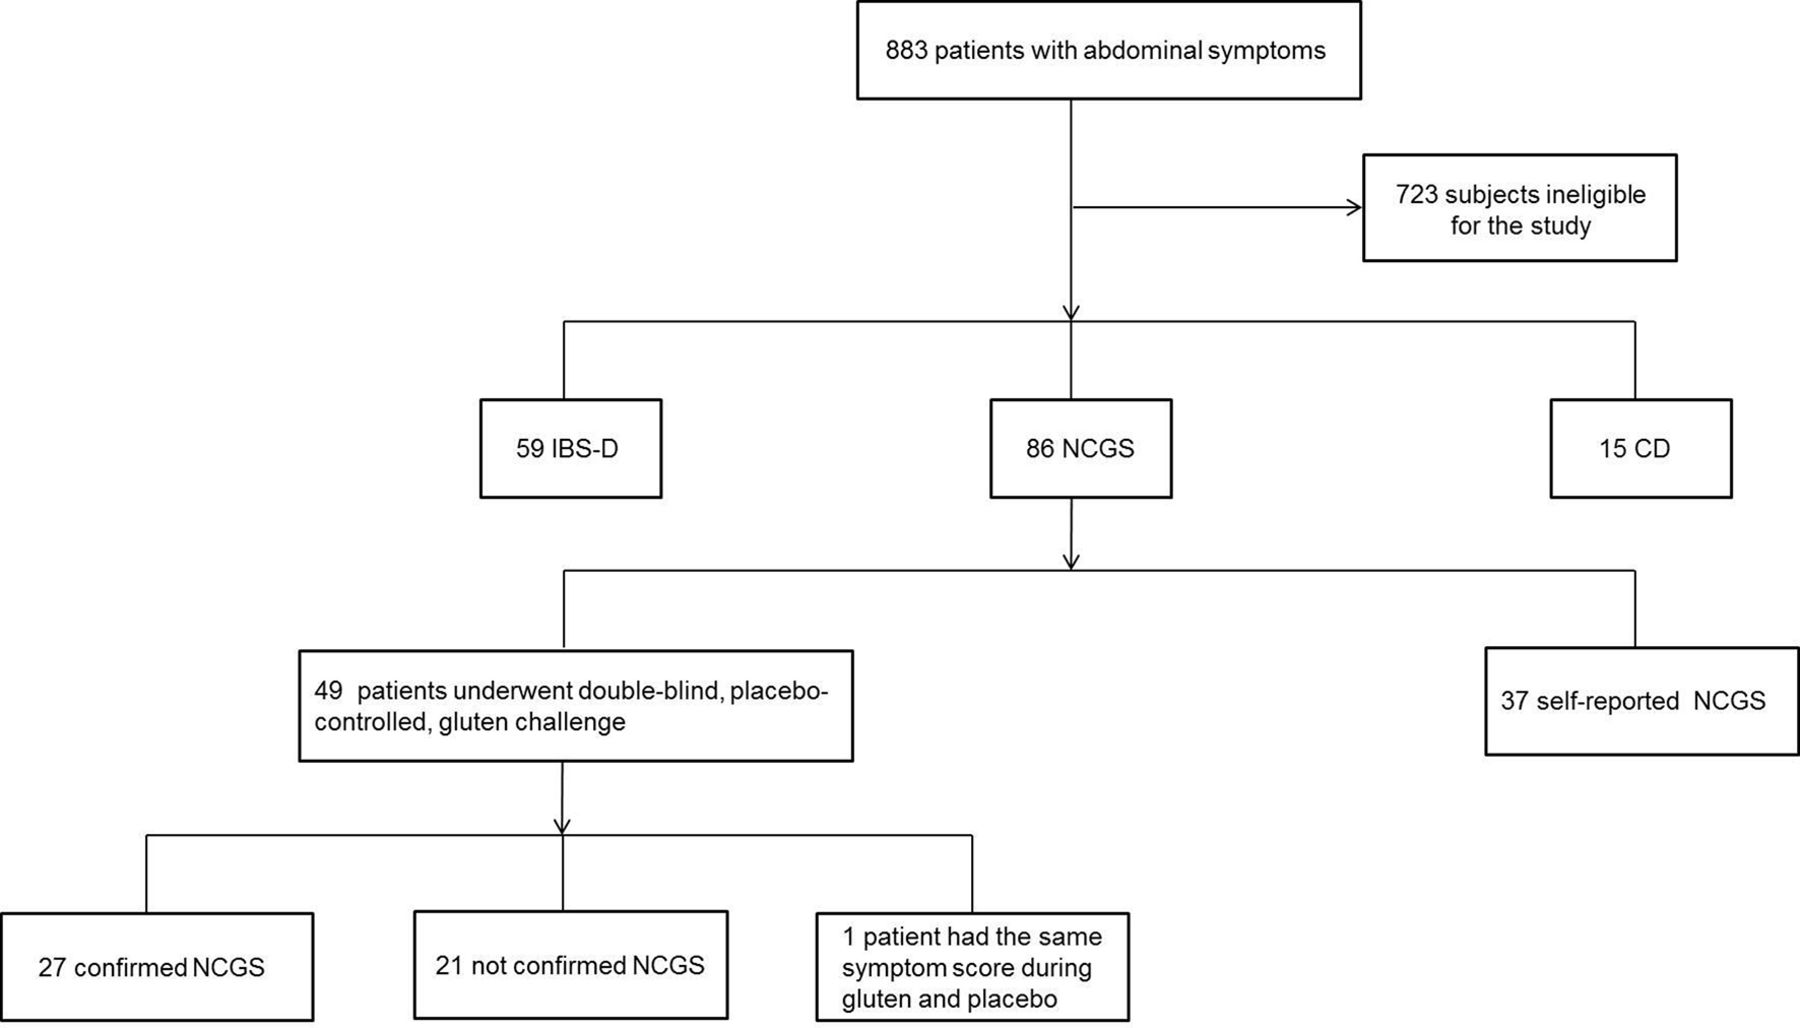
According to the proposed criteria for the definition of NCGS, 27 patients (56.3%) fulfilled the definition of confirmed NCGS, 21 patients (43.8%) were not confirmed, while 1 patient was not evaluable as reported the same value for ScoreG and ScoreP (figure 1). Thus, out of the 85 evaluable patients of the overall NCGS group, 43.5% (n=37) were self-reported NCGS, 31.8% were confirmed NCGS and 24.7% were not confirmed NCGS.

Patient flow diagram. Eight hundred and eighty-three patients with abdominal symptoms were screened as potentially eligible for the present study. One hundred and sixty of them met the inclusion criteria and included in the study, precisely: 59 IBS-D, 15 CD and 86 NCGS. This last group includes 37 self-reported patients recruited for the present study and 49 patients belonging to a previously published DBPC gluten challenge study.15 A revised version of the Salerno criteria were applied to the group of 49 patients to confirm or not the NCGS diagnosis: 27 were confirmed, 21 were not confirmed and 1 patient was not classified having the same symptom score during gluten and placebo. CD, coeliac disease; IBS-D, diarrhoea-predominand IBS; NCGS, non-coeliac gluten sensitivity.
Zonulin serum levels
As shown in figure 2, zonulin serum levels were significantly different among the four groups (p<0.001). No difference emerged in zonulin serum levels between IBS-D (7.9±10.7; 3.5 (0.0–12.8) pg/mg total protein) and ACs (5.5±5.5; 4.5 (0.3–8.8) pg/mg total protein). Compared with IBS-D, significantly higher serum levels of zonulin were found in both NCGS (35.8±73.9; 21.5 (11.2–35.4) pg/mg total protein; p<0.001) and CD (33.3±16.2; 33.4 (17.9–45.5) pg/mg total protein; p<0.001) patients, while no significant difference was found between patients with CD and NCGS (p=0.810).

Zonulin serum levels in the four study groups. Zonulin serum levels differed significantly among the four groups (p<0.001, Kruskal-Wallis test). Boxes show IQRs (ends) and median values (solid crossbars). P values among pairs of groups are shown at the top of the figure (Kruskal-Wallis test adjusted by the Bonferroni correction). AC, asymptomatic controls; CD, coeliac disease; IBS-D, diarrhoea-predominand IBS; NCGS, non-coeliac gluten sensitivity.
Self-reported NCGS (52.0±104.1 pg/mg total protein) showed increased zonulin levels compared with confirmed (20.1±12.5 pg/mg total protein; p=0.023) and not-confirmed NCGS (27.7±50.6 pg/mg total protein; p=0.011). No difference emerged between confirmed and not-confirmed NCGS (p=1.000) (online supplementary figure S1).
Compared with IBS-D, significantly higher zonulin serum levels were found in confirmed (p<0.001), not-confirmed (p=0.024) and self-reported NCGS (p<0.001).
The differences among the four groups did not change expressing zonulin serum levels as absolute values (ng/mL) (online supplementary figure S2).
Relationships between zonulin and clinical data
The relationships between zonulin serum levels and clinical data, evaluated in the 185 study participants, are shown in online supplementary table S2. Considering the study population altogether, zonulin serum levels correlated positively with abdominal distension severity (p=0.025) and frequency (p=0.001) and inversely with quality-of-life VAS values (p=0.012). In the NCGS group, zonulin was significantly correlated with age (negative, p=0.006), sex (p=0.021), IgE antibody titre (p=0.019), abdominal pain and distension frequency (p=0.027 and p=0.009, respectively) and anxiety and numbness (p=0.043 and p=0.045, respectively, not shown). In the CD group, significant correlations emerged between zonulin serum levels and age (p=0.009), anti-tTG antibody titre (positive; p=0.016) and quality of life (negative; p=0.041). No significant relationships between zonulin and clinical data were found in the 59 patients with IBS-D.
Effect of gluten withdrawal and coeliac disease genetic profile
The effect of diet on zonulin serum levels was evaluated in a subgroup of 44 patients with NCGS, with a comparison of zonulin serum levels before (during a GCD) and after 6 months of a self-monitored diet free of wheat, rye and barley (GFD). Zonulin serum levels during GCD was not different between the subgroup of patients undergoing gluten withdrawal and the other patients with NCGS (p=0.333).
Concerning HLA genotype, 30 of these patients were HLA-DQ2/8-negative, 10 were HLA-DQ2+, 2 HLA-DQA1*05, 1 was HLA-DQB1*02 and 1 was HLA-DQ2/DQ8-positive. The gluten withdrawal effect also was stratified according to HLA phenotype: HLA-DQ2/DQ8-negative and HLA-DQA1*05 patients were considered together and defined as HLA-DQ2/8-negative (n=32; 72.7%), while the other 12 patients constituted the HLA-DQ2/8-positive group (27.3%). Among the HLA-negative patients, 23 were Marsh 0 and 9 were Marsh 1, while among the HLA-positive patients, 5 were Marsh 0 and 7 were Marsh 1.
IgE titre and duodenal histopathology were not evaluated after GFD.
Effect of gluten withdrawal on zonulin levels
A slight decrease in zonulin serum levels was observed after 6 months of gluten withdrawal, although this difference did not reach statistical significance (from 31.7±37.0; 23.7 (13.4–38.1) to 26.7±41.4; 15.4 (5.8–31.9 pg/mg total protein; p=0.079).
Considering the stratification according to genotype, in HLA-DQ2/DQ8-negative patients, zonulin serum levels did not significantly (p=0.629) change after gluten withdrawal (from 33.5±42.5; 21.9 (13.0–39.3) to 31.8±47.0; 22.3 (6.6–43.0) pg/mg total protein). In contrast, in the group of HLA-DQ2-positive patients, zonulin significantly decreased from 26.9±14.9; 30.3 (14.7–37.6) to 13.1±13.6; 10.4 (4.6–15.7) pg/mg total protein (p=0.016; figure 3). The decrease of zonulin serum levels in HLA-DQ2/8-positive patients (−13.8±17.2; −13.3 (−27.0 to -0.6)) was significantly higher (p=0.025) than the decrease in the HLA-DQ2/8-negative ones (−1.7±16.8; 0.0 (−12.2 to 5.4)).
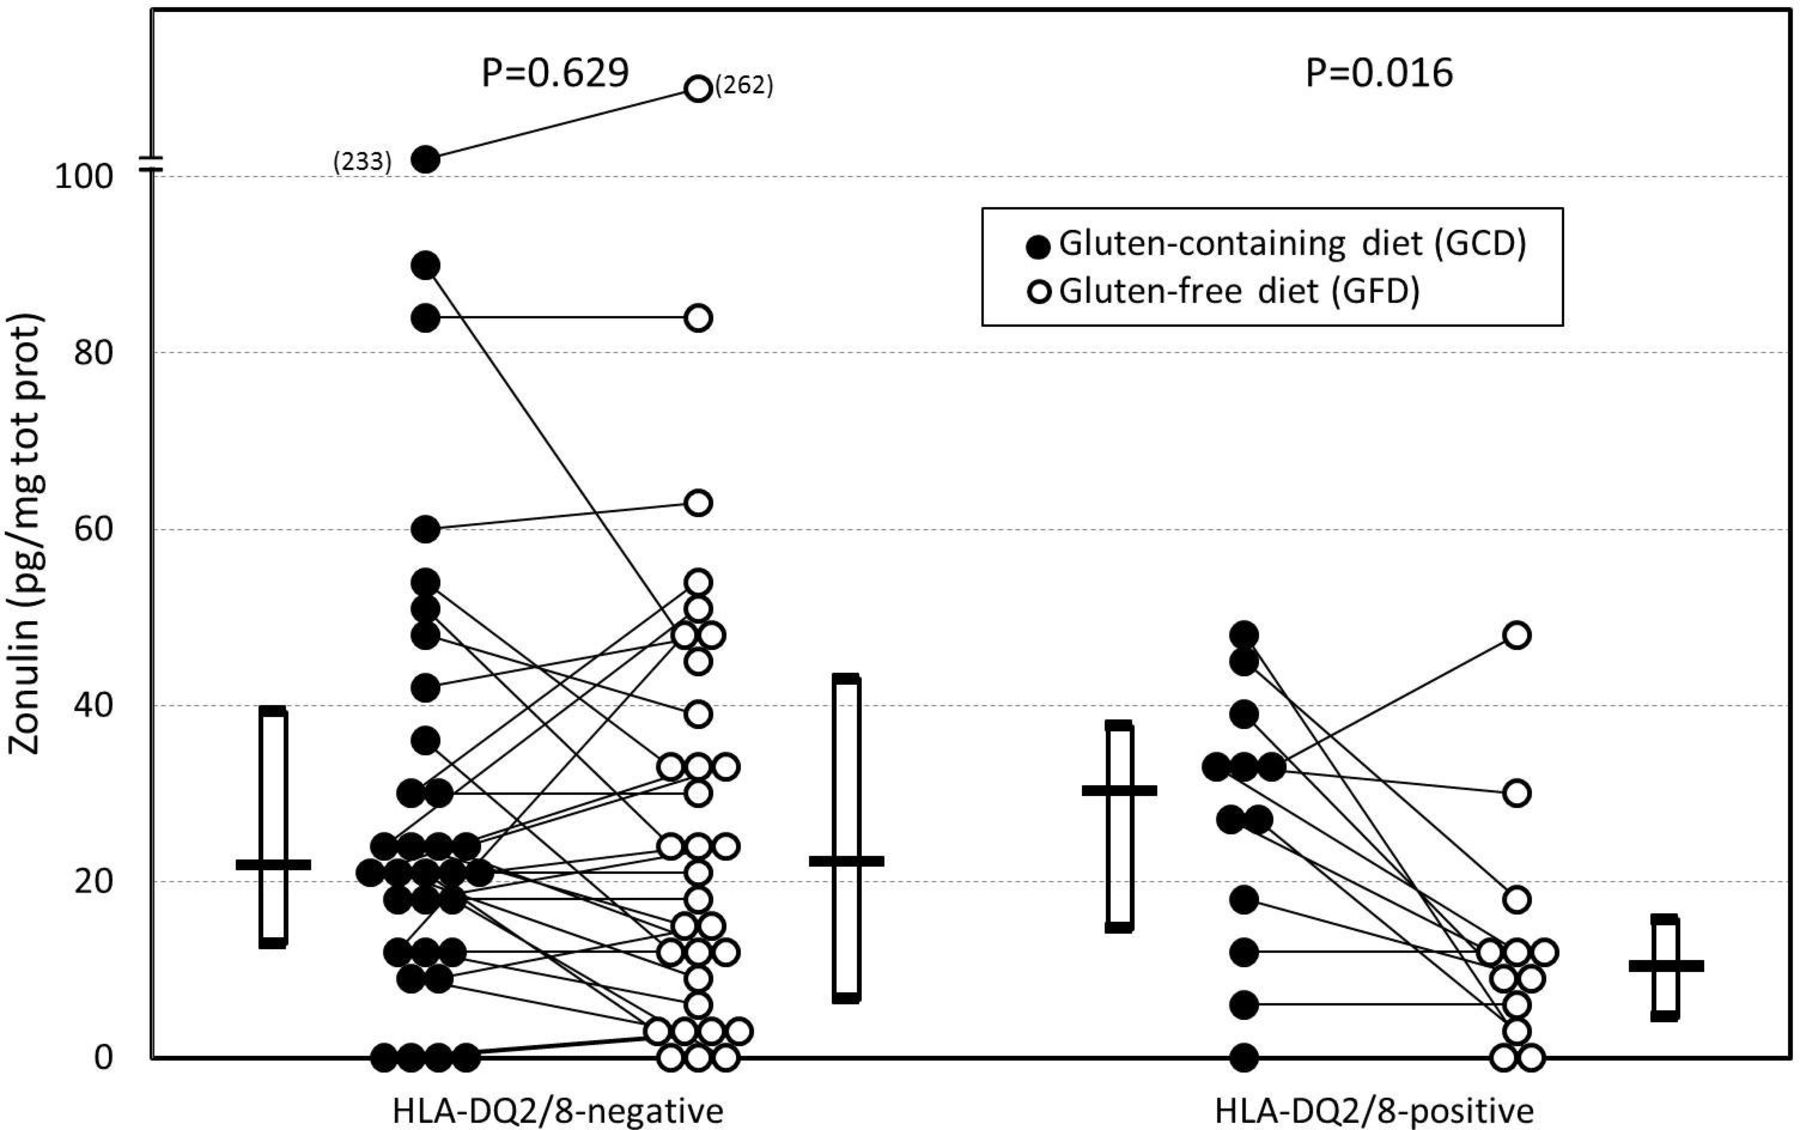
Effect of gluten-free diet on zonulin serum levels in 44 patients with NCGS during consumption of a gluten-containing diet and after 6 months of a gluten-free diet. Data stratified according to HLA-DQ2/8 genotype. Boxes show IQRs (ends) and median values (crossbars) (Wilcoxon matched-pairs test). HLA, human leucocyte antigen; NCGS, non-coeliac gluten sensitivity.
Effect of gluten withdrawal on clinical data
Gluten withdrawal was associated with a significant reduction in anti-tTG IgA and anti-DGP IgG antibody titres, IgA AGA, IgG AGA and all intestinal and extraintestinal symptoms, except weight loss and rhinitis (online supplementary table S3). Asthma was present neither before nor after 6 months of gluten withdrawal. A significant improvement in the quality of life was observed after gluten withdrawal (p<0.001).
Effect of gluten withdrawal and HLA-DQ2/8 genotype
Differences in laboratory and clinical data induced by gluten withdrawal in patients with NCGS stratified according to HLA-DQ2/8 genotype are reported in online supplementary table S4. In both HLA-DQ2/8-positive and HLA-DQ2/8-negative patients, gluten withdrawal provoked a significant reduction in anti-tTG IgA and anti-DGP IgG antibody titres and IgG AGA. In addition, the GFD was associated with a reduction in all intestinal symptoms, tiredness, headache, anxiety and joint/muscle pain. IgA AGA significantly decreased only in the HLA-DQ2/8-positive subgroup, while foggy mind and depression significantly decreased only in the HLA-DQ2/8-negative subgroup. Quality of life significantly increased in both subgroups of patients.
The decrease of AGA IgA after gluten withdrawal in HLA-DQ2/8-positive patients (1.6±2.4; 0.8 (0–2.3)) was significantly (p=0.036) higher compared with the decrease observed in HLA-DQ2/8-negative patients (0.9±3.5; 0 (0–0.9)).
Effect of gluten withdrawal on the relationship between zonulin and clinical data
Correlations between zonulin and clinical symptoms before and after gluten withdrawal are reported in online supplementary table S5. Using pooled data obtained before and after gluten withdrawal, we found that zonulin significantly correlated with all antibody titres and intestinal symptoms, as well as with tiredness and anxiety. We found similar results for the GFD with the exception of IgG AGA antibody titre and distension severity, which failed to reach the significance limit, while no significant correlation was found after gluten withdrawal.
Online supplementary table S6 shows the relationships between zonulin and clinical symptoms in patients with NCGS stratified according to HLA-DQ2/8 genotype based on pooled data obtained before and after gluten withdrawal. Zonulin serum levels significantly and positively correlated with anti-DGP and AGA IgA antibody titres, anxiety and numbness in HLA-DQ2/8-negative patients and with antibody titres, intestinal symptoms, tiredness, headache, anxiety and joint/muscle pain in HLA-DQ2/8-positive patients. The relationships observed in HLA-DQ2/8-positive patients are shown in online supplementary figure S3.
Diagnostic accuracy of zonulin in discriminating among the four study groups
Figure 4 shows the ROC curves of zonulin serum levels in discriminating between pairs of different diagnoses (AC, IBS-D, NCGS and CD). The highest level of accuracy for zonulin serum levels was found in discriminating CD versus AC (area under the curve (AUC)=0.981), with the best cut-off value ranging between 15.5 and 16.1 pg/mg total protein, and high sensitivity (93.3%, 14/15) and specificity (96.0%, 24/25). Zonulin serum levels showed similar accuracy levels in discriminating NCGS versus AC (AUC=0.865) and CD versus IBS (AUC=0.918), but the first comparison was characterised by higher specificity (88.0%, 22/25) at a cut-off range of 10.3–10.7 pg/mg total protein, while the second comparison showed higher sensitivity (93.3%, 14/15) and higher values for the cut-off range (13.5–16.1 pg/mg total protein). Zonulin serum levels showed good accuracy in discriminating patients with NCGS and IBS-D (AUC=0.809), with a cut-off range of 13.5–13.6 pg/mg total protein (70.9% sensitivity, 61/86; 83.1% specificity, 49/59). Zonulin levels were similar in NCGS and CD groups, as demonstrated by a non-significant accuracy (AUC=0.629; p=0.111). Zonulin cannot differentiate IBS-D from AC (AUC=0.506; cut-off: 10.3–10.4 pg/mg total protein; 32.2% sensitivity, 19/59; 88.0% specificity, 22/25).

Receiver operating characteristic curves of zonulin serum levels in discriminating between pairs of different diagnoses. The best cut-off value is marked with a closed circle. AC, asymptomatic controls; AUC, area under the curve; CD, coeliac disease; IBS-D, diarrhoea-predominant IBS; NCGS, non-coeliac gluten sensitivity.
Finally, the accuracy of zonulin in identifying gluten sensitivity (ie, by pooling patients with NCGS plus CD) and compared with participants without gluten sensitivity (AC plus IBS-D) was 84.2%, with a sensitivity of 72.3% (73/101) and a specificity of 86.9% (73/84) as evaluated by considering the best cut-off (15.46–15.47 pg/mg total protein) (figure 5).

Receiver operating characteristic curve of zonulin serum levels in discriminating between patients with gluten sensitivity (NCGS plus CD) and without gluten sensitivity (AC plus IBS-D). The best cut-off value is marked with a closed circle. AC, asymptomatic controls; AUC, area under the curve; CD, coeliac disease; IBS-D, diarrhoea-predominant IBS; NCGS, non-coeliac gluten sensitivity.
Development of a diagnostic algorithm for NCGS
Since IBS-D and NCGS share similar symptom patterns, we constructed a diagnostic algorithm (including relevant demographic, clinical and biological data) and evaluated the diagnostic performance of the algorithm to distinguish these two conditions. The algorithm flow chart detailing these steps is reported in figure 6.

Flow chart depicting the multiple steps of the diagnostic algorithm for gluten-related symptoms. GCD, gluten-containing diet; GFD, gluten-free diet; NCGS, non-coeliac gluten sensitivity; IBS-D, diarrhoea-predominant IBS; NvI, index for discriminating patients with NCGS vs patients with IBS-D.
First, CD was excluded at entry by assessing anti-tTG antibody titre, and then the diagnostic algorithm (online supplementary appendix and table S7) allowed us to calculate an index for discriminating patients with NCGS versus patients with IBS-D (NvI index) considering gender, zonulin serum levels as well as the severity of abdominal pain and distension, according to the following formula:

Thus, patients with NvI values <1 can be considered belonging to the IBS-D population, while patients with NvI values >1 can be considered belonging to the NCGS population.
The mean NvI index was 0.88±0.25 (range: 0.47–1.64; median: 0.84; IQR: 0.67–0.99) in the patients with IBS-D, while it was 1.50±1.11 in the patients with NCGS (range: 0.65–10.7; median: 1.29; IQR: 1.14–1.57). The diagnostic accuracy of the NvI index resulted to be 89.0% (AUC=0.890±0.033; p<0.001) with sensitivity and specificity values of 90.6% and 79.1%, respectively (figure 7). The probabilities associated with the NCGS or IBS-D diagnoses were (online supplementary appendix):

Receiver operating characteristic curve of the diagnostic accuracy of the NvI index. The diagnostic accuracy of the NvI index resulted to be 89.0% (AUC=0.890±0.033; p<0.001) with sensitivity and specificity values of 90.6% and 79.1%, respectively. AUC, area under the curve; IBS-D, diarrhoea-predominant IBS; NvI, index for discriminating patients with NCGS vs patients with IBS-D.


The NvI index was significantly different among the three different types of NCGS diagnoses (p=0.036), although no significant values were found in the pairwise comparisons: self-reported NCGS (1.73±1.58) versus confirmed (1.27±0.27; p=0.133) and not-confirmed NCGS (1.39±0.70; p=0.067), as well as confirmed versus not-confirmed NCGS (p=1.000). Compared with IBS (0.88±0.25), significantly higher NvI index values were found in confirmed (p<0.001), not-confirmed (p<0.001) and self-reported patients with NCGS (p<0.001).
Discussion
In the present study, we have shown that zonulin serum levels were increased in patients with confirmed as well as self-reported NCGS over AC and patients with IBS-D. In patients with NCGS, zonulin was associated with female sex, hypersensitivity and frequency of abdominal pain and distension. Zonulin was reduced with the elimination of wheat from the diets of participants with a genetic predisposition to CD. Zonulin serum levels could help in distinguishing NCGS from controls and IBS-D with good accuracy. To provide a reliable and clinically useful mean of distinguishing NCGS from other conditions characterised by similar symptom patterns, we developed a diagnostic algorithm based on zonulin serum levels, gender and those abdominal symptoms that were differentially expressed in patients with NCGS versus patients with IBS. This provided a high performing diagnostic tool with an accuracy of 89.0%. Taken together, our data suggest that zonulin could be considered a useful biomarker for NCGS.
Subgroups of patients with NCGS have a dysfunctional epithelial barrier in association with immune activation.26 Our results showing increased zonulin levels are in line with this concept. Our data are consistent with the fact that zonulin is increased irrespective of whether the NCGS was self-reported or confirmed with a double-blind placebo-controlled gluten challenge. At this stage, we cannot exclude that factors other than gluten contributed to the modulation of zonulin levels. These factors may include dietary elements contained in wheat such as lipopolysaccharides, amylase/trypsin inhibitors, wheat germ agglutinins and fermentable oligosaccharides, disaccharides and monosaccharides and polyols (FODMAPs).27–30
A recent study by Singh et al 31 evaluated the levels of serum zonulin in IBS, CD and healthy controls, reporting that there were no difference between IBS and CD. The difference between these results and ours could be related to differences in study population. In fact, due to the retrospective nature of the study by Singh et al, there were no data about gluten sensitivity in the patients enrolled. In addition, it cannot be excluded that patients with IBS, or a subgroup of them, had NCGS, explaining why zonulin levels were similar between the two groups, as we reported in the present study.
Our data indicating that zonulin levels were correlated with abdominal pain, distension and anxiety also are in line with growing evidence indicating that increased intestinal permeability is involved in the pathogenesis of abdominal pain32–35 and psychological dysfunction.1 We also detected a correlation of zonulin and IgE serum levels. This association occurred in the absence of wheat allergy, suggesting that NCGS may be linked to non-wheat-specific allergic reactions, as suggested in previous studies.3 36 The mechanisms underlying abdominal pain and systemic and allergic reactions seen in our patients with NCGS may involve an excessive passage of dietary and microbial antigens from the intestinal lumen to the mucosa with overstimulation of the immune system, sensory afferents and the central nervous system.37–40
In participants with NCGS, 6 months of wheat avoidance reduced zonulin in those genetically predisposed to CD (ie, HLA-DQ2/8 positive), suggesting that a genetic predisposition is needed to activate zonulin pathway. Furthermore, zonulin was associated with abdominal pain/distension and extraintestinal symptoms only in HLA-DQ2/8-positive patients. In accordance with previous studies,9 our findings support the importance of genetic susceptibility in NCGS.
There have been earlier attempts to identify biomarkers for NCGS. In two studies, 25% and 56% of participants with self-reported NCGS tested positive for IgG AGA (>50 arbitrary units); however, the prevalence of these antibodies in healthy controls was not assessed.3 41 Other proposed biomarkers include bacterial products (ie, soluble CD14, lipopolysaccharide-binding protein), bacterial-directed antibodies (ie, flagellin), markers of epithelial integrity (ie, fatty acid-binding protein 2)26 and epithelial barrier dysfunction.5 Recently, Carroccio et al demonstrated that patients with NCGS had increased numbers of intraepithelial lymphocytes and eosinophils in the duodenal and rectal mucosa compared with patients without NCGS.42 However, none of these studies assessed the diagnostic performance of the proposed biomarkers.
Here, we have shown a good overall diagnostic accuracy of serum zonulin for NCGS. Zonulin helped to distinguish NCGS from healthy controls. However, distinguishing NCGS from IBS-D is of greater value in clinical practice, where the clinician is confronted with the dilemma of placing a patient on a GFD or not. Our results demonstrate a good diagnostic performance of zonulin serum levels in distinguishing NCGS from IBS-D. It is important to highlight that patients with NCGS involved in this study are well-characterised patients, all seen in dedicated outpatient clinics. Thus, the generalisability of the present findings needs caution and requires further confirmation, particularly in the general population. In addition, a longitudinal study is required as at this time it is unknown if NCGS is a revertible condition. This study has some limitations. First, we cannot exclude that other dietary factors, such as FODMAPs, may be involved in symptoms in patients with NCGS; second, the lack of application of Rome criteria to the patients with NCGS should be taken into account in future studies; finally, the female:male ratio of IBS-D in this study is unusual and it was due to the fact that we matched gender with that of AC. Performing the logistic regression, however, gender resulted to be a key variable to generate the algorithm.
The algorithm developed in the present study improved the diagnostic accuracy of zonulin alone, provided a simple method to distinguish gluten (NCGS) from non-gluten (IBS)-related conditions with a rank of a per cent of probability. Simplicity and non-invasiveness of this test suggest that zonulin and the related algorithm could be a clinically valid diagnostic biomarker in NCGS.43
References
Supplementary materials
Supplementary Data
This web only file has been produced by the BMJ Publishing Group from an electronic file supplied by the author(s) and has not been edited for content.
Footnotes
Contributors GB, MRB, CC and AMM-L contributed to the study idea and design. MRB, CC, ADS, PG, GRC, MDS, GC, GL, CC, DF, LB, UV and GB contributed to data acquisition. MRB, CC, AMML, ADS, GRC, GL, CC, VS, UV and GB contributed to data interpretation. MRB, CC, AMM-L and GB wrote the first draft and all authors reviewed the manuscript for important intellectual content. AMM-L and MM contributed to the statistical analysis. MRB, ADS, PG, GRC, MDS, GC, GL, CC, DF, LB and UV provided technical or material support. GB supervised the study.
Funding The study was supported by the Italian Ministry of Education, University and Research, the University of Bologna and Fondazione del Monte di Bologna e Ravenna.
Competing interests None declared.
Patient consent for publication Not required.
Ethics approval The protocol was first approved by the coordinating centre of Bologna (Independent Ethics Committee of St. Orsola-Malpighi Hospital; approval identification no: 91/2012/U/Tess), and then by all the other participating centres, and conducted in accordance with the Declaration of Helsinki and the principles of Good Clinical Practice. Each participant in the study gave written informed consent.
Provenance and peer review Not commissioned; externally peer reviewed.
Data availability statement All data relevant to the study are included in the article or uploaded as supplementary information.