Article Text

Abstract
Background and aims: The mechanism of transformation to intestinal metaplasia in Barrett’s oesophagus has not been clarified. We investigated the effects of various bile acids on expression of the caudal related homeobox gene Cdx2 in cultured oesophageal squamous epithelial cells. In addition, morphological and histochemical changes in squamous cells to intestinal epithelial cells were studied in response to bile acid induced expression of Cdx2.
Methods: A rat model of Barrett’s oesophagus was created by anastomosing the oesophagus and jejunum, and Cdx2 expression was investigated by immunohistochemistry. Also, the response of various bile acids on Cdx2 gene expression was studied in the human colon epithelial cell lines Caco-2 and HT-29, as well as in cultured rat oesophageal squamous epithelial cells using a Cdx2 promoter luciferase assay. In addition, primary cultured oesophageal squamous epithelial cells were transfected with Cdx2 expression vectors and their possible transformation to intestinal-type epithelial cells was investigated.
Results: Oesophagojejunal anastomoses formed intestinal goblet cell metaplasia in rat oesophagus specimens and metaplastic epithelia strongly expressed Cdx2. When the effects of 11 types of bile acids on Cdx2 gene expression were examined, only cholic acid (CA) and dehydrocholic acid dose dependently increased Cdx2 promoter activity and Cdx2 protein production in Caco-2 and HT-29 cells, and cultured rat oesophageal keratinocytes. Results from mutation analysis of Cdx2 promoter suggested that two nuclear factor κB (NFκB) binding sites were responsible for the bile acid induced activation of the Cdx2 promoter. When bile acids were measured in oesophageal refluxate of rats with experimental Barrett’s oesophagus, the concentration of CA was found to be consistent with the experimental dose that augmented Cdx2 expression in vitro. Furthermore, transfection of the Cdx2 expression vector in cultured rat oesophageal keratinocytes induced production of intestinal-type mucin, MUC2, in cells that expressed Cdx2.
Conclusions: We found that CA activates Cdx2 promoter via NFκB and stimulates production of Cdx2 protein in oesophageal keratinocytes with production of intestinal-type mucin. This may be one of the mechanisms of metaplasia in Barrett’s oesophagus.
- GORD, gastro-oesophageal reflux disease
- TCA, taurocholic acid
- TDCA, taurodeoxycholic acid
- TCDCA, taurochenodeoxycholic acid
- GCA, glycocholic acid
- GCDCA, glycochenodeoxycholic acid
- DHCA, dehydrocholic acid
- CA, cholic acid
- LCA, lithocholic acid
- GCANa, glycocholic acid, sodium salt
- DCA, deoxycholic acid
- CDCA, chenodeoxycholic acid
- EMSA, electrophoretic mobility shift assay
- kb, kilobase
- CK, cytokeratin
- RT-PCR, reverse transcription-polymerase chain reaction
- NFκB, nuclear factor κB
- Cdx2
- bile acid
- cholic acid
- dehydrocholic acid
- Barrett’s oesophagus
Statistics from Altmetric.com
- GORD, gastro-oesophageal reflux disease
- TCA, taurocholic acid
- TDCA, taurodeoxycholic acid
- TCDCA, taurochenodeoxycholic acid
- GCA, glycocholic acid
- GCDCA, glycochenodeoxycholic acid
- DHCA, dehydrocholic acid
- CA, cholic acid
- LCA, lithocholic acid
- GCANa, glycocholic acid, sodium salt
- DCA, deoxycholic acid
- CDCA, chenodeoxycholic acid
- EMSA, electrophoretic mobility shift assay
- kb, kilobase
- CK, cytokeratin
- RT-PCR, reverse transcription-polymerase chain reaction
- NFκB, nuclear factor κB
Barrett’s oesophagus is an acquired condition in which the squamous epithelium at the distal oesophagus is replaced by metaplastic columnar epithelium1 that is considered to be induced by chronic gastro-oesophageal reflux disease (GORD).2 Interest in Barrett’s oesophagus stems mainly from its well established association with adenocarcinoma of the oesophagus, a cancer whose incidence has increased over the past decade.3 Although there is great interest in the pathogenesis of this condition, little is known regarding the mechanism of cellular metaplasia or precise cell origin of Barrett’s epithelium. Several clinical studies have emphasised the role of chronic duodenogastro-oesophageal reflux in the development of Barrett’s oesophagus.4–7 In patients with GORD, the concentration of bile acids in the oesophageal refluxate correlates with the degree of oesophageal mucosal injury.4–7 Furthermore, mixed reflux of gastric and duodenal contents is more common in patients with Barrett’s oesophagus than in those with uncomplicated GORD.6 In addition, experimental models created by an oesophagojejunal anastomosis have shown that chronic reflux of duodenal contents into the oesophagus induces severe oesophagitis, Barrett’s oesophagus, and finally oesophageal adenocarcinoma.8,9,10,11,12 Notably, Barrett’s epithelium in these models resembles the lesions described in human Barrett’s oesophagus in morphology and expression pattern of cancer related gene products, including p53, c-myc, and cyclooxygenase 2.12 These data suggest that reflux of duodenal contents with bile acids contributes to the development of Barrett’s oesophagus.
Cdx1 and Cdx2 are members of the caudal related homeobox gene family, based on their sequence homology to the caudal gene of Drosophila melanogaster.13,14 They are intestine specific transcription factors that are important in the early differentiation and maintenance of intestinal epithelial cells during gastrointestinal development.15 Cdx2 is reported to be a direct transcriptional activator of many intestine specific genes, including MUC2, sucrase-isomaltase, lactase-phlorizin hydrolase, glucagon, and guanylyl cyclase C.16–20 Forced expression of Cdx2 in IEC6 cells, an undifferentiated rat intestinal epithelial cell line that does not express Cdx proteins, has been shown to induce cellular differentiation characterised by multicellular structures containing a well formed columnar polarised layer of cells.21 When expressed in the stomach, Cdx2 can induce differentiation of gastric epithelial cells to intestinal-type cells, suggesting that it may play a fundamental role in generating intestinal metaplasia.22,23 In addition, Cdx2 protein has been reported in Barrett’s epithelium and oesophageal epithelium with oesophagitis.24,25
In the present study, we investigated the hypothesis that bile acids have stimulatory effects on Cdx2 expression by oesophageal keratinocytes. We also determined which bile acids are the main regulators of Cdx2 gene expression in primary cultured rat oesophageal keratinocytes. In addition, we investigated intestine specific gene expression in cultured oesophageal keratinocytes by overexpressing the Cdx2 gene.
MATERIALS AND METHODS
Rat models of Barrett’s oesophagus
Seven week old male Wistar rats were used for the experiments. To induce Barrett’s oesophagus, we used Levrat’s model with minor modifications.26 A midline laparotomy was performed, and the gastro-oesophageal junction was cut and the oesophageal end separated. The distal end of the oesophagus was then reimplanted 2 cm beyond the ligament of Treiz in an end to side fashion into a loop of jejunum and the proximal end of the stomach was ligated. Six months after formation of the oesophagojejunal anastomoses, rats were sacrificed, each oesophagus was removed, and oesophageal refluxate was collected. Concentrations of bile acids, except for dehydrocholic acid (DHCA), were measured by high performance liquid chromatography (HPLC) while the concentration of DHCA was determined using gas chromatography/mass spectrometry. The experimental study protocol was approved by the institutional animal care and experimental committee of Shimane University.
Cell lines and culture
Four cell lines, CV-1, monkey kidney cell line (a common transfection host), TT (a human oesophageal squamous carcinoma), HT-29 (a human colon carcinoma), and Caco-2 (a colon carcinoma), were used in this study. For the investigation of bile acid induced Cdx2 promoter activation, three cell lines, CV-1, TT, and HT-29, were used to investigate the possible organ specific effects of bile acids. For analysis of the direct effects of bile acids on Cdx2 expression, Caco-2 and HT-29 were used as these cell lines are well known for their endogenous Cdx2 expression.27
Vector construction for reporter gene assays
For construction of reporter vector of the Cdx2 promoter, accession No U00454 was used. Position +1 refers to the major transcription start site identified in the Cdx2 gene28,29; 1014 bp of the Cdx2 promoter (−888 to +125) were amplified by polymerase chain reaction (PCR) and cloned into the KpnI and BglII sites of a pGL3-basic luciferase vector (Promega, Madison, Wisconsin, USA) to generate pCdx2/1014-Luc.
Promoters of various lengths from pCdx2/1014-Luc were amplified by PCR and subcloned into the KpnI and BglII sites of pGL3-basic, which generated pCdx2/425-Luc (−299 to +125), pCdx2/307-Luc (−181 to +125), pCdx2/198-Luc (−72 to +125), and pCdx2/74-Luc (+52 to +125). The cloned promoter sequences were confirmed by sequencing.
Functional defects of two putative nuclear factor κB (NFκB) binding sites of pCdx2/1014-Luc (1: −103 to −82; 2: −22 to −1) (pM1-Luc, pM2-Luc, pM1+2-Luc) were induced by inserting mutations using a Quick Change Site Directed Mutagenesis Kit (Stratagene, La Jolla, California, USA). To produce mutated Cdx2 promoter constructs, for pM1-Luc and pM2-Luc, 5′-gcg agc caa cct gcg gcg atc caa caa cgc ctc tac agc tta ctg g-3′, and 5′-gag gca gga cgg agg gag ata cag caa ggg agg cag aag ctc tgc-3′ were used, respectively (nucleotide substitutions indicated in bold). To produce mutant pM1+2-Luc, both of the mutated oligonucleotides were employed to replace the wild sequences of the promoter. The correct mutations of the promoter sequences were confirmed by sequencing. As an internal control for the dual luciferase assay, pRL-TATA-Renilla-Luc was also constructed which expressed Renilla luciferase under a minimal TATA promoter.30
Luciferase assay
The effects of bile acids on transcriptional activation of Cdx2 were evaluated. CV-1, TT, and HT-29 were cultured in 24 well plates (5×10⁴ cells/well) and transfected with 0.5 μg of the individual promoter Cdx2-Luc and 0.02 μg of pRL-TATA-Renilla-Luc in each well, with LipifectAMINE Plus (Invitrogen Corp., Carlsbad, California, USA). Eleven types of bile acids, including taurocholic acid (TCA), taurodeoxycholic acid (TDCA), taurochenodeoxycholic acid (TCDCA), glycocholic acid (GCA), glycochenodeoxycholic acid (GCDCA), DHCA, cholic acid (CA), lithocholic acid (LCA), glycocholic acid, sodium salt (GCANa), deoxycholic acid (DCA), and chenodeoxycholic acid (CDCA), were used as stimulants. All bile acids were purchased from Sigma Chemical Co. (St Louis, Missouri, USA). Twelve hours after transfection of the luciferase vectors, cells were stimulated with various concentrations of the bile acids or vehicle (0.1% ethanol) alone for 12 hours and cell lysates were used for measurement of luciferase activity using a PicaGene Dual luciferase kit (Toyoinki Co. Ltd, Tokyo, Japan), as described previously.30 Data are expressed as n-fold increase in luciferase activity of the bile acid stimulated samples over that of the vehicle stimulated samples.
Electrophoretic mobility shift assay (EMSA)
Nuclear protein extraction and EMSA were performed according to a previously described procedure.31 An NFκB consensus double stranded oligonucleotide probe (Promega) was labelled with [γ-32P]ATP using T4 polynucleotide kinase. Competition experiments were performed by addition of a 100-fold molar excess of the unlabelled oligonucleotide.
Direct effects of bile acids on Cdx2 gene expression
To examine the direct effect of DHCA on Cdx2 expression, Caco-2 and HT-29 cells were used. After a 24 hour incubation with DHCA, proteins were isolated from Caco-2 and HT-29 cells for measurement of Cdx2 expression by western blot analysis.
Primary culture of rat oesophageal keratinocytes
Primary cultures of oesophageal keratinocytes from normal rat oesophagi were established. Oesophageal epithelium samples were obtained from seven week old male Wistar rats, after being dissected away from the muscular and submucosal layers of the rat oesophagus and cut into 1–2 mm pieces. After trypsinisation, cells were plated on collagen type I coated plastic tissue culture dishes in 0.03 mM of calcium keratinocyte growth medium, supplemented with 10% fetal bovine serum, 5 μg/ml insulin, 1×10⁻⁹ M triiodothyronine, 25 μg/ml bovine pituitary extract, 10 ng/ml epidermal growth factor, 1.8×10⁻⁴ M adenine, 50 μg/ml hydrocortisone, and antibiotics. Cells were used for the experiments after the second passage.
After a 12 hour incubation with DHCA, total RNA was isolated from cultured keratinocytes for measurement of Cdx2 gene expression by northern blot analysis. After a 24 hour incubation with DHCA or CA, protein was extracted from primary cultured keratinocytes for measurement of Cdx2 expression by western blot analysis. After a 24 hour incubation with DHCA or CA, cellular localisation of Cdx2 was investigated by Cdx2 immunofluorescence cytochemistry.
Northern blot analysis
Total RNA extraction and northern blot analysis were performed as described previously.32,33 The probes used for northern blot analysis were 0.33 kilobase (kb) cDNA of rat Cdx2 (632-964, NCBI database; AJ278466) and 0.76 kb cDNA of rat β-actin.32,33
Protein extraction and western blot analysis
Protein extraction and western blot analysis were performed as described previously.32,33 Membranes were incubated with anti-Cdx2 antibody (1:50; BioGenex, San Ramon, California, USA) or anti-β-actin antibody (1:3000; Sigma) and then incubated with horseradish-peroxidase conjugated antirabbit immunoglobulin (Dako Corp., Carpinteria, California, USA).
Immunohistochemistry
Each specimen (5 μm thick sections) was stained with haematoxylin-eosin for light microscopic examination. To identify Cdx2 expressing cells, tissue sections were incubated with anti-Cdx2 antibody, which was followed by incubation with secondary biotinylated antimouse immunoglobulin (Dako). Bound antibody was detected using the avidin-biotin peroxidase method (ABC Elite Kit; Vector Laboratories, Burlingame, California, USA). Sections were counterstained with haematoxylin.
Immunofluorescence cytochemistry
Primary oesophageal keratinocytes were grown on chambered glass slides (BD Biosciences, Tokyo, Japan), fixed in 4% paraformaldehyde, and then permeabilised with 0.2% Triton X-100. Cells were labelled with anti-pan-cytokeratin (CK) (1:500; Sigma), anti-CK 4 (1:10; Progen Biotechnik GmbH, Heidelberg, Germany), anti-CK 14 (1:100; Chemicon International Inc., Temecula, California, USA), anti-Cdx2 (1:50), and anti-MUC2 (1:100; Santa Cruz Biotechnology Inc., Santa Cruz, California, USA) antibodies. Binding of the primary antibodies was detected by FITC conjugated antimouse, antirabbit, or antigoat immunoglobulin (Dako), or by rhodamine conjugated antimouse immunoglobulin (Dako).
Expression plasmid and transient transfection
cDNAs encoding full length murine Cdx2 were amplified by PCR using the primers 5′-agc ttt cag act ccg gag cct cag c-3′ and 5′-gtt gga ccc agc tgg gca aga aat g-3′ (NCBI database U00454). Amplified DNA samples were cloned into pcDNA5/FRT/V5-His-TOPO vector (Invitrogen) and plasmid clones were sequenced to confirm the constructs. Primary cultured rat oesophageal keratinocytes were transfected with this expression vector, using FuGENE 6 Transfection Reagent (Roche Diagnostics GmbH, Mannheim, Germany). Vector DNA without Cdx2 sequences was used as a negative control.
Reverse transcription-polymerase chain reaction (RT-PCR)
After DNase I treatment, RT-PCR was performed as described previously.34 PCR was performed in duplicate experiments and the correct amplification was confirmed by sequencing the amplified DNA. To standardise the amount and quality of the total RNA, the same samples were analysed for MUC2 and β-actin. Sense and antisense primers used were 5′-gtg gct gtg tgc cta gtc ct-3′ and 5′-gag ctg tag tgt ggg gyg ct-3′ (NCBI database RNU68172) for MUC2 (319 bp), and 5′-cac ggc att gta acc aac tg-3′ and 5′-acc ctc ata gat ggg cac ag-3′ (NCBI database V01217) for β-actin (288 bp). RNA extracted from rat ileum specimens was used as a positive control and RNA from keratinocyte samples not subjected to RT was used as a negative control.
Statistical analysis
All data are expressed as mean (SEM). Multiple comparisons were done with ANOVA followed by a Dunnet test. A p value of less than 0.05 was considered statistically significant.
RESULTS
Immunohistochemistry of rat Barrett’s oesophagus
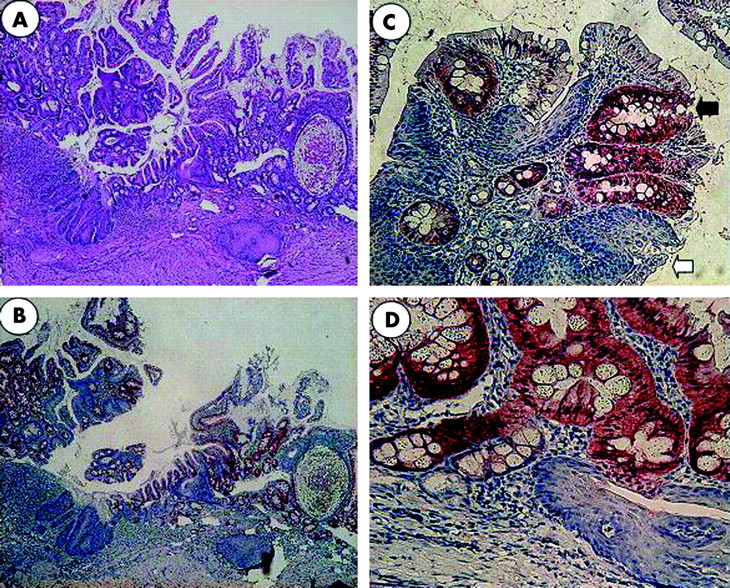
Six months after the oesophagojejunal anastomoses were formed, oesophagi in all rats were dilated and markedly thickened. Rats showed severe oesophagitis, with erosions and superficial ulcers located mainly in the lower oesophagus, which was histologically characterised by basal cell hyperplasia and extension of papillae, with ulceration and hyperkeratinisation. Columnar lined epithelium above the oesophagojejunostomy was observed in 30% of rats. Areas of intermingled columnar and squamous epithelia with goblet cell formation were observed adjacent to the anastomosis sites. In some rats, islands of columnar epithelium surrounded by squamous epithelium were found in the oesophageal mucosa distant from the anastomosis and close to the sites of reflux oesophagitis. Immunohistochemistry findings revealed Cdx2 positive cells with nuclear staining in the columnar epithelium above the oesophagojejunostomy. Cells with strong Cdx2 nuclear staining were found in the boundary between the typical columnar epithelium and the adjoining squamous epithelium in areas of intermingled columnar and squamous epithelia (fig 1).

Barrett’s oesophagus in experimental rats. (A) Areas of intermingled columnar and squamous epithelia. Goblet cells are seen adjacent to the site of anastomosis (haematoxylin-eosin stain). (B) Immunohistochemistry for Cdx2 in areas of intermingled columnar and squamous epithelia. Cdx2 positive cells are mainly observed in the columnar epithelium. (C) Immunohistochemistry for Cdx2 in areas of intermingled columnar (white arrow) and squamous (black arrow) epithelia. (D) Immunohistochemistry for Cdx2. Cdx2 positive cells are seen on the border of columnar epithelium and adjoining squamous epithelium in areas of intermingled columnar and squamous epithelia.
Bile acid concentrations in the refluxate of rat Barrett’s oesophagus
Bile acid concentrations in rat oesophageal refluxate samples were measured. Concentrations of TCA, TDCA, TCDCA, DCA, and CA were 37.4 (13.1) mM, 2.1 (0.9) mM, 171.7 (171.7) μM, 4.9 (3.6) μM, and 265.0 (180.2) μM, respectively (mean (SEM) of three rats). Several bile acids, including GCA, GCDCA, CDCA, LCA, and DHCA, were not detected.
Effects of bile acids on Cdx2 promoter activity
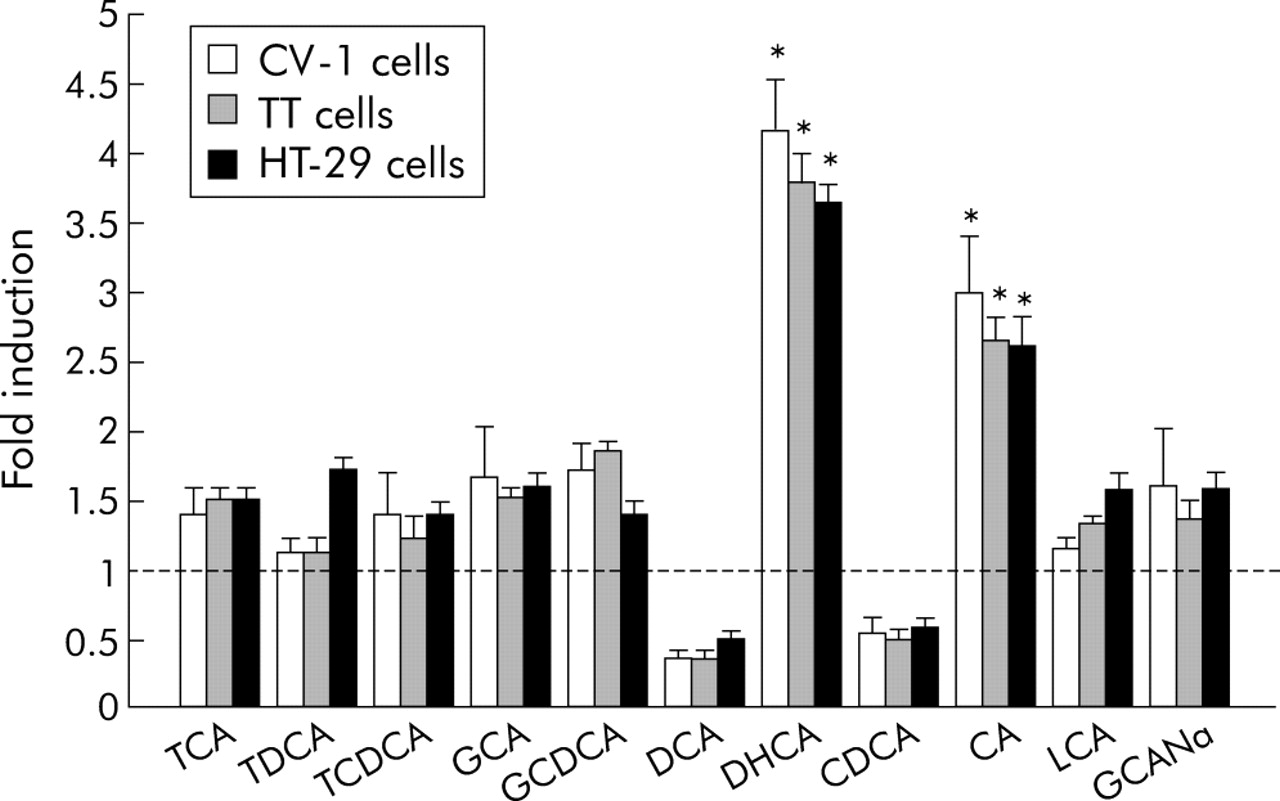
To investigate the possible effects of bile acids on Cdx2 gene expression, Cdx2 promoter (pCdx2/1014-Luc) activity following stimulation with bile acids was evaluated in CV-1, TT, and HT-29 cells using a reporter gene assay. Of the bile acids, DHCA showed the strongest stimulatory effect on Cdx2 promoter activity, with a fourfold increase in transcriptional activation. CA also significantly stimulated Cdx2 promoter activity, as shown by a threefold increase in transcription (fig 2). Cdx2 promoter activity decreased to <50% of control when cells were treated with DCA and CDCA at 50, 100, and 200 μM. Therefore, we also examined the effects of DCA and CDCA at lower concentrations (1, 10, and 20 μM), which did not show such suppressing effects on the Cdx2 promoter. The effects of bile acids on Cdx2 promoter activity in TT, HT-29 and, CV-1 cells were nearly identical. Transfection efficiency of CV-1 was much higher and reproducible. Therefore, CV-1 cells were used in the following experiments. DHCA and CA clearly activated the Cdx2 promoter in a dose dependent manner whereas the other bile acids had no such stimulatory effect (figs 3, 4).

Effects of bile acids on activation of the Cdx2 promoter were evaluated using CV-1, TT, and HT-29 cells. For stimulants, we used 100 μM taurocholic acid (TCA), taurodeoxycholic acid (TDCA), taurochenodeoxycholic acid (TCDCA), glycocholic acid (GCA), glycochenodeoxycholic acid (GCDCA), deoxycholic acid (DCA), dehydrocholic acid (DHCA), chenodeoxycholic acid (CDCA), cholic acid (CA), lithocholic acid (LCA), and glycocholic acid, sodium salt (GCANa). Cells were stimulated with various types of bile acids or vehicle alone for 12 hours and cell lysates were used for measurement of luciferase activity. Data are expressed as n-fold increase in luciferase activity in bile acid stimulated samples over that in vehicle treated samples. Results are expressed as the mean (SEM) of four experiments. *p<0.05 versus control.
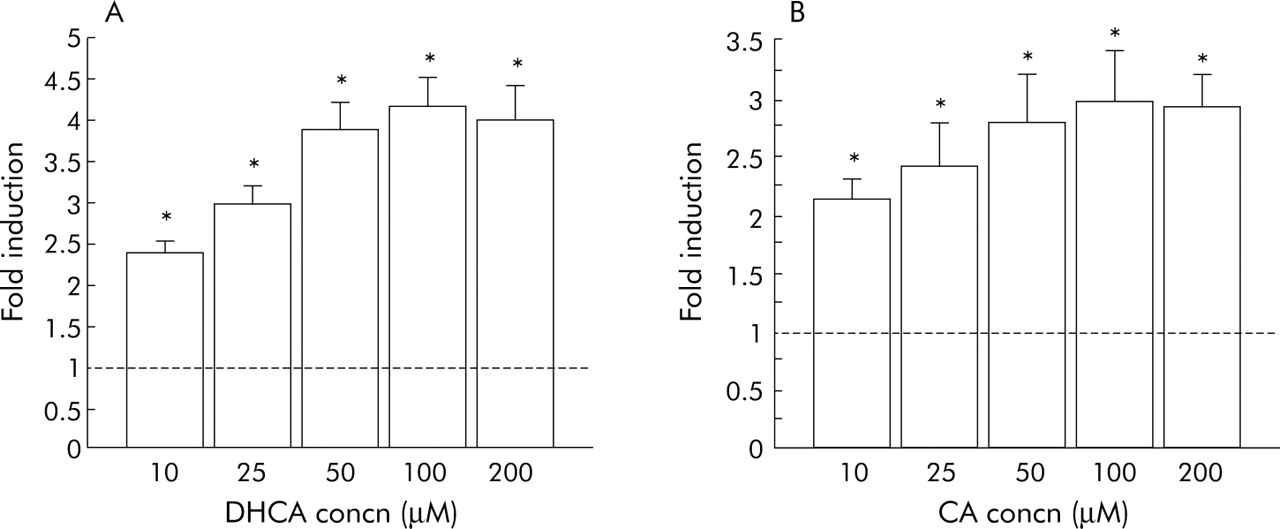
Effects of dehydrocholic acid (DHCA) (A) and cholic acid (CA) (B) on transcriptional activation of Cdx2 evaluated using CV-1 cells. Cells were stimulated with various concentrations of bile acids or vehicle alone for 12 hours and cell lysates were used for measurement of luciferase activity. Data are expressed as n-fold increase in luciferase activity in bile acid stimulated samples over that in vehicle treated samples. Results are expressed as the mean (SEM) of four experiments. *p<0.05 versus control.

Effects of various concentrations of bile acids (1–200 μM) on transcriptional activation of Cdx2, evaluated using CV-1 cells. Cells were stimulated with various concentrations of bile acids (taurocholic acid (TCA), taurodeoxycholic acid (TDCA), taurochenodeoxycholic acid (TCDCA), glycocholic acid (GCA), glycochenodeoxycholic acid (GCDCA), deoxycholic acid (DCA), chenodeoxycholic acid (CDCA), lithocholic acid (LCA), and glycocholic acid, sodium salt (GCANa)) or vehicle alone for 12 hours and cell lysates were used for measurement of luciferase activity. Data are expressed as n-fold increase in luciferase activity in bile acid stimulated samples over that in vehicle treated samples. Results are expressed as the mean (SEM) of four experiments.
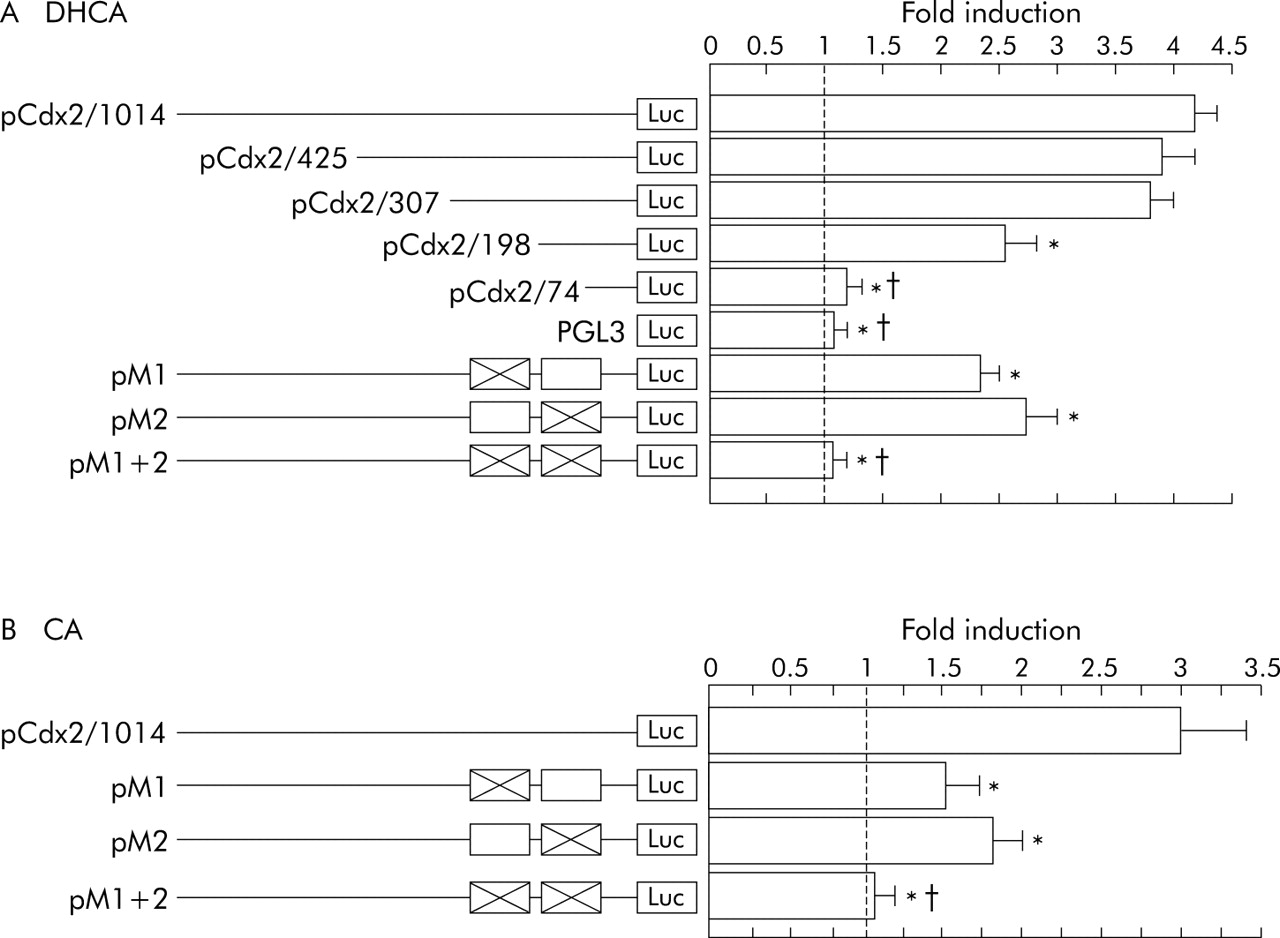
We constructed a series of reporter plasmids containing different lengths of the Cdx2 promoter. Transcriptional activity of these constructs was analysed with 100 μM DHCA in CV-1 cells. The plasmids, pCdx2/405-Luc and pCdx2/307-Luc with promoter sequences from −299 to +125 and from −181 to +125, respectively, exhibited a level of activation by DHCA similar to activation shown by the full length Cdx2-Luc reporter (pCdx2/1014-Luc). However, the plasmid, pCdx2/198-Luc, with a promoter sequence from −72 to +125, showed a lower level of activation than the full length pCdx2-Luc. The plasmid pCdx2/74-Luc, with sequences from +52 to +125, and PGL3-basic without the Cdx2 promoter, showed no activation responses to DHCA stimulation. These results revealed that DHCA induced activation of the Cdx2-promoter is controlled by sites located between −181 to −72 and −72 to +52 (fig 5A).

Reporter gene analysis of Cdx2 promoter deletion constructs and mutated constructs in CV-1 cells. (A) Cells were stimulated with dehydrocholic acid (DHCA) (100 μM) or vehicle alone for 12 hours and cell lysates were used for measurement of luciferase activity. (B) Cells were stimulated with cholic acid (CA) (100 μM) or vehicle alone for 12 hours and cell lysates were used for measurement of luciferase activity. Data are expressed as n-fold increase in luciferase activity in bile acid stimulated samples over that in vehicle treated samples. Results are expressed as mean (SEM) of four experiments. *p<0.05 versus pCdx2/640-Luc; †p<0.05 versus pCdx2/198/Luc, pM1, and pM2.
A previous report indicated the presence of two putative NFκB binding sites in the Cdx2 gene upstream sequence (1: −103 to −82; 2: −22 to −1).29 Therefore, to investigate the role of NFκB sites in DHCA induced stimulation of Cdx2 expression, each element of those putative NFκB binding sites were mutated individually. Mutation in either the first or second NFκB binding site partially ablated the stimulatory effects of DHCA, while mutation in both completely abolished DHCA induced activation of the Cdx2 promoter (fig 5A). These results indicated that DHCA induced Cdx2 transcriptional activation was regulated through both of these NFκB binding sites. Next, we examined whether CA induced Cdx2 transcriptional activation was also regulated through these two NFκB binding sites. Mutation of either the first or second NFκB binding site partially deleted the stimulatory effect of CA on activation of Cdx2 promoter while mutations in both completely abolished CA induced activation of the Cdx2 promoter (fig 5B). These results revealed that CA induced Cdx2 transcriptional activity is also regulated through the two NFκB binding sites in Cdx2 promoter sequence.
EMSA
To determine the effects of DHCA on the DNA binding activity of NFκB, EMSA was performed using Caco-2 and HT-29 cells. The binding activities of the nuclear extracts to NFκB sites were analysed using an oligonucleotide encoding the NFκB binding region. Caco-2 and HT-29 cells were incubated in medium containing 100 μM of DHCA for 12 hours, after which NFκB DNA binding activity was clearly stimulated, while the stimulated binding of nuclear extracts to NFκB sites was specifically inhibited by adding unlabelled NFκB probes to the reaction mixture (fig 6A).

(A) Electrophoretic mobility shift assay (EMSA) analysis using Caco-2 and HT-29 cells. Cells were incubated with 100 μM dehydrocholic acid (DHCA) or vehicle alone and nuclear extracts were subjected to EMSA. Binding activity of nuclear extracts to nuclear factor κB (NFκB) binding sites was analysed using the oligonucleotide encoding the NFκB binding region. Competition assays were performed with 100-fold excess of the unlabelled oligonucleotide. Data shown are representative of three separate experiments. (B) Effects of DHCA on Cdx2 protein production in colon cancer cells. After incubation with various concentrations of DHCA (50, 100, or 200 μM) for 24 hours, protein (30 μg) was extracted and subjected to western blot analysis. Blots are representative of four separate experiments. Densitometric analysis of Cdx2 protein over β-actin protein. Results are expressed as the mean (SEM) of four experiments. *p<0.05 versus control.
Direct effects of DHCA on Cdx2 expression in colon cancer cells
To determine whether DHCA augments Cdx2 protein expression, we investigated the direct effect of DHCA on Cdx2 expression using Caco-2 and HT-29 cells. We found that DHCA augmented Cdx2 protein expression in a dose dependent manner in both cell lines (fig 6B).
Establishment of rat primary keratinocytes
To determine whether DHCA and CA activate Cdx2 expression in oesophageal keratinocytes, we established a primary culture system of rat oesophageal keratinocytes (fig 7). Normal rat oesophageal keratinocytes attached to the plastic supports at 3–5 days after the start of cell culture. Confluence was reached from culture day 7–10 day, and confluent cells could be subcultured up to six passages and maintained continuously in culture for at least two months. Furthermore, cells were frozen and thawed several times in DMSO containing freezing medium, without impairing their plating or subculture efficiencies.

Establishment of primary culture of rat oesophageal keratinocytes. (A) Phase contrast microscopic view of primary cultured oesophageal keratinocytes at confluence. Immunofluorescence cytochemistry using: anti-pan-cytokeratin antibody (B); anti-cytokeratin 14 antibody (C); anti-cytokeratin 4 antibody (D); anti-β1-integrin antibody (E).
Expression of CK species varies during the process of differentiation by oesophageal keratinocytes.35 In basal and epibasal layers, cells are stained positive with CK 14, while only the epibasal cells can be stained by CK 4 in immunohistochemistry assays. In the present experiments, CK 14 was strongly and uniformly expressed in cultured rat oesophageal mucosal cells whereas CK 4 expression was found only in a small number of cultured cells (fig 7C, D). To investigate whether these cultured cells had stem cell populations among them, immunofluorescence cytochemistry for β1-integrin was performed. As shown in fig 7E, many of the smaller sized cells were positive for β1-integrin and had the characteristic of stem cells.
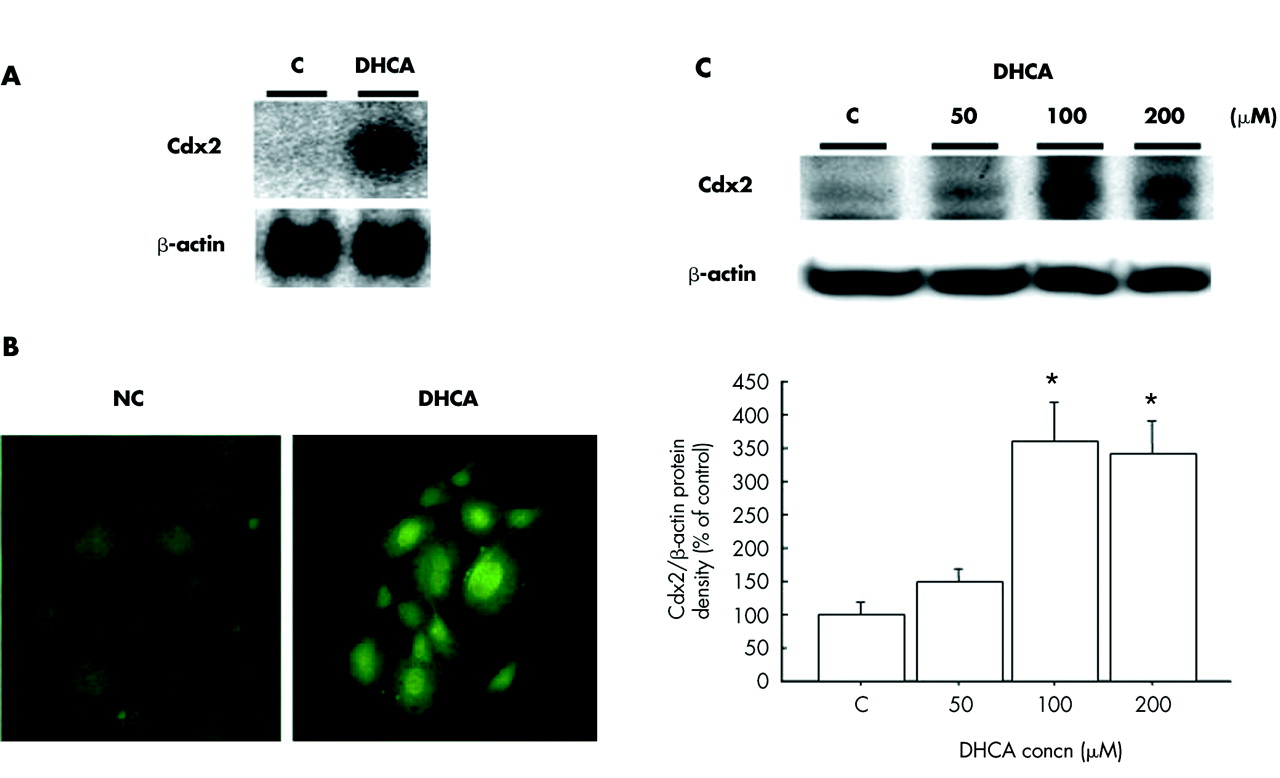
To determine whether DHCA activates Cdx2 expression in oesophageal keratinocytes, primary cultured oesophageal keratinocytes were incubated with DHCA. Cdx2 gene expression was augmented by addition of 100 μM of DHCA, as shown in fig 8A. When examined by western blot analysis, Cdx2 protein production was also augmented in a dose dependent manner by DHCA (fig 8C). In addition, immunofluorescence cytochemistry results clarified that DHCA augmented the nuclear staining of immunoreactive Cdx2 (fig 8B). When the effects of CA on expression of Cdx2 were investigated in these oesophageal keratinocytes, it was found to augment Cdx2 expression is the same manner as DHCA (fig 9).

Effects of dehydrocholic acid (DHCA) on Cdx2 expressions in primary cultured rat oesophageal keratinocytes. (A) Northern blot analysis. After incubation with 100 μM DHCA for 12 hours, total RNA (10 μg) was extracted and subjected to northern blot analysis with Cdx2 and β-actin cDNA probes. Blots are representative of four separate experiments. (B) Immunofluorescence cytochemistry for Cdx2. After incubation with 100 μM DHCA for 24 hours, the primary cultured cells were subjected to immunofluorescence cytochemistry for Cdx2. (C) Western blot analysis. After incubation with DHCA (50, 100, or 200 μM) for 24 hours, protein (30 μg) was extracted and subjected to western blot analysis for Cdx2 and β-actin. Blots are representative of four separate experiments. Results are expressed as the mean (SEM) of 4 experiments. *p<0.05 versus control.

Effects of cholic acid (CA) on Cdx2 expression in primary cultured rat oesophageal keratinocytes. (A) Immunofluorescence cytochemistry for Cdx2. After incubation with 100 μM CA for 24 hours, primary cultured cells were subjected to immunofluorescence cytochemistry for Cdx2. (B) Western blot analysis. After incubation with CA (50, 100, or 200 μM) for 24 hours, protein (30 μg) was extracted and subjected to western blot analysis for Cdx2 and β-actin. Blots are representative of four separate experiments. Results are expressed as the mean (SEM) of four experiments. *p<0.05 vs. control.
Effects of Cdx2 overexpression on oesophageal keratinocytes
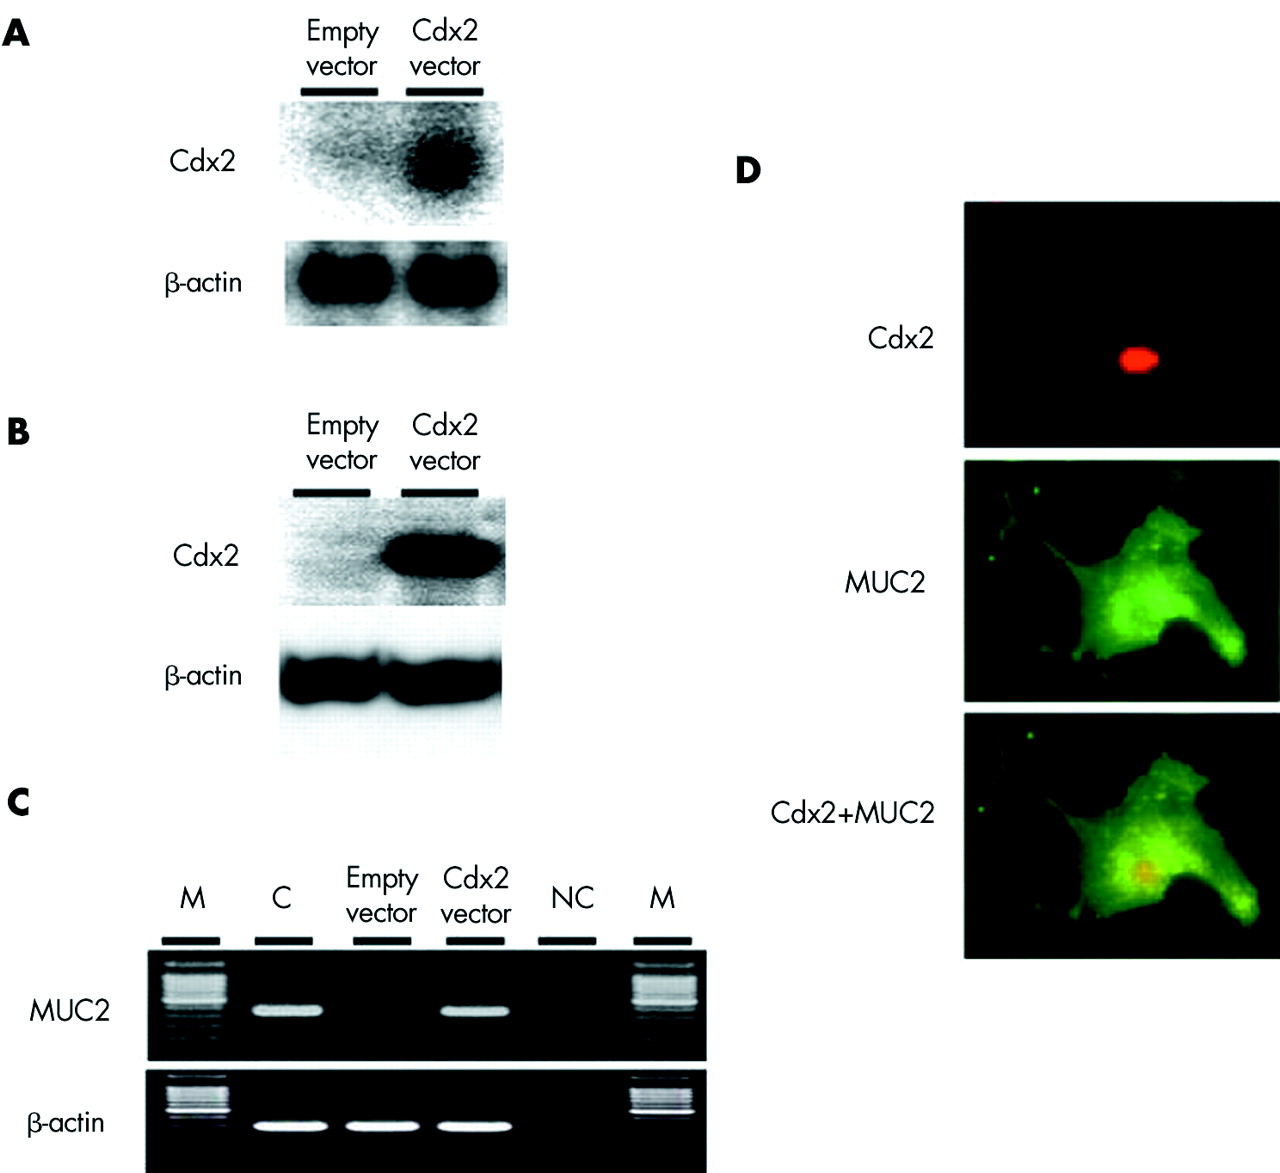
To investigate whether Cdx2 is the main regulator of intestinal metaplasia in oesophagi, we transfected a Cdx2 expression vector into primary cultured oesophageal keratinocytes and observed the expression of intestine specific MUC2 in the cells. Primary cultured oesophageal keratinocytes were transiently transfected with a Cdx2 expression construct and MUC2 expression was investigated 48 hours after the transfection. Oesophageal keratinocytes transfected with the Cdx2 construct expressed the MUC2 transcript whereas those transfected with the control vector did not show detectable expression of MUC2 (fig 10).

Effects of induced expression of Cdx2 on MUC2 expression in primary keratinocytes. Primary cultured rat oesophageal keratinocytes were transiently transfected with each Cdx2 expression vector or control vector without a Cdx2 sequence. Expression of the intestine specific gene MUC2 was investigated 48 hours after transfection in cultured keratinocytes. (A) Northern blot analysis of Cdx2 and β-actin. Transfection of the Cdx2 expression vector induced Cdx2 mRNA expression in cultured keratinocytes. (B) Western blot analysis of Cdx2 and β-actin. Transfection of the Cdx2 expression vector induced Cdx2 protein expression in cultured keratinocytes. (C) Reverse transcription-polymerase chain reaction (RT-PCR) analyses of MUC2 and β-actin expressions. Electrophoretic results are representative of four separate experiments. M, molecular size marker. NC, negative control (identical volumes of PCR reaction mixtures not subjected to RT). Transfection of the Cdx2 expression vector induced MUC2 mRNA expression in cultured keratinocytes. (D) Immunofluorescence cytochemistry for Cdx2 and MUC2. Cdx2 expression vector transfected cells expressed both Cdx2 and MUC2 proteins.
DISCUSSION
In our rat models of Barrett’s epithelium, areas of intermingled columnar and squamous epithelia were observed adjacent to sites of oesophagojejunal anastomosis. These areas appeared to be the transitional zones where squamous epithelium was replaced by columnar epithelium, and some of these zones were observed in glands in the same areas. Cdx2 positive cells with nuclear staining were mainly observed in columnar cells in these areas whereas they were infrequently found in squamous cells. These findings suggest the possibility that bile acids stimulate Cdx2 expression in oesophageal squamous epithelium, followed by replacement with intestinal-type columnar epithelium. Indeed, bile acids have also been reported to regulate cellular differentiation of haematopoietic cells via transcriptional factors.36 Furthermore, bile acids have been shown to enhance cellular transformation in vitro and are known to be promoters of gastrointestinal neoplasias in vivo.37–39 They have been found to upregulate c-myc expression in oesophageal adenocarcinoma cell lines and enhance the cellular proliferation of Barrett’s oesophagus in organ cultures.40 With Barrett’s oesophagus, the risk of oesophageal adenocarcinoma is significantly increased yet there is evidence that Cdx2 plays a tumour suppressor role, at least in the distal colon.21,27
Wide variations in biological activity have been reported for individual bile acid fractions and minor changes in bile acid structures dramatically alter their biological effects.41 Accordingly, we examined which bile acid fractions stimulated Cdx2 expression using promoter analysis. In the bile acids tested, DHCA showed the strongest activity of Cdx2 transcription in a dose dependent manner while CA also strongly augmented the transcription of Cdx2. Deletion of the Cdx2 promoter revealed that the bile acid induced augmentation of Cdx2 expression was mainly controlled by elements located between −181 to −72 and −72 to +52. A previous report that described induction of Cdx2 transcription by PTEN indicated that the Cdx2 gene upstream sequence contains two putative NFκB binding sites at positions −103 to −83 and −22 to −1.29 To clarify the possible role of these NFκB binding sites in bile acid induced changes of Cdx2 expression, we examined Cdx2 transcriptional activity using mutants from each of the NFκB binding sites. As shown in fig 5, Cdx2 promoter activity was partially inhibited by induction of a mutation into each NFκB binding site and was completely inhibited by inducing mutations in both binding sites. Supporting these results, EMSA revealed that DHCA stimulated the DNA binding activity of NFκB. DCA and CDCA have been reported to be potent activators of NFκB in several other promoters, including interleukin-8, RANTES, and cyclooxygenase-2.42–44 The discrepancy between those reports and our results might have been caused by specific suppressive effects of DCA and CDCA on the Cdx2 promoter, as that promoter has multiple transcriptional regulatory factor binding sites other than NFκB. We also speculate that DCA and CDCA treatment, particularly at higher doses, may activate some other transcriptional regulator(s)/suppressor(s), which might ultimately suppress Cdx2 promoter activity in spite of NFκB activation effects. Further studies are needed to clarify such promoter specific suppressive effects.
Cdx2 expression has been reported to be regulated by PTEN, tumour necrosis factor α, and butyrate in colon cancer cells, including Caco-2 and HT-29,28,29 and our results showed that DHCA stimulated Cdx2 expression in a dose dependent manner in both of those cell lines. Next, we examined whether DHCA stimulated Cdx2 expression in primary cultured oesophageal keratinocytes, which also showed results similar to those of colon cancer cell lines. Because of the difficulty in establishing an appropriate culture model of oesophageal keratinocytes, the effects of bile acids on oesophageal keratinocytes have not been fully tested. We first established a primary culture model of rat oesophageal keratinocytes and found that a major population of cultured cells expressed CK 14 and only a small percentage of cells had CK 4. This pattern of CK expression suggested that the primary cultured keratinocytes were mainly basal and epibasal cells. Although a definitive marker of oesophageal stem cells has not been identified, β1-integrin is considered a possible candidate.45 When we examined expression of β1-integrin in cultured keratinocytes by immunofluorescence cytochemistry, keratinocytes were found to include a large population of β1-integrin positive cells. From these observations, cultured oesophageal keratinocytes were considered to be undifferentiated immature oesophageal squamous epithelial cells with stem cells that could adhere and proliferate in vitro. From those results, we attempted to determine whether DHCA could stimulate Cdx2 expression in these immature oesophageal keratinocytes. Northern and western blot analyses showed that Cdx2 expression was remarkably augmented by treatment with DHCA. In addition, DHCA augmented nuclear staining of Cdx2, as detected by immunofluorescence cytochemistry. As CA also significantly increased Cdx2 promoter activity, we examined whether it stimulated Cdx2 expression in these cultured oesophageal keratinocytes. The results clearly indicate that CA, like DHCA, augmented Cdx2 protein expression, which was shown by western blot analysis and immunofluorescence cytochemistry. We also examined the effects of acidified bile acids (pH 4) on primary cultured cells. However, primary cultured cells may be sensitive to low pH levels and induction of Cdx2 expression could not be detected by western blotting assays (data not shown).
There has been considerable interest in the effects of free unconjugated bile acids as a major portion of conjugated bile acid is cleaved to unconjugated bile acids in the small intestine.46,47 In the present study, DHCA and CA, unconjugated bile acids, had stimulatory effects on Cdx2 expression in primary cultured cells. In patients with Barrett’s oesophagus, the most common bile acids found in the refluxant are TCA, GCA, and CA,6 but whether DHCA exists in the small intestine or oesophageal refluxate under physiological condition remains uncertain. DHCA is the major reaction product when CA is oxidised at positions C-3, C-7, and C-12.48 Furthermore, it has been reported that bacterial biotransformation of CA includes region specific oxidation at C-3, C-7, and C-12 with the formation of oxo bile acid.49 However, DHCA was not detected in the oesophageal refluxate from the experimental animals using the GS/MS method. The concentration of CA found in the oesophageal refluxate samples was similar to the concentration that augmented Cdx2 expression in vitro. Therefore, CA in refluxate may be the main stimulator of Cdx2 expression in oesophageal keratinocytes in patients with GORD. In addition, conversion of squamous epithelium to columnar epithelium may result from proliferation and abnormal differentiation of undifferentiated keratinocytes due to overexpression of Cdx2 induced by CA exposure. To confirm this, we examined whether induction of Cdx2 expression in immature oesophageal keratinocytes could trigger a similar transdifferentiation to intestinal-type columnar epithelial cells. Forced expression of Cdx2 in keratinocytes could induce transdifferentiation from undifferentiated oesophageal keratinocytes to goblet-like cells expressing MUC2.
In conclusion, Cdx2 is expressed in columnar epithelium and adjoining squamous epithelium in Barrett’s oesophagus. We also found that CA stimulated Cdx2 expression in immature oesophageal keratinocytes while overexpression of Cdx2 in immature oesophageal keratinocytes induced MUC2 expression. Therefore, CA stimulates Cdx2 expression in immature oesophageal keratinocytes which is followed by transformation to Barrett’s intestinal-type columnar epithelium.
Acknowledgments
Supported in part by grants in aid for Scientific Research from the Ministry Education, Science, Sports, and Culture of Japan.
REFERENCES
Footnotes
-
Conflict of interest: None declared.
Linked Articles
- Digest