Article Text

Abstract
Background: Epithelial barrier function is impaired in Crohn’s disease.
Aim: To define the underlying cellular mechanisms with special attention to tight junctions.
Methods: Biopsy specimens from the sigmoid colon of patients with mild to moderately active or inactive Crohn’s disease were studied in Ussing chambers, and barrier function was determined by impedance analysis and conductance scanning. Tight junction structure was analysed by freeze fracture electron microscopy, and tight junction proteins were investigated immunohistochemically by confocal laser scanning microscopy and quantified in immunoblots. Epithelial apoptosis was analysed in terminal deoxynucleotidyl transferase-mediated deoxyuridine triphosphate nick-end labelling and 4′,6-diamidino-2-phenylindole staining.
Results: Patients with active Crohn’s disease showed an impaired intestinal barrier function as indicated by a distinct reduction in epithelial resistance. As distribution of conductivity was even, focal epithelial lesions (eg, microerosions) did not contribute to barrier dysfunction. Instead, freeze fracture electron microscopy analysis showed reduced and discontinuous tight junction strands. Occludin and the sealing tight junction proteins claudin 5 and claudin 8 were downregulated and redistributed off the tight junction, whereas the pore-forming tight junctions protein claudin 2 was strongly upregulated, which constitute the molecular basis of tight junction changes. Other claudins were unchanged (claudins 1, 4 and 7) or not detectable in sigmoid colon (claudins 11, 12, 14, 15 and 16). Claudin 2 upregulation was less pronounced in active Crohn’s disease compared with active ulcerative colitis and was inducible by tumour necrosis factor α. As a second source of impaired barrier function, epithelial apoptosis was distinctly increased in active Crohn’s disease (mean (SD) 5.2 (0.5)% v 1.9 (0.2)% in control). By contrast, barrier function, tight junction proteins and apoptosis were unaffected in Crohn’s disease in remission.
Conclusion: Upregulation of pore-forming claudin 2 and downregulation and redistribution of sealing claudins 5 and 8 lead to altered tight junction structure and pronounced barrier dysfunction already in mild to moderately active Crohn’s disease.
- DAPI, 4′,6-diamidino-2-phenylindole
- IFN, interferon
- IL, interleukin
- H&E, haematoxylin and eosin
- IBD, inflammatory bowel disease
- IFN, interferon
- TNF, tumour necrosis factor
- TUNEL, terminal deoxynucleotidyl transferase-mediated deoxyuridine triphosphate nick-end labelling
Statistics from Altmetric.com
- DAPI, 4′,6-diamidino-2-phenylindole
- IFN, interferon
- IL, interleukin
- H&E, haematoxylin and eosin
- IBD, inflammatory bowel disease
- IFN, interferon
- TNF, tumour necrosis factor
- TUNEL, terminal deoxynucleotidyl transferase-mediated deoxyuridine triphosphate nick-end labelling
Crohn’s disease is a chronic inflammatory bowel disease (IBD) with diarrhoea as a leading symptom. Epithelial barrier dysfunction contributes to this by an increased loss of solutes leading to “leak-flux diarrhoea”.1,2
In healthy individuals, the intestinal barrier is constituted of an intact layer of epithelial cells, which are tightly connected by a surrounding system of tight junction strands.3 Several proteins form the molecular basis of tight junction strands.4–6 Although occludin and junctional adhesion molecule do not predominantly contribute to barrier function, this is accomplished by the protein family of claudins.7,8 Thereby, several of the 24 currently identified claudins interact in a tissue-specific manner to form a charge-selective and size-selective barrier.7
In IBD, epithelial barrier function is impaired.9–12 Early investigations by freeze fracture electron microscopy analysis showed a reduction of tight junction strands in ulcerative colitis and tight junction strand breaks in a non-quantitative analysis in Crohn’s disease as the possible causes of barrier dysfunction.9,11,12 As the altered morphology of tight junction strands is often the result of changes in tight junction protein expression,13 such a mechanism must also be assumed for Crohn’s disease. However, so far, only a few tight junction proteins have been analysed in Crohn’s disease. A recent study reported downregulation of occludin in Crohn’s disease, whereas claudin 1 expression was unchanged.14 However, as intestinal barrier function was not affected at all in occludin-deficient mice, this is assumed not to contribute to barrier dysfunction.15 Another study by Prasad et al16 recently showed a reduced expression of claudin 3 in Crohn’s disease, whereas expression of claudin 2 was increased.
Beyond tight junction changes, epithelial apoptosis can also contribute to barrier dysfunction.17,18 Thus, apoptotic epithelial cells were shown to cause focal epithelial lesions already in the early stages of ulcerative colitis, mainly contributing to the observed barrier dysfunction.10 In contrast with ulcerative colitis, the relevance of epithelial apoptosis in Crohn’s disease remains controversial, as epithelial apoptosis is assumed to be substantially lower than in ulcerative colitis.19–21
We investigated the mechanisms of barrier dysfunction in mild to moderately inflamed Crohn’s disease, and found a decreased expression and redistribution of the sealing claudins 5 and 8 as well as increased expression of the pore-forming claudin 2. Moreover, increased epithelial apoptosis contributed to barrier dysfunction in Crohn’s disease.
METHODS
Patients and tissue preparation
Human sigmoid colon was obtained from 23 patients (8 male and 15 female) with active Crohn’s disease. Patients had a median age of 44 years (range 21–65 years) and a Crohn’s disease history ranging from 1 to 22 years (median 12 years). A total of 11 patients had ileocolonic disease and 12 had isolated colonic disease. The median Crohn’s Disease Activity Index (according to Best et al22) was 200 (range 153–350). Eight patients received prednisolone (median dose 10 mg/day, range 7.5–30 mg/day), 15 patients 5-aminosalicylic acid (3 g/day) and one patient methotrexate (15 mg/week). Patients underwent colonoscopy, and biopsy samples were taken at 30 cm ab ano. With regard to subsequent characterisation of epithelial barrier function, we concentrated on mild to moderately inflamed Crohn’s colitis. Therefore, biopsy specimens were taken only from macroscopically affected sigmoid colon, showing erythema with loss of vascular pattern (grades 1 and 2 according to Gomes et al23), but not from patients with severe macroscopic damage such as friability, ulcers or spontaneous bleeding (grade 3). Subsequently, biopsy specimens were analysed microscopically and patients were excluded from investigation if specimens showed destructive crypt abscesses or active ulceration representing severe inflammation (grades 3 and 4). For control, biopsy specimens were taken from 22 control patients (12 male and 10 female; median age 61 years, range 37–77 years) undergoing colonoscopy for tumour exclusion who did not show inflammation either macroscopically or microscopically.
To investigate Crohn’s disease in remission, biopsies were additionally obtained from 15 patients (9 male, 6 female; median age 41 years (range 25–67 years)) who did not show macroscopic inflammation (grade 0 according to Gomes et al23; median Crohn’s Disease Activity Index 45 (range 20–93)). Three patients received 5-aminosalicylic acid (3 g/day), and one of them received additionally prednisolone (7.5 mg/day) as maintenance treatment.
For a direct comparison of active Crohn’s disease and ulcerative colitis, biopsy specimens of 15 patients with ulcerative colitis involving the sigmoid colon were analysed for epithelial apoptosis. Histological assessment of disease severity according to Truelove and Richards24 showed mild or moderate inflammation (grade 1–2) in 11 of 15 patients. Biopsy specimens from these 11 patients with ulcerative colitis (4 male, 7 female; median age 32 years (range 25–70 years)) were subsequently analysed for epithelial apoptosis and for a comparison of claudin 2 expression between ulcerative colitis and Crohn’s disease. Two patients with ulcerative colitis received prednisolone (5 and 30 mg/day), and another four received 5-aminosalicylic acid (3 g/day). The study design was approved by the local ethics committee.
Transmural impedance analysis
Transmural alternating current impedance analysis was carried out as described earlier.25,26 Briefly, biopsy specimens were mounted in an Ussing chamber (Fiebig, Berlin, Germany), and 48 discrete frequencies of an effective sine-wave alternating current of 35 μA/cm2 ranging from 1.3 Hz to 65 kHz were applied. The resulting changes in tissue voltage were detected by phase-sensitive amplifiers. Calculated complex impedance values were plotted in a Nyquist diagram and fitted by least-squares analysis. Total electrical wall resistance (Rt) was obtained at low and subepithelial electrical wall resistance (Rsub) at high frequencies by the formula Re = Rt−Rsub.
Conductance scanning
Measurements were carried out as described earlier.10,27 Briefly, biopsy specimens were mounted in a horizontal Ussing chamber, and alternating current (100 μA/cm2, 24 Hz) applied. Two potassium chloride-filled microelectrodes (vertical tip distance, Δx, 30–80 μm) were positioned 100 μm above the epithelium, and the potential difference, ΔV, between the tips was measured. Local conductivity (G) was calculated using the equation G = (ΔV/Δx)/(ρU), where ρ is the specific resistivity of the Ringer’s solution and U the transepithelial voltage measured by additional serosal and mucosal electrodes.27 The mucosal surface was scanned across an area of 600–600 μm2. After the measurement, tissues were fixed and investigated by haematoxylin and eosin (H&E) staining.
Freeze fracture electron microscopy
Freeze fracture electron microscopy analysis was carried out as described earlier.28 Prints of five surface and five crypt regions per patient were examined. Vertical grid lines were drawn perpendicular to the most apical strand, and intersections of strands and grid lines served to determine the number of horizontally oriented strands in the main tight junction meshwork (strand number). The distance between the most apical and contra-apical strand within the main compact meshwork was measured as the tight junction mesh depth. The distance between the most apical and contra-apical strand including aberrant strands was measured as the total tight junction depth. Strand breaks of ⩾25 nm within the main compact tight junction meshwork were expressed per 1 μm strand length.
Western blot analysis
Western blot analysis was carried out as described previously.20 Two to three biopsy specimens per patient were pooled and homogenised by douncing in lysate buffer containing 20 mM Tris, pH 7.4, 5 mM magnesium chloride, 1 mM EDTA, 0.3 mM ethyleneglycol tetra-acetic acid, 1 μl/ml aprotinin, 16 μg/ml benzamidine/hydrochloric acid, 10 μg/ml phenanthroline, 10 μg/ml leupeptin, 10 μg/ml pepstatin, 2 mM phenylmethylsulphonyl fluoride, 210 μg/ml sodium fluoride, 2.16 mg/ml β-glycerophosphate, 18.4 μg/ml sodium vanadate and 1 μl/ml trypsin inhibitor. Lysates were passed through a needle, and insoluble material was removed by centrifugation (350 g, 5 min, 4°C). The supernatant was centrifuged at 43 000 g for 30 min at 4°C, and pellets were resuspended in lysate buffer. Protein concentrations were determined by Pierce bicinchoninic acid assay. Aliquots of 5 μg were separated by polyacrylamide gel electrophoresis and transferred to a poly(vinylidene difluoride) membrane. Blots were blocked for 2 h in 5% milk powder in phosphate-buffered saline and overnight in 5% bovine serum albumin in phosphate-buffered saline (at 4°C) before incubation with primary antibodies for 90 min at room temperature. Primary rabbit polyclonal immunoglobulin (Ig)G antibodies were directed against occludin and claudins 1, 2, 3, 5, 7, 8, 11, 12, 14, 15 and 16. Primary mouse monoclonal IgG antibodies were directed against claudin 4 (Zymed, San Francisco, California, USA). Peroxidase-conjugated goat anti-rabbit IgG or goat anti-mouse IgG and the chemiluminescence detection system Lumi-LightPLUS (Roche, Mannheim, Germany) were used to detect bound antibodies. Densitometric comparison was carried out on the same immunoblot.
Correction for changes in tissue protein and mucosal surface area in Crohn’s disease
To correct for tissue protein content, biopsy specimens from six controls and six patients with active Crohn’s disease were taken in triplicate, and an area of 0.049 cm2 was punched out for preparation of crude membrane fractions. Then, protein content per cm2 serosal area was measured and a correction factor was determined as the quotient of protein content of Crohn’s disease over control.29 For analysis of the mucosal surface area, the number of crypts per serosal area was determined by light microscopy on unstained specimens. After staining of identical specimens with H&E, crypt length and inner crypt diameter were measured in cross-sections. Mucosal area was calculated as Am = πdclcnc+As, where dc is the inner crypt diameter, lc the crypt length, nc the number of crypts and As the mucosal surface area without crypts.30 The correction factor was determined as mucosal area of control over Crohn’s disease.
Immunohistochemistry and confocal laser scanning microscopy
Immunohistochemistry was carried out as described previously.29 Antibodies were rabbit anti-claudins 1, 2, 3, 5, 7, 8 and rabbit anti-ZO-1, rabbit anti-occludin, mouse anti-claudin 4 (all Zymed), and mouse anti-ZO-1 (BD Biosciences, San Jose, California, USA). Secondary antibodies were Alexa Fluor 594 goat anti-rabbit IgG and 488 goat anti-mouse IgG (Molecular Probes, Eugene, Oregon, USA). Images were obtained with a laser-scanning microscope (Zeiss LSM 510 Meta, Jena, Germany).
Cell culture of HT-29/B6 cells
HT-29/B6 experiments were performed as described previously.31 Briefly, cells were seeded on filters at an average concentration of 7×10⁵ cells/cm2 in RPMI 1640 containing 10% fetal calf serum (Biochrom, Berlin, Germany). Experiments were performed at day 7, when polarised monolayers reached confluence. After basolateral incubation with cytokines (tumour necrosis factor (TNFα) and interferon (IFN)γ; TEBU GmbH, Offenbach, Germany) for 24 h, cells were harvested and processed for Western blots.
Apoptotic ratio
Cellular DNA was stained with 4′,6′-diamidino-2′-phenylindole dihydrochloride (DAPI)32 or terminal deoxynucleotidyl transferase-mediated deoxyuridine triphosphate nick-end labelling (TUNEL; Roche) in serial sections of biopsy specimens as described previously.20 Apoptotic ratio was determined as the percentage of apoptotic nuclei per visual field at a magnification of ×200. Epithelial cells with intense staining of highly condensed or fragmented nuclei were counted as apoptotic epithelial cells. Four fields (about 150 enterocytes/field) per patient and staining were examined.
Statistical analysis
Data are expressed as means (standard error (SE)). Statistical analysis was carried out using Student’s t test. Differences between groups were tested by analysis of variance (Bonferroni correction). p<0.05 was considered significant.
RESULTS
Transmural impedance analysis
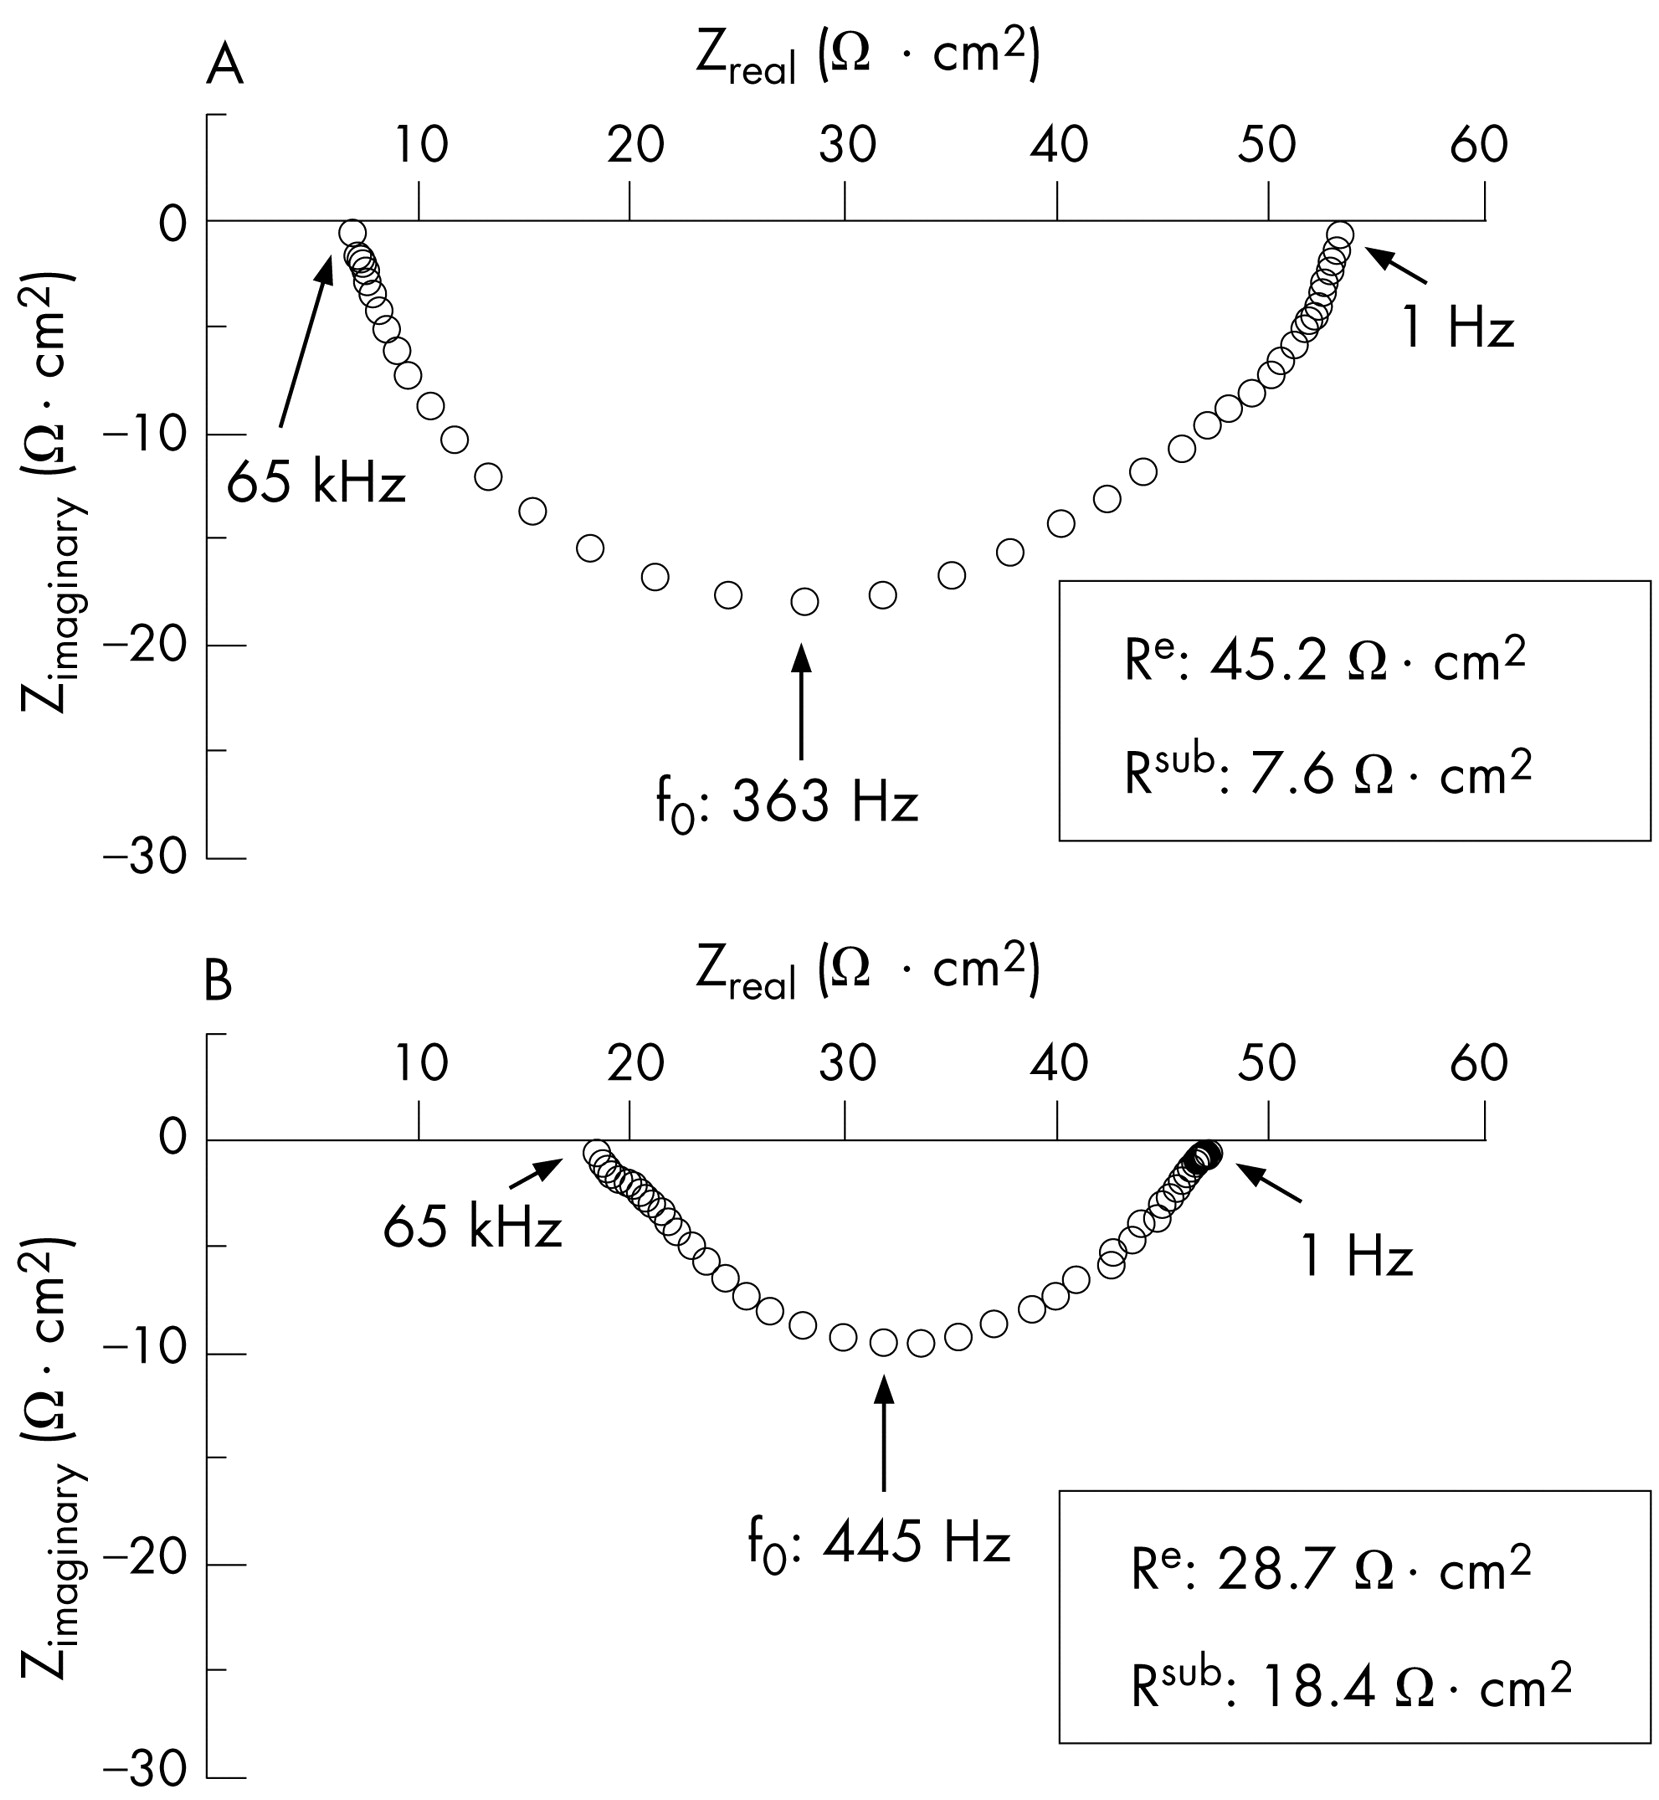
In controls (n = 10), epithelial resistance (Re) and subepithelial resistance (Rsub) were 39 (4) and 9 (1) Ω cm2, respectively (table 1, fig 1). Thus, transmural resistance (Rt) amounted to 48 (4) Ω cm2, and Re contributed 81% to transmural resistance in controls. These values were similar to those previously observed in biopsy specimens from controls.30 With the use of the same measuring protocol, Re was decreased to 23 (3) Ω cm2 in mild to moderately inflamed specimens with Crohn’s disease (n = 10, p<0.01 v control), whereas Rsub was increased to 21 (4) Ω cm2 (p<0.01 v control, table 1). Thus, Rt (43 (2) Ω cm2) did not significantly differ from control, but the contribution of Re to Rt was much lower in active Crohn’s disease (53%). By contrast, neither Re (38 (3) Ω cm2) nor Rsub (11 (1) Ω cm2) of patients with inactive Crohn’s disease (n = 9) was significantly different from that in controls (table 1). Thus, Re contributed 76% to Rt (50 (3) Ω cm2) in inactive Crohn’s disease (not significantly different from that in controls).
Transmural alternating current impedance analysis

Original impedance locus plots from the sigmoid colon of control (A) and mild to moderately inflamed Crohn’s disease (B). Zreal gives the ohmic component and Zimaginary the reactive component of the complex impedance. Intersections between the semicircle and the x axis at low and high frequencies represent total electrical wall resistance (Rt) and subepithelial electrical wall resistance (Rsub), respectively. Rt minus Rsub equals epithelial electrical wall resistance (Re).
Conductance scanning
In controls (n = 6), conductance showed an even spatial distribution (fig 2A, left) with a total epithelial conductivity of 28 (6) mS/cm2. In mild to moderately inflamed Crohn’s disease (n = 6), total epithelial conductivity was slightly higher (41 (9) mS/cm2, fig 2C) than in controls, although this did not reach statistical significance, as conductance scanning also reflects subepithelial electrical properties masking the differences in epithelial conductivity. More importantly, conductance scanning can yield information on the local distribution of conductivity, which was even not only in controls (fig 2A, left) but also in all specimens with active Crohn’s disease (fig 2B, left) with no obvious leaks. Consistently, subsequent histological analysis of biopsy specimens from these patients failed to show epithelial lesions (fig 2A,B, right). Owing to the lack of barrier dysfunction, conductance scanning was not carried out in patients with inactive Crohn’s disease.

Left side: three-dimension Cartesian mesh grid of local conductivity as measured by conductance scanning of sigmoid colon from control (A) and mild to moderately inflamed Crohn’s disease (B), respectively. x and y axes show the local position of the mucosal surface. z axis shows local conductivity. Right side: corresponding histology in haematoxylin and eosin (H&E)-stained sections. Magnification ×200. In control (A), conductivity was low and H&E staining showed an intact epithelium. In mild to moderately inflamed Crohn’s disease (B), total conductivity showed a tendency towards an increase, which did not reach statistical significance. Histologically, this was characterised by a regenerative epithelium (E) with a subepithelial lymphoplasmocytic infiltrate (L). (C) Median and range of local conductivities of controls and patients with Crohn’s disease. As the data appeared skewed, median and range are given and compared by the Mann–Whitney U test for significance.
To guarantee that epithelial lesions would be detected, if they were present, a specimen with Crohn’s disease with severe epithelial damage was studied. Conductance scanning showed a wide area of increased total epithelial conductivity, which considerably exceeded the values observed in mild to moderately inflamed Crohn’s disease, representing a microerosion in the histological analysis (data not shown).
Freeze fracture analysis of tight junctions
Figure 3 shows the original tight junction replicas and table 2 presents the statistical evaluation of the data. In controls, the mean (SE) number of horizontally oriented tight junction strands was 7.2 (0.2), n = 6, in the surface epithelium and 7.0 (0.4), n = 6, in the crypt epithelium, arguing against a relevant gradient of tight junction strand count along the crypt–surface axis. In active Crohn’s disease, tight junction strands were highly reduced to 4.7 (0.2) (surface, n = 6, p<0.001), and 4.4 (0.2) (crypt, n = 6, p<0.001), respectively. Thus, there was no crypt–surface axis gradient. The depth of the main tight junction meshwork was 438 (18) nm in the surface epithelium of controls, and was decreased to 363 (24) nm in active Crohn’s disease (n = 6; p<0.05). In crypt epithelium, the main tight junction meshwork depth was 395 (24) nm in controls (n = 6) and showed a tendency towards a reduction in active Crohn’s disease (348 (27) nm; n = 6), which just failed to reach significance. The total tight junction depth including aberrant strands did not differ between patients with Crohn’s disease and controls.
Quantitative freeze fracture electron microscopy analysis of tight junctions
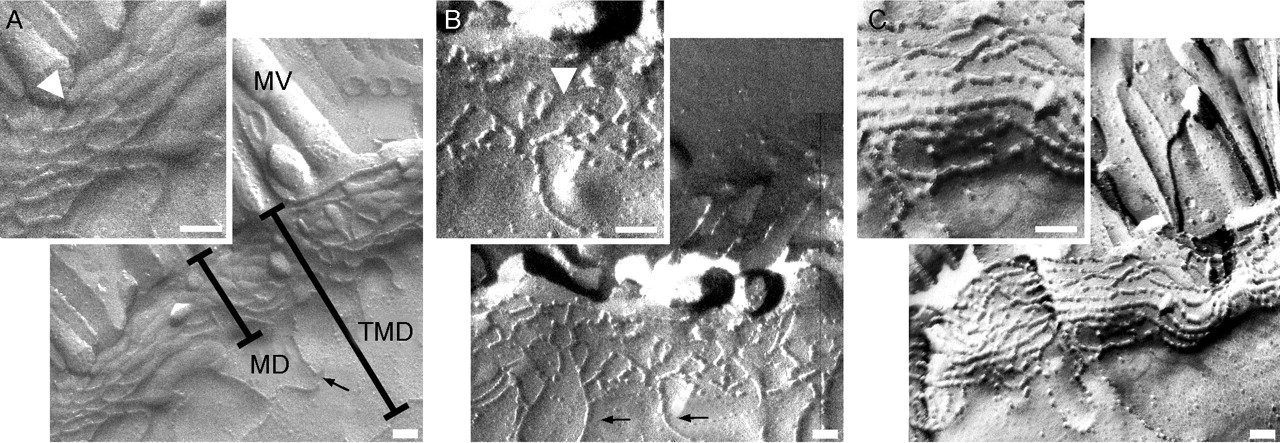
Freeze fracture electron microscopy of tight junction strands from control (A) and mild to moderately inflamed Crohn’s disease (B,C). Control replicas showed continuous strands (inset) with almost no strand breaks. By contrast, Crohn’s disease specimens showed a reduced number of tight junction strands with frequent strand breaks (arrowhead in B) or a complex but strongly discontinuous network of tight junction strands (C). Aberrant strands (arrow in A,B) appeared similarly in controls and active Crohn’s disease. Arrowhead in inset (A) indicates transition of protoplasmic to extracellular face. MD, main tight junction meshwork depth without aberrant strands; MV; micro villi; TMD, total tight junction meshwork depth from the most apical to the most basal strand including aberrant strands. Bar indicates 100 nm.
Analysis of strand breaks (interruptions ⩾25 nm) showed a small number of 0.2 (0.1) breaks per 1000 nm strand length in the surface and crypt epithelium of controls (n = 6; fig 3A), whereas breaks were dramatically increased to 2.9 (0.2) in the surface and 2.2 (0.2) in the crypt epithelium of patients with active Crohn’s disease (n = 6; p<0.001; fig 3B). Beyond these large-scale strand breaks, tight junction strands showed smaller interruptions in most replicas with Crohn’s disease (38 of 49 evaluated replicas; 78%) which led to a discontinuous bead-like appearance of tight junction strands in the surface and crypt epithelium in those with active Crohn’s disease (fig 3C, inset). By contrast, tight junction strands were almost exclusively continuous in controls (fig 3A, inset; discontinuous strands in 2 of 56 evaluated replicas; 4%; p<0.001).
Correction of protein content for inflammatory changes
Inflammatory compaction of subepithelial layers in active Crohn’s disease leads to dilution of epithelial proteins, resulting in underestimation of tight junction protein expression. This is further aggravated by epithelial surface reduction (eg, crypt rarefaction) as seen in ulcerative colitis.29 Therefore, correction of Western blot results in active Crohn’s disease is necessary. Histological evaluation showed broadened and elongated hyperproliferating crypts in active Crohn’s disease and a tendency towards crypt rarefaction (table 3). As the change in surface area due to crypt elongation exceeded that of crypt rarefaction, specimens with active Crohn’s disease showed a slight increase in mucosal surface area when compared with controls (table 3). Thus, quantification of tight junction protein expression in active Crohn’s disease requires taking into account both the increase in subepithelial protein (factor = 1.52 (0.13); p<0.001) and the increase in mucosal surface area (factor = 0.80 (0.06); p<0.001). By contrast, unaltered subepithelial resistance and a normal mucosal architecture argued against the necessity of correction in inactive Crohn’s disease.
Tissue protein and mucosal surface area
Expression of tight junction proteins
Densitometric results of samples from patients with Crohn’s disease were calculated as percentage of the mean of all control samples on the same immunoblot and are shown in fig 4, with and without correction for protein content and mucosal surface area, respectively. After correction, protein expression in patients with active Crohn’s disease (n = 10) was 56% (14%) of that in controls for occludin (p<0.05 v control), 75% (20%) for claudin 1 (NS), 75% (10%) for claudin 3 (p<0.05 v control), 106% (11%) for claudin 4 (NS) and 70% (11%) for claudin 5 (p<0.05 v control), 70% (20%) for claudin 7 (NS) and 31% (14%) for claudin 8 (p<0.001 v control). Expression of claudins 11, 12, 14, 15 and 16 could not be detected either in controls or in patients with Crohn’s disease (data not shown). In all control specimens, expression of claudin 2 was not detectable, whereas 6 of 10 patients with active Crohn’s disease showed intense claudin 2 signals. Owing to the absence of claudin 2 in controls, densitometric results could not be calculated as a percentage of control. As we have recently shown that the expression of claudin 2 is also increased in ulcerative colitis,31 we carried out a direct comparison of claudin 2 expression between patients with active ulcerative colitis (n = 6) and those with active Crohn’s disease (n = 6). We found that claudin 2 expression was much higher in ulcerative colitis compared with Crohn’s disease (349% (32%) of that in Crohn’s disease; p<0.001; fig 4C).

Expression of tight junction proteins as obtained from crude membrane fractions in immunoblots. (A) Western blot of three controls and three mild to moderately inflamed cases of Crohn’s disease. Whereas claudin 2 could not be detected in all three controls, claudin 8 could not be detected in patients 4 and 5 with Crohn’s disease. (B) Statistical evaluation by densitometry. Values represent means (SEM) of protein expression analysed in comparison with control values on the same blot, which were set as 100%. CTR, controls (n = 10). CD, patients with active Crohn’s disease (n = 10). CDcorr, patients with active Crohn’s disease corrected for the amount of protein and change in mucosal surface area. *p<0.05, **p<0.001 versus control. (C) Densitometric evaluation of claudin 2 expression in active Crohn’s disease (CD; n = 6; set as 100%) and active ulcerative colitis (UC; n = 6). Values represent means (SEM) of protein expression analysed on the same blot.
In contrast with active Crohn’s disease, expression of tight junction proteins was not changed in inactive Crohn’s disease (n = 8 patients). Densitometric results amounted to 102% (16%) of that in controls for occludin (NS), 107% (12%) for claudin 1 (NS), 115% (11%) for claudin 3 (NS), 104% (9%) for claudin 4 (NS), 113% (16%) for claudin 5 (NS), 99% (13%) for claudin 7 (NS) and 90% (6%) for claudin 8 (NS). Moreover, expression of claudin 2 was not detectable in all specimens with inactive Crohn’s disease.
Confocal laser scanning microscopy of tight junction proteins
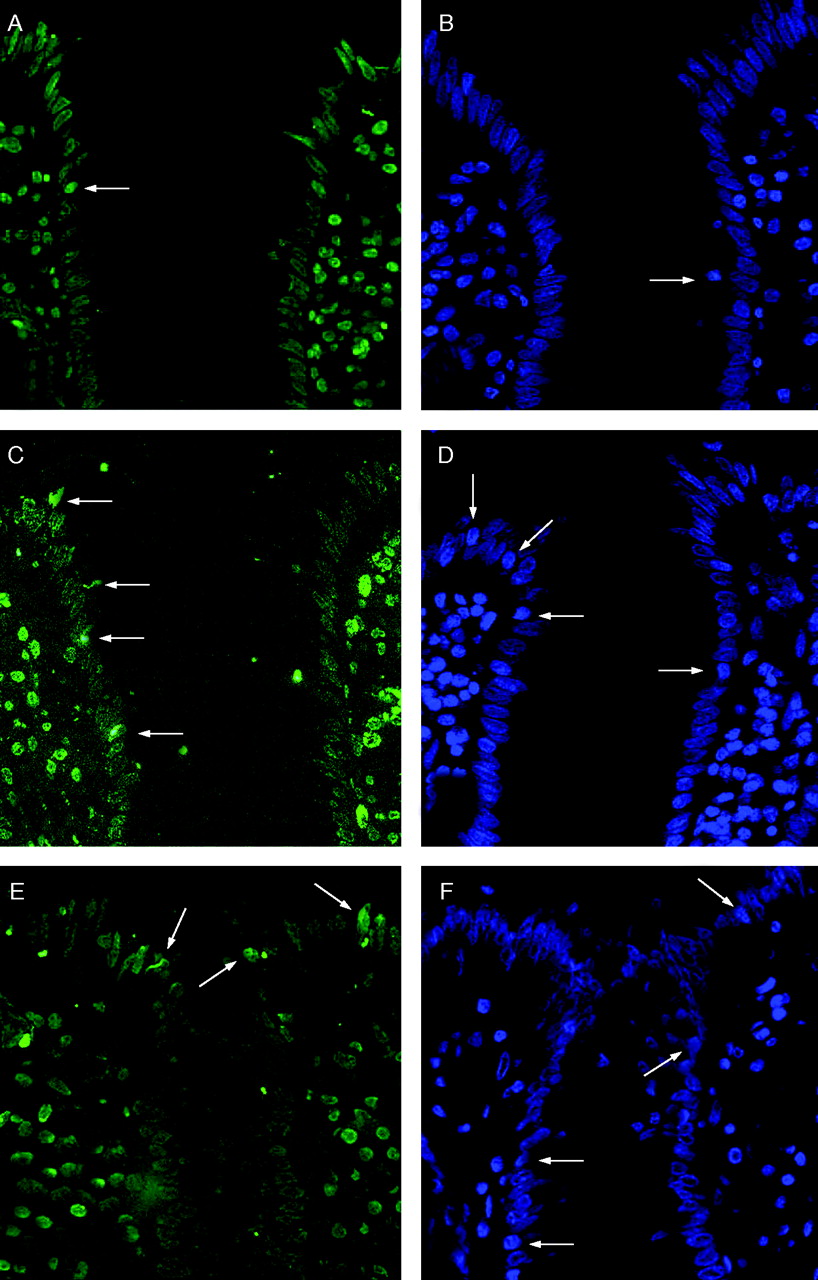
Confocal laser scanning microscopy served to localise tight junction proteins in controls (n = 4) and active Crohn’s disease (n = 4). As neither barrier function nor tight junction protein expression were changed in inactive Crohn’s disease, we did not investigate tight junction protein distribution in inactive Crohn’s disease. ZO-1 was used as a reference, as its localisation in Crohn’s disease is not altered apart from regions with transmigrating neutrophils.14 In controls, occludin and claudin 1 were detected in the tight junctions and subjunctional lateral membrane of surface and crypt enterocytes, whereas their subjunctional but not tight junctional staining was reduced in active Crohn’s disease (see fig A online at http://www.gutjnl.com/supplemental). Claudin 2 was not detectable in controls, whereas patients with active Crohn’s disease showed intense tight junctional staining in the bottom of intestinal crypts (fig 5, see fig A online at http://www.gutjnl.com/supplemental), but not in surface epithelium (data not shown). Claudin 3 was predominantly lateral in controls without a crypt–surface gradient, whereas patients with active Crohn’s disease showed weak cytoplasmic staining (fig 5, see fig A online at http://www.gutjnl.com/supplemental). Claudins 4 and 7 exhibited a predominantly lateral membrane and additional junctional and cytoplasmic staining in crypt and surface epithelium with no differences between controls and active Crohn’s disease (see fig A online at http://www.gutjnl.com/supplemental). Claudin 5 and 8 were strictly junctional in both surface and crypt epithelium of controls. By contrast, claudin 5 was redistributed from the tight junctions to the subjunctional lateral membrane in active Crohn’s disease, and claudin 8 showed weak staining in the apical cytoplasm of enterocytes mostly not colocalising with ZO-1 (fig 5, see fig A online at http://www.gutjnl.com/supplemental).
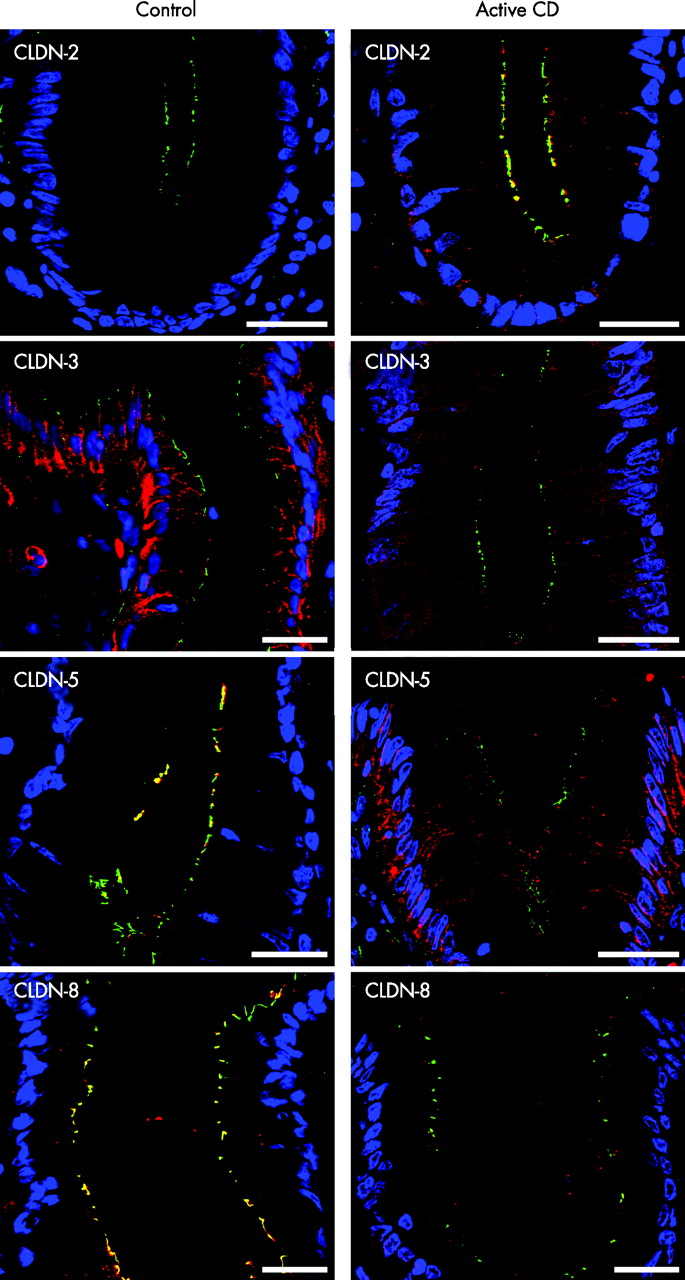
Merged pictures of ZO-1 (green), the respective claudin (red) and nuclei (blue) as obtained by immunofluorescence analysis of biopsy specimens from sigmoid colon of control and active Crohn’s disease. Pictures show the upper part of a crypt, except for claudin 2, which is shown at the base of a crypt. Claudin 2 was restricted to a subset of crypt cells in active Crohn’s disease (tight junctional localisation) and was not detectable in controls. Claudin 3 showed an intense and predominantly lateral membrane staining in controls, whereas claudin 3 signal was distinctly reduced in active Crohn’s disease with a diffuse cytoplasmic staining. In controls, claudin 5 showed tight junctional staining in both crypts and surface, whereas it was redistributed from the tight junction to the lateral plasma membrane in active Crohn’s disease. Claudin 8 was strictly localised tight junctionally in surface and crypts of controls, whereas it stained weakly in the apical cytoplasm in active Crohn’s disease mostly not colocalising with ZO-1. Bar = 20 μm. For unmerged pictures and pictures of other claudins see fig A at http://www.gutjnl.com/supplemental.
Influence of proinflammatory cytokines on claudin 2
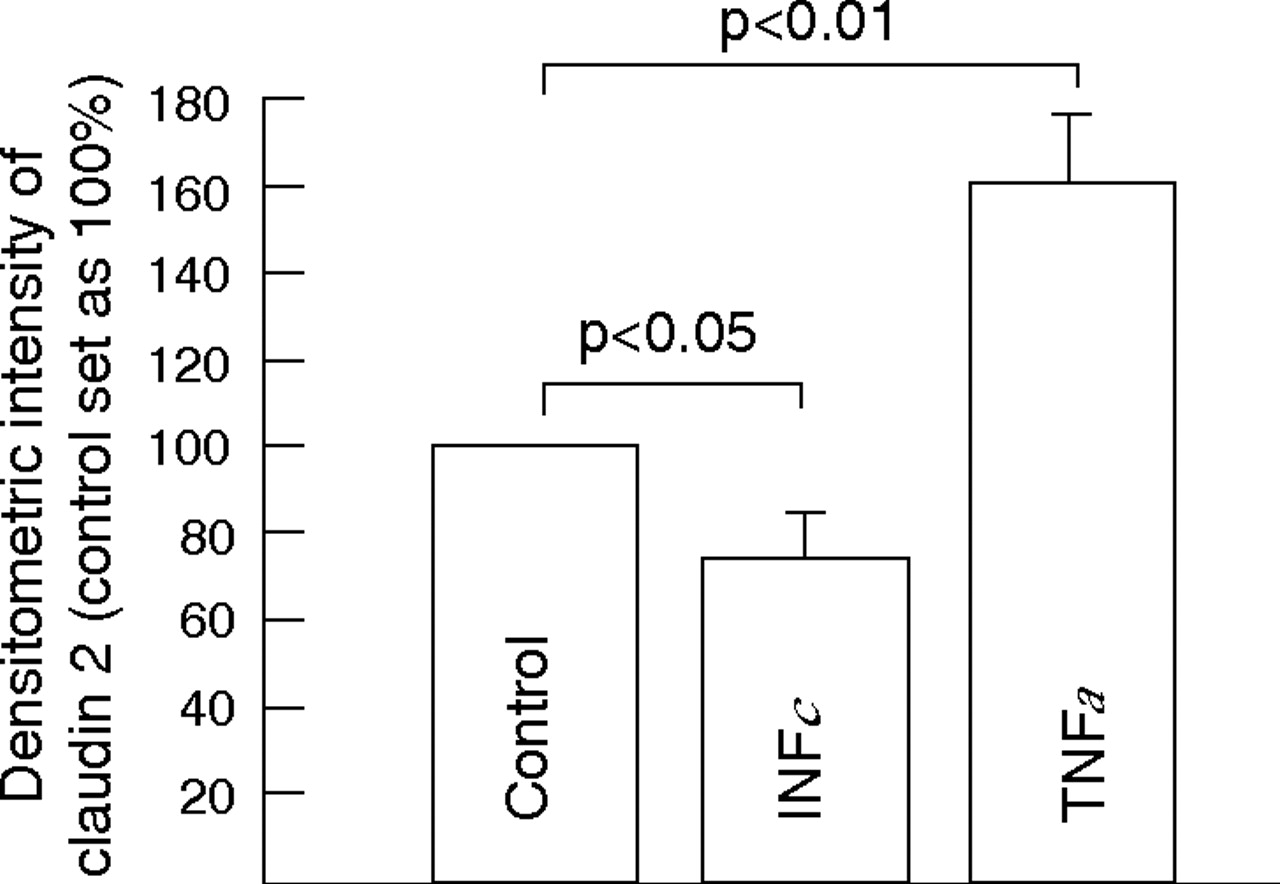
To characterise the cytokines that may upregulate claudin 2 in active Crohn’s disease, HT-29/B6 cells were exposed to IFNγ and TNFα for 24 h. Although treatment with the T helper 1 (Th1)-cytokine IFNγ (1000 U/ml) led to reduced intensity of the 22-kDa claudin 2 signal in Western blots (74% (11%) of that in untreated controls; p<0.05; n = 4), TNFα (100 ng/ml) increased claudin 2 expression to 155% (15%) of that in controls (p<0.01; n = 4; fig 6).

Immunoblot of claudin 2 in HT-29/B6 cell monolayers after 24 h of treatment with interferon γ (IFNγ, 1000 U/ml), tumour necrosis factor α (TNFα, 100 ng/ml) or without treatment (control). Signal intensity of the 22-kDa claudin 2 specific band from the untreated control was set as 100% and was compared with cytokine-treated cells on the same blot. Values represent means (SEM).
Intestinal epithelial apoptosis
Intestinal epithelial apoptosis was investigated in TUNEL or DAPI stained sections of sigmoid colon from 10 control patients, 10 patients with mild to moderately inflamed Crohn’s disease and 11 patients with mild to moderately inflamed ulcerative colitis. The two staining procedures yielded almost identical results (table 4, fig 7). The epithelial apoptotic ratio was 1.9% (0.2%) in controls (results of TUNEL staining) and was significantly increased to 5.2% (0.5%) in those with mild to moderately inflamed Crohn’s disease (p<0.001 v control). For a direct comparison, apoptotic ratio was also evaluated in ulcerative colitis. In mild to moderately inflamed ulcerative colitis, the apoptotic ratio was 4.0% (0.5%; p<0.01 v control), which did not significantly differ from mild to moderately inflamed Crohn’s disease. To investigate whether increased epithelial apoptosis persists in remission, we additionally investigated eight patients with Crohn’s disease in remission. However, the apoptotic ratio in these patients did not differ from that in controls (TUNEL 1.6% (0.5%), DAPI 2.0% (0.3%)).
Epithelial apoptotic ratio
Terminal deoxynucleotidyl transferase-mediated deoxyuridine triphosphate nick-end labelling (A,C,E) and 4′,6-diamidino-2-phenylindole (B,D,F) stained thin sections of sigmoid colon from control (A,B), active Crohn’s disease (C,D) and active ulcerative colitis (E,F). In all pictures, the entrance of a crypt surrounded by surface epithelium is shown. Arrows indicate apoptotic epithelial cells which were much more common in active Crohn’s disease and ulcerative colitis when compared with controls. Magnification ×200.
DISCUSSION
In Crohn’s disease, barrier dysfunction can lead to leak-flux diarrhoea and intestinal inflammation by enhancing antigen transport.33 Although increased transcellular permeability in the face of an intact paracellular barrier seems to be the first step of barrier dysfunction in macroscopically non-inflamed Crohn’s disease, epithelial gross lesions such as ulcers are the predominant defects in severe disease.34 In the present paper, we investigated mechanisms of barrier impairment in mild to moderately inflamed (non-ulcerative) Crohn’s disease and identified tight junction changes and increased epithelial apoptosis as the structural correlate of barrier dysfunction.
Intestinal barrier dysfunction in active Crohn’s disease
As a major result of our study, epithelial resistance was found to be reduced to almost half of the control value in mild to moderately inflamed Crohn’s disease. However, this decrease in resistance in Crohn’s disease was less pronounced than observed previously in mild to moderate ulcerative colitis. Epithelial resistance then was only 21% of control.9 This may have several reasons. At first, expression of the pore-forming tight junction protein claudin 2 was higher in ulcerative colitis compared with Crohn’s disease (cf below). Secondly, in contrast with Th1 cytokines, the Th2 cytokine interleukin (IL)13 impairs mucosal restitution of epithelial defects (eg, caused by epithelial apoptosis), leading to focal epithelial lesions in ulcerative colitis, but not in Crohn’s disease (cf below).10,31,35
Although inflammatory compaction of subepithelial layers in active Crohn’s disease led to unchanged total resistance, subepithelial compaction has no physiological barrier effect. However, it masks epithelial barrier dysfunction in conventional direct-current Ussing-chamber measurements, which underlines the importance of alternating current impedance analysis.
Intact barrier function in Crohn’s disease in remission
Several studies have shown increased intestinal permeability in a subgroup of patients with inactive Crohn’s disease correlating with a higher relapse rate in these patients.36,37 However, it was suggested by Soderholm et al34 that increased transcellular permeability in inactive Crohn’s disease takes place in the presence of an intact paracellular barrier and allows the passage of antigenic molecules leading to active inflammation. In support of this hypothesis we did not find a significant paracellular barrier dysfunction in support of this hypothesis in patients with inactive Crohn’s disease. In accordance, neither tight junction protein expression nor epithelial apoptosis was altered in Crohn’s disease in remission, whereas both accounted for barrier dysfunction in active Crohn’s disease. Although this cross-sectional analysis cannot exclude the possibility that subtle changes in barrier function precede exacerbation of disease in a subgroup of patients with Crohn’s disease, it indicates that the tight junction protein changes and the increased amount of epithelial apoptosis found in active Crohn’s disease are a secondary phenomenon in reaction to proinflammatory cytokines.
No focal epithelial lesions in mild to moderately active Crohn’s disease
Focal epithelial lesions represent small regions of highly increased conductivity, which are surrounded by an intact low-conductivity epithelium. We have recently shown that these focal lesions mainly contribute to barrier breakdown observed in mild ulcerative colitis and that they are caused by foci of multiple adjoining apoptotic epithelial cells or micro-erosions.10 However, in sharp contrast with ulcerative colitis, we could not detect focal epithelial lesions in mild to moderate Crohn’s disease, which is a further essential finding of our study. As the apoptotic ratio did not differ between the two diseases (cf below), the lack of focal lesions in Crohn’s disease is assumed to be the consequence of faster epithelial restitution under Th1 cytokine conditions.31,35
Tight junction architecture is severely altered in active Crohn’s disease
Freeze fracture electron microscopy showed a reduced number of tight junction strands in active Crohn’s disease that was paralleled by a decreased depth of the main tight junction meshwork. Owing to the exponential correlation between epithelial resistance and tight junction strand number,38 these changes have to be seen as a structural correlate of the barrier dysfunction in Crohn’s disease. As a further substantial finding, we showed a more than 10-fold increase in the number of strand breaks in active Crohn’s disease. Owing to the size of the interruptions (>25 nm), these strand breaks can provide a route for the passage of large immunogenic macromolecules, particularly in the face of tight junction regions composed of only two or three strands (fig 3B).
Beyond large interruptions, strands had a discontinuous architecture in active Crohn’s disease, partly with a compensatory increase in tight junction strand number (fig 3C). As this pattern was found in most specimens of crypt and surface epithelium in active Crohn’s disease, but only very rarely in controls, it cannot be attributed to apoptotic cells or a preparation artefact. This is a relevant observation, because it is well known that tight junctions exhibit continuous strands when constituted of the sealing claudin 1 or claudin 3 (resembling strands in controls), but discontinuous strands when based on the pore-forming claudin 2 (resembling strands in active Crohn’s disease).39 Therefore, it has to be assumed that the increase in claudin 2 with the decrease in claudins 3, 5 and 8 represents the molecular basis of discontinuous strands in active Crohn’s disease, which may lead to conversion of tight into leaky tight junctions as observed in MDCK cells.40
Correction of tight junction protein expression
Inflammatory thickened subepithelial layers in active Crohn’s disease led to a dilution artefact of tight junction proteins. In addition, epithelial surface was slightly increased in active Crohn’s disease because of a hyperproliferative epithelium (table 3). Therefore, we had to calculate a correction factor compensating for these changes, which was originally established by our group for ulcerative colitis.29 As the increase in protein content was more pronounced than the change in surface area, this correction factor turned out to be 1.22. This has specific implications. For example, without correction, expression of claudin 1 and claudin 7 seemed to be lower in patients with active Crohn’s disease than in controls, whereas it was unaltered after correction (fig 4B).
Altered expression and distribution of tight junction proteins in active Crohn’s disease
The tissue-specific subset of claudins determines the barrier properties of the respective epithelium. Whereas several of the 24 claudins increase epithelial resistance mostly by decreasing cation permeability (eg, claudins 1, 4, 5, 7, 8 and 14), others counteract this by creating cation selective pores with a consecutive decrease in resistance (eg, claudin 2 and 16).41 Moreover, some claudins (eg, claudins 11 and 15) can either increase or decrease epithelial resistance depending on the presence of other claudins within the tight junctions.42,43 As there is little known about the gut-specific subset of claudins, we investigated distribution of all claudins which are characterised based on their effects on barrier function.
In accordance with their electrophysiological properties, we found constitutive expression of sealing tight junction proteins (claudins 1, 3, 4, 5, 7 and 8) and no expression of the pore-forming claudin 2 in healthy sigmoid colon. Claudins 11, 12, 14, 15 and 16 were not detectable in sigmoid colon. Whereas only a minority of claudins were exclusively distributed within the tight junctions (claudins 5 and 8), most of them showed additional (occludin, claudin 1) or even predominant (claudins 3, 4 and 7) lateral membrane staining.
In sharp contrast with controls, expression of sealing claudins that decrease cation permeability (claudins 5 and 8) was greatly diminished in active Crohn’s disease, as was claudin 3, which is believed to exhibit sealing properties.13,44 Moreover, the pore-forming claudin 2 was dramatically upregulated, especially in patients with low expression of claudin 8 (fig 4A), which indicates that, at least in the base of crypts, claudin 2 may indeed substitute for claudin 8 as assumed previously.45 Despite residual expression of claudins 5 and 8 in active Crohn’s disease, both tight junction proteins were redistributed off the tight junctions and thus did not contribute to barrier function. In conclusion, downregulation and redistribution of sealing claudins with increased expression of the pore-forming claudin 2 enhances tight junction permeability for cations, thus providing the molecular basis for leak-flux diarrhoea in Crohn’s disease. As TNFα but not IFNγ led to upregulation of claudin 2 expression in HT-29/B6 cells, increased TNFα production by lamina propria lymphocytes46 is assumed to contribute to claudin 2 upregulation in Crohn’s disease (fig 6). By contrast, we have previously shown that IL13 is the key effector of claudin 2 upregulation in ulcerative colitis.31 In accordance with the stronger claudin 2 induction by IL1331 compared with TNFα, we found a higher expression of claudin 2 in ulcerative colitis compared with Crohn’s disease (fig 4C). These findings, together with unchanged tight junction protein expression in Crohn’s disease in remission, indicate that tight junction changes are the consequence of changes in the local cytokine profile. This explains on the one hand why, for example, microorganisms can cause tight junction changes similar to those found here in Crohn’s disease.47–49 On the other hand, it explains the differential tight junction protein regulation in subtypes of IBD due to differences in the local cytokine profile.30,31
Increased epithelial apoptosis in active Crohn’s disease
We have previously shown that single-cell apoptosis produces spots of increased local conductance within the epithelia, which is aggravated under inflammatory stimulation by TNFα when compared with spontaneous apoptoses.10,17,18 Moreover, we have recently found that downregulation of increased epithelial apoptosis in highly active Crohn’s disease by TNFα antibody treatment improved barrier function.31 As the apoptotic ratio in this study of mild to moderately active Crohn’s disease resembled values of the previous analysis of severe, steroid-refractory Crohn’s disease, a significant contribution of apoptosis to barrier dysfunction must also be assumed for mild to moderately active Crohn’s disease. As enterocyte apoptosis had been reported to be highly increased in ulcerative colitis, reaching values of 28%, it was hypothesised that epithelial apoptosis is much more pronounced in ulcerative colitis compared with Crohn’s disease, although a direct comparison was not carried out.19,21 In contrast with this hypothesis, we show that the apoptotic ratio does not differ between mild to moderately inflamed Crohn’s disease and ulcerative colitis. However, owing to decelerated restitution caused by the Th2 cytokine IL13, epithelial apoptosis leads to the appearance of focal lesions in ulcerative colitis10 but not in Crohn’s disease (fig 2). Thus, epithelial apoptoses are equally common in ulcerative colitis and Crohn’s disease, but their functional consequence has to be considered more relevant in ulcerative colitis.
Although it is not possible to allocate the contributions of increased apoptosis and tight junction changes to barrier impairment in IBD specimens here, this may be extrapolated from barrier data on the model epithelium HT-29/B6.17,50 Under the influence of the Th1 cytokines TNFα and IFNγ, epithelial resistance decreased by about 50%, which was to a similar degree due to impaired tight junctions and a twofold increase in apoptosis.
Acknowledgments
We thank Anja Fromm and Susanna Schön for their excellent assistance, and the electronic engineer Detlef Sorgenfrei for great support.
REFERENCES
Supplementary materials
Supplementary Data
This web only file has been produced by the BMJ Publishing Group from an electronic file supplied by the author(s) and has not been edited for content.
Files in this Data Supplement:
- Data supplement 1 - Online figure
Footnotes
-
Published Online First 5 July 2006
-
Funding: This study was supported by grants from Deutsche Forschungsgemeinschaft (DFG graduate scholarship 276/2, DFG Schu 559/7-4), DFG Schu 559/9-1 Deutsche Morbus Crohn/Colitis ulcerosa Vereinigung-DCCV-e.V, the German BMBF/DLR in the medical competence network inflammatory bowel disease, the Sonnenfeld-Stiftung Berlin and the Else Kroener-Fresenius-Stiftung.
-
Competing interests: None.