Article Text

Abstract
Objective: This study aimed to identify the oncogenes at 20q involved in colorectal adenoma to carcinoma progression by measuring the effect of 20q gain on mRNA expression of genes in this amplicon.
Methods: Segmentation of DNA copy number changes on 20q was performed by array CGH (comparative genomic hybridisation) in 34 non-progressed colorectal adenomas, 41 progressed adenomas (ie, adenomas that present a focus of cancer) and 33 adenocarcinomas. Moreover, a robust analysis of altered expression of genes in these segments was performed by microarray analysis in 37 adenomas and 31 adenocarcinomas. Protein expression was evaluated by immunohistochemistry on tissue microarrays.
Results: The genes C20orf24, AURKA, RNPC1, TH1L, ADRM1, C20orf20 and TCFL5, mapping at 20q, were significantly overexpressed in carcinomas compared with adenomas as a consequence of copy number gain of 20q.
Conclusion: This approach revealed C20orf24, AURKA, RNPC1, TH1L, ADRM1, C20orf20 and TCFL5 genes to be important in chromosomal instability-related adenoma to carcinoma progression. These genes therefore may serve as highly specific biomarkers for colorectal cancer with potential clinical applications.
Statistics from Altmetric.com
The majority of cancers are epithelial in origin and arise through a stepwise progression from normal cells, through dysplasia, into malignant cells that invade surrounding tissues and have metastatic potential. The colorectal adenoma to carcinoma progression is a classic example of this process.1 2
Genomic instability is a crucial step in this progression and occurs in two ways in colorectal cancer (CRC).3 DNA mismatch repair deficiency leading to microsatellite instability (MIN) explains about 15% of cases.4–6 In the other 85%, genomic instability occurs at the chromosomal level (CIN) giving rise to aneuploidy. While for a long time chromosomal aberrations have been regarded as random noise, it is now well established that these DNA copy number changes occur in specific patterns and are associated with different clinical behaviour.7–9 Nevertheless, neither the cause of CIN in human cancer progression nor its biological consequences have been fully appreciated.
Chromosomal aberrations frequently reported in CRC are 7pq, 8q, 13q and 20q gains, and 4pq, 5q, 8p, 15q, 17p and 18q losses.10–13 Of these, especially 8q, 13q and 20q gains and 8p, 15q, 17p and 18q losses are associated with colorectal adenoma to carcinoma progression.
Gain of 20q is observed in >65% of CRCs.14 Gains of 20q are also common in other tumour types and have been associated with poor outcome in gastric cancer and CRC.15–20 The 20q13 amplicon has been studied in detail in breast and gastric cancers with restricted contig array comparative genomic hybridisation (CGH), pinpointing several genes as targets of amplification.21 22 Analysis of DNA copy number changes at the gene level by multiplex ligation-dependent probe amplification showed that in CRC, besides 20q13, 20q11 is also frequently amplified.23
This study aims to investigate dosage effects of putative 20q oncogenes in colorectal adenoma to carcinoma progression.
MATERIALS AND METHODS
Tumour samples
Forty-one formalin-fixed and paraffin-embedded progressed adenomas (with a focus of carcinoma present, also referred to as malignant polyps) collected from the tissue archive of the department of pathology at the VU University Medical Center (VUmc), Amsterdam, The Netherlands, and 73 prospectively collected snap-frozen colorectal tumour samples (37 non-progressed adenomas and 36 carcinomas) were investigated. All samples were used in compliance with the institution’s ethical regulations.
The 41 progressed adenomas corresponded to 19 females and 18 males (three patients presented more than one lesion). Mean age was 67 years (range 45–86). From these, adenoma and carcinoma components were analysed separately, adding up to a total of 82 archival samples (41×2).
The 73 frozen specimens corresponded to 31 females and 34 males (six patients had multiple tumours). Mean age was 69 years (range 47–89). All histological sections were evaluated by a pathologist (G.A.M.).
Array CGH was performed on both sets of samples, while expression microarrays were performed on the frozen samples only.
DNA and RNA isolation
DNA from paraffin-embedded samples was obtained as described previously.24 RNA and DNA from snap-frozen tissues were isolated using TRIzol (Invitrogen, Breda, The Netherlands) following the supplier’s instructions with some modifications, described at http://www.english.vumc.nl/afdelingen/microarrays. Isolated RNA was subjected to purification using an RNeasy Mini Kit (Qiagen, Venlo, The Netherlands). RNA and DNA concentrations and purities were measured on a Nanodrop ND-1000 spectrophotometer (Isogen, IJsselstein, The Netherlands), and integrity was evaluated on a 1% agarose ethidium bromide-stained gel.
Array CGH
A BAC/PAC (bacterial artificial chromosome/phage artificial chromosome) array platform was used as described elsewhere.25 Arrays were scanned (Agilent DNA Microarray scanner G2505B, Agilent Technologies, Palo Alto, California, USA) and Imagene 5.6 software (Biodiscovery, Marina del Rey, California, USA) was used for automatic feature extraction with default settings. Local background was subtracted from the signal median intensities of both test and reference DNA. The median of the triplicate spots was calculated for each BAC clone, and log2 ratios (tumour/normal) were normalised by subtraction of the mode value of BAC clones on chromosomes 1–22 (UCSC July 2003 freeze of the Human Golden Path-NCBI Build 34). Clones with standard deviation of the intensity of the three spots > 0.2 and with >20% missing values were excluded.
Expression microarrays
The Human Release 2.0 oligonucleotide library, containing 60mer oligonucleotides representing 28 830 unique genes, designed by Compugen (San Jose, California, USA) was obtained from Sigma-Genosys (Zwijndrecht, The Netherlands). Printing of slides was done as described elsewhere.26 Tumour RNA (30 μg) was hybridised against Universal Human reference (Stratagene, Amsterdam, The Netherlands). cDNA labelling and hybridisation procedures are described elsewhere.26 Scanning of arrays and feature extraction were performed as described above. Overall quality of experiments was judged on microarray plots of intensities of raw data. Normalisation was done either with TIGR Midas (http://www.tm4.org/midas.html), using “Lowess” correction27 or with “Median” normalisation and implemented in the maNorm function (Marray R bioconductor package), with identical results. Interarray normalisation was also performed. Low intensity values were replaced by the intensity value of 50. Genes with >20% missing values were excluded.
Array CGH and expression microarray data sets are available at Gene Expression Omnibus (GEO) http://www.ncbi.nlm.nih.gov/geo/,28 accession number GSE8067.
Microarray data analysis
Below, the steps of data analysis are discussed for array CGH data, expression data and integrative analysis. To account for multiple testing, either a false discovery rate (FDR) correction was applied to the p values, or a very stringent p value cut-off was used.
Array CGH data
To segment DNA copy number alterations, a smoothing algorithm, “aCGH-Smooth”, was applied.29 Smoothed log2 ratios of −0.15 and 0.15 were used as thresholds to define gains and losses (99% CIs) obtained for 15 normal-to-normal hybridisations. Only gains and losses covering at least three consecutive BAC clones were included. Amplifications were called when log2 ratios exceeded 1.0. DNA copy number data were stored in ArrayCGHbase30 (http://arraydb.vumc.nl/arrayCGHbase). Median absolute deviation (MAD) was determined for each case as a quality control. Cases with MAD ⩾0.2 were excluded. Array CGH profiles were visualised in ArrayCGHbase.
Supervised analysis, comparing two groups, was done using CGHMultiArray.31 For analysis of paired samples (adenoma and carcinoma components within progressed adenomas), an adapted version of CGHMultiArray was used, based on the Wilcoxon sign-rank test corrected for ties. Reported p values are adjusted for multiple testing (FDR), unless stated otherwise.
For defining the most frequent smallest regions of overlap (SRO) for gains on 20q, in all cases, STAC (significance testing for aberrant copy number) was used.32
Microarray expression data
As all hybridisations were performed against a common reference, all comparisons were relative between colorectal adenomas and carcinomas.
Supervised analysis for comparing carcinomas and adenomas was done using the Wilcoxon signed rank test, and a modified version of this test—the total Thas score (http://www.cvstat.ugent.be/index.php?page = techrep/techrep.htm) that is powerful when the distributions of the expression levels of both groups do not differ over the whole range of expression levels. This occurs when not all cases in the carcinoma and adenoma groups have differentially expressed genes, but differences rather appear in subpopulations. Genes were considered as differentially expressed when a Wilcoxon test p value was <1e-5 and a Thas p value was <0.05, corresponding to an FDR of <0.05.
To disclose genes whose expression is influenced by 20q gain, tumours with and without 20q gain were compared. Gene expression was regressed on copy number count using a linear model.
To evaluate the discriminatory power of candidate genes for classifying adenomas versus carcinomas, a stepwise linear discriminant analysis with leave one out cross-validation was performed on mRNA expression data (SPSS 15.0 for Windows, SPSS, Chicago, Illinois, USA).
Integration of copy number and expression data
ACE-it (Array CGH Expression integration tool) was applied to test whether gene dosage affects RNA expression.33 Only genes on chromosome 20 are presented. We used a cut-off value of 0.15 for gains and losses, a default group value of 9 and an FDR ⩽0.10.
Quantitative reverse transcription-PCR (qRT-PCR)
RNA (1 μg) was treated with DNase I and reverse transcribed to cDNA using oligo(dT)20 primer with Superscript II reverse transcriptase (Invitrogen).
qRT-PCR was performed in duplicate on 15 adenomas and 15 carcinomas for six candidate genes. A master mix was prepared with 12.5 μl of SYBR Green PCR master mix (Applied Biosystems, Nieuwerkerk a/d IJssel, The Netherlands), 0.5 μM of each primer in 22.5 μl. cDNA (25 ng in 2.5 μl) was added to the mix. Reactions were performed in a 7300 Real-time PCR System (Applied Biosystems). Amplification conditions comprised a denaturation step at 95°C for 10 min and 50 cycles at 95°C for 15 s and annealing temperature for 1 min (Supplementary table 1). Relative expression levels were determined following the 2ΔΔCt method,34 using the β-2-microglobulin gene as a reference. This gene was previously demonstrated not to differ in expression between adenomas and carcinomas.35
Immunohistochemistry on tissue microarrays (TMAs)
A TMA was constructed with 57 tumours (32 adenomas and 25 carcinomas) for which array CGH and/or expression microarray data were available. For each tumour, three cores from different locations within the tumour were included in the array. A 4 μm section of the array was used for immunohistochemistry. After deparaffination in xylene, and rehydration through graded alcohol to water, endogenous peroxidase was blocked with hydrogen peroxide (0.3% H2O2/methanol) for 25 min. Antigen retrieval was done by autoclaving in citrate buffer (10 mM; pH 6.0). Primary Aurora A monoclonal antibody NCL-L-AK2 from Novocastra Laboratories (Newcastle, UK) was incubated overnight at 4°C at a dilution of 1:50. The secondary mouse antibody, K4006, from the Envision kit (DAKO, Heverlee, Belgium) was incubated for 30 min at room temperature. Counterstaining was done with Mayer’s haematoxylin. Incubation without primary antibody was used as negative control. The colorectal cancer cell line Caco-2, which has a 20q gain and is known to express Aurora A, was used as positive control. Caco-2 cells were fixed and paraffin embedded, and sections were taken along in the same run of immunohistochemistry as that in which the TMA was processed. Caco-2 produced strong nuclear, mostly along with cytoplasmic, staining in >75% of tumour cells, and this pattern was taken as reference for intense staining. Next, the spectrum of staining in the respective cores on the TMA was surveyed in terms of intensity and positive nuclei. Only staining in tumour cells (ie, either adenoma or carcinoma cells) was considered. Cores of the TMA typically contained 4–17 crypts with every crypt >100 cells, which all were evaluated. Basically, three staining patterns were seen: no staining at all, strong staining comparable with that observed in Caco-2 cells; and an intermediate pattern that showed positive staining, but clearly less intense than in Caco-2 cells. The intensity of staining was taken as the most important parameter. In pattern 2, typically 50% to >75% of nuclei showed intense staining, while in pattern 1 typically 25% to >75% of nuclei showed weak staining. For score 0, no more than a scattered weakly positive cell was tolerated. Based on evaluation of up to three cores by two independent observers, a score ranging from 0 to 2 was assigned per tumour, with score 0 corresponding to no signal, score 2 corresponding to the strong signal that was observed in the positive control Caco-2, and score 1 for an intermediate intensity staining. In the case of disagreement between observers, a third observer was consulted and the majority score was noted.
Cochran–Armitage test analysis was performed to compare protein expression with lesion type (adenoma, carcinoma). The Jonckheere–Terpstra test was performed to compare protein expression with log2 ratios (microarray expression data). Both tests make explicit use of the ordinality of the protein levels of expression. Differences were considered significant when p <0.05.
RESULTS
Delimiting gained regions on 20q
We analysed by array CGH 41 progressed adenomas, which were previously studied by classical CGH. We analysed the adenoma and carcinoma components of these samples separately. Gain of 20q occurred in >60% of the cases (fig 1A,B; Supplementary fig 1A). The pattern of copy number changes did not differ between adenoma and carcinoma components (as determined by CGHMultiArray), although it sometimes showed lower amplitudes in the adenoma component (fig 1A,B).
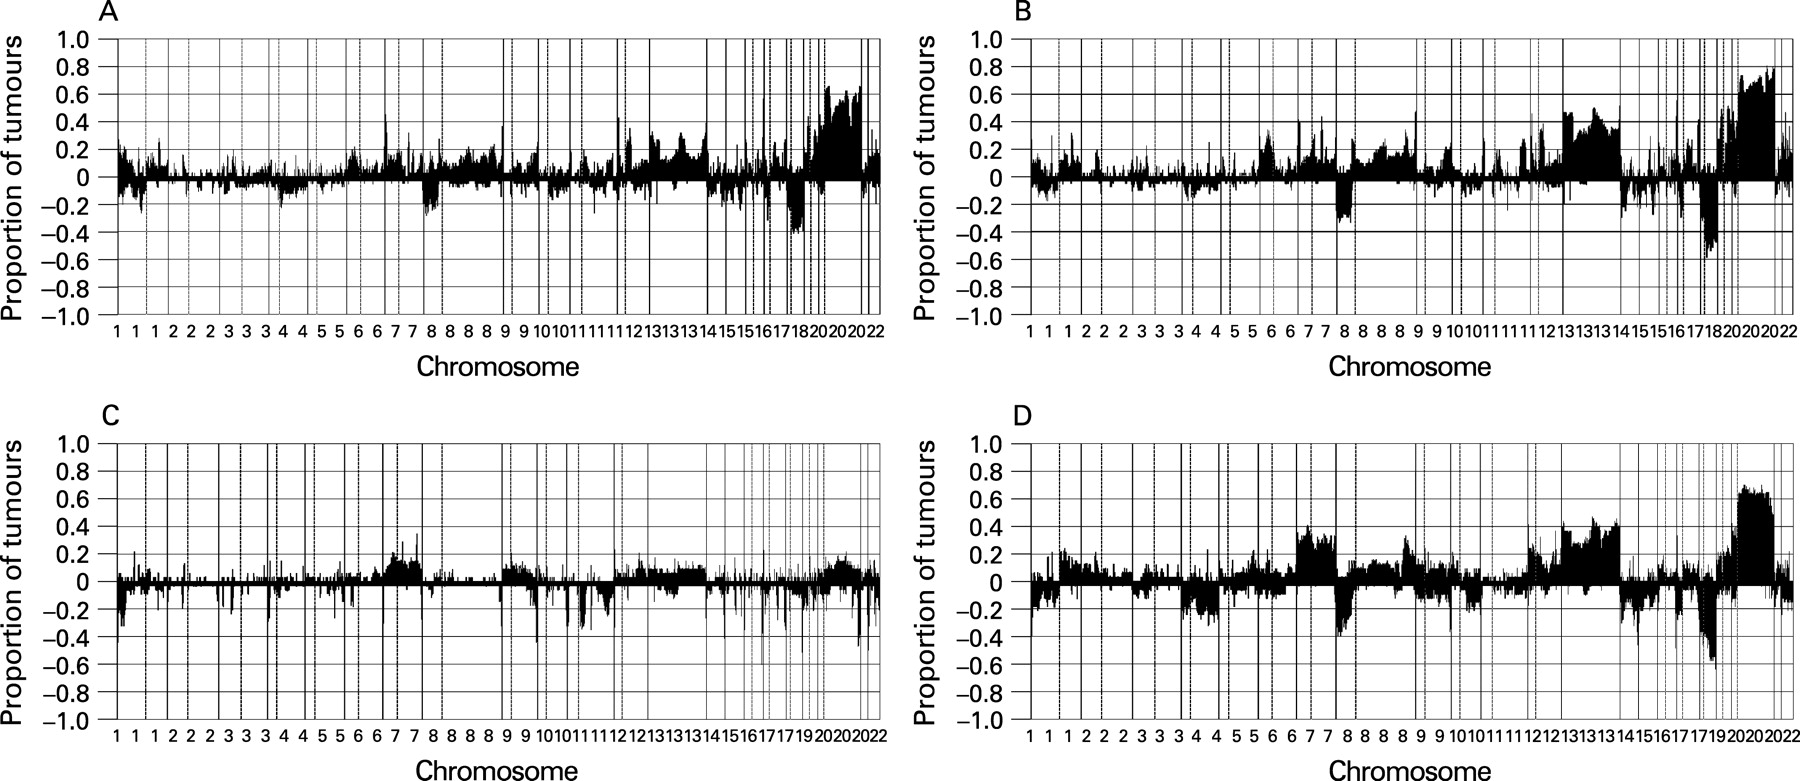
Next, we analysed the DNA copy number status of 37 non-progressed adenomas and 36 carcinomas. From these 73 tumours, 67 (34 adenomas and 33 carcinomas) showed high quality genomic profiles with MAD values <0.2, giving an 8% drop-out. In these 67 tumours, chromosome 20 gain occurred in <15% of the adenomas but in >60% of the carcinomas (p <0.001, as determined by CGHMultiArray), mostly affecting either all of chromosome 20 or the q-arm only, similar to the progressed adenomas (fig 1C,D; Supplementary fig 1B).
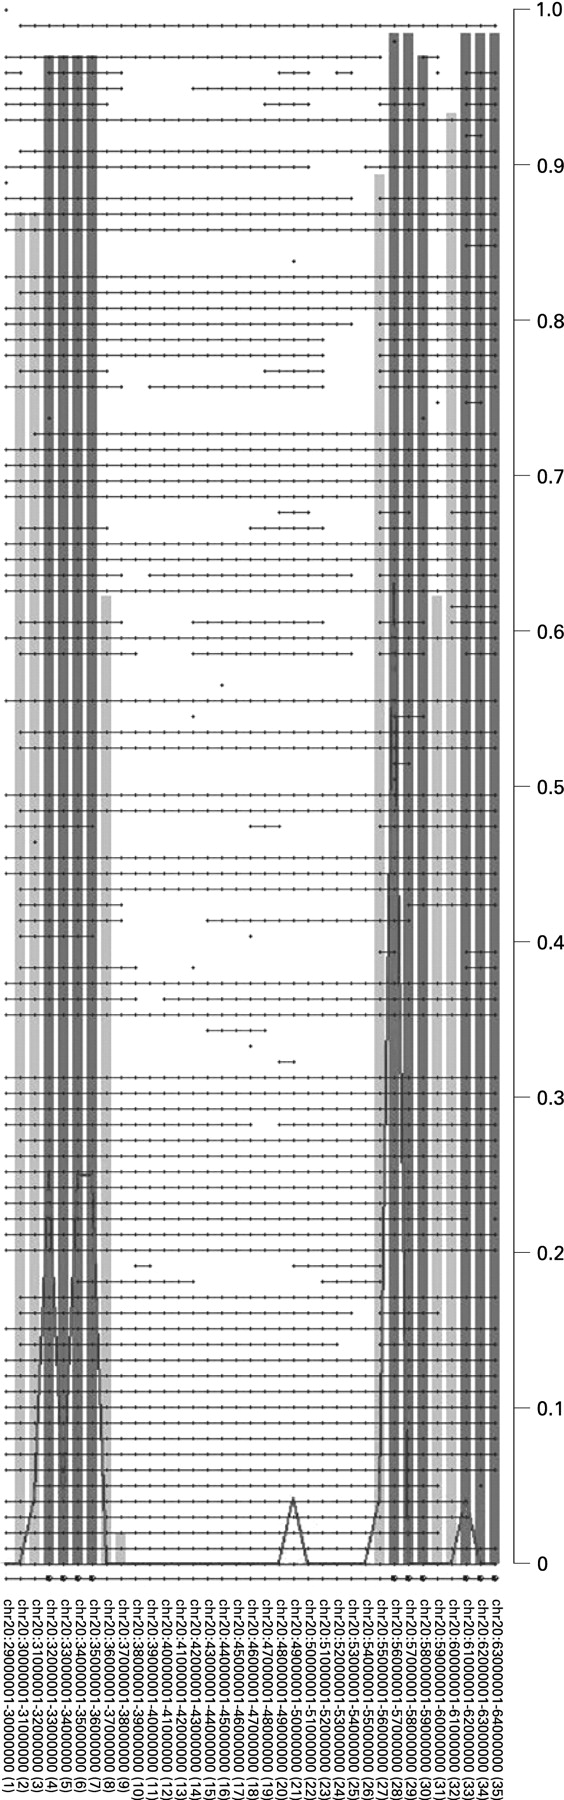
To determine the most relevant regions within 20q harbouring putative oncogenes with a role in colorectal adenoma to carcinoma progression, STAC32 was applied to the combined set of paraffin-embedded malignant polyps (n = 41) and frozen carcinomas (n = 33). This revealed three relevant regions of aberrant copy gains on 20q, one spanning 4 Mb (32–36 Mb), one spanning 3 Mb (56–59 Mb) and the third one spanning 2 Mb (61–64 Mb) (fig 2). These three regions (SROs) contained 80, 35 and 94 known genes, respectively.
Identification of differentially expressed genes
We performed microarray expression analysis on the 37 non-progressed adenomas and 36 carcinomas for which snap-frozen material was available. High quality expression array data were obtained from 68 cases (37 adenomas and 31 carcinomas, 7% drop-out).
Supervised data analysis for identifying putative oncogenes on 20q was done in two different ways: we compared carcinomas with adenomas, and we compared tumours with 20q gain with tumours without 20q gain. The first approach revealed genome-wide 122 upregulated genes and 219 downregulated genes (a total of 341 differentially expressed genes) in carcinomas when compared with adenomas (Wilcoxon test p value <1e-5 (FDR<0.05) and Thas p value <0.05). Of these 122 upregulated genes, 14 map at chromosome 20q (table 1). For the second approach, only tumours (adenomas and carcinomas) that had both array CGH data and expression data available (n = 64) were included. As a preselection, we used genes differentially expressed (both upregulated and downregulated) between carcinomas and adenomas, as we focus on genes at 20q that are involved in progression, using a less stringent cut-off (Thas p value <0.05). Thereby, we identified 127 genes genome-wide out of 931 differentially expressed genes (regression analysis; FDR ⩽0.1) whose expression levels are influenced by the occurrence of 20q gain. Of these 127 genes, 21 are mapped at 20q (table 2).
Nine genes common to these two approaches emerged, namely TPX2, C20orf24, AURKA, RNPC1, TH1L, ADRM1, C20orf20, TCFL5 and C20orf11.
Integration of array CGH and expression data
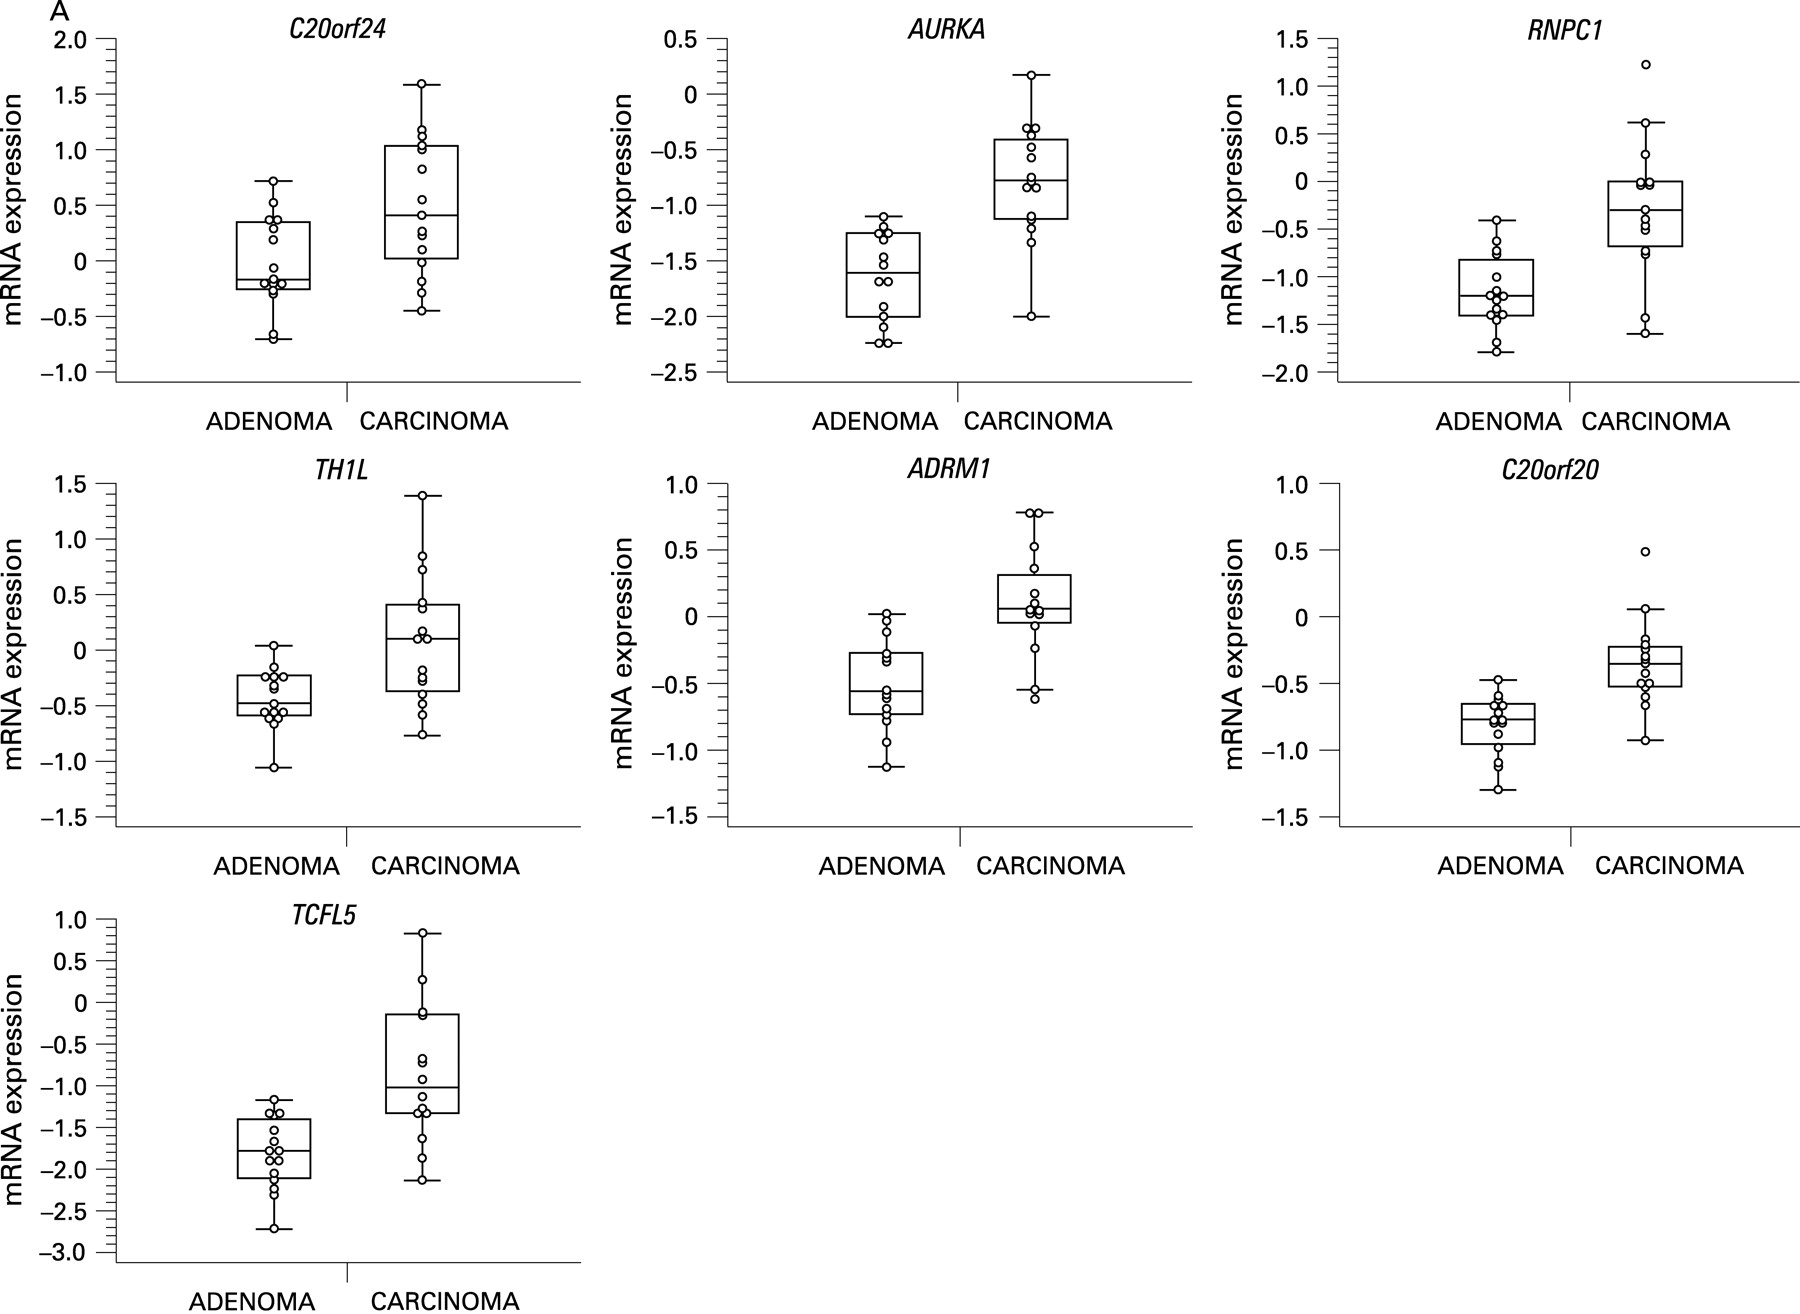
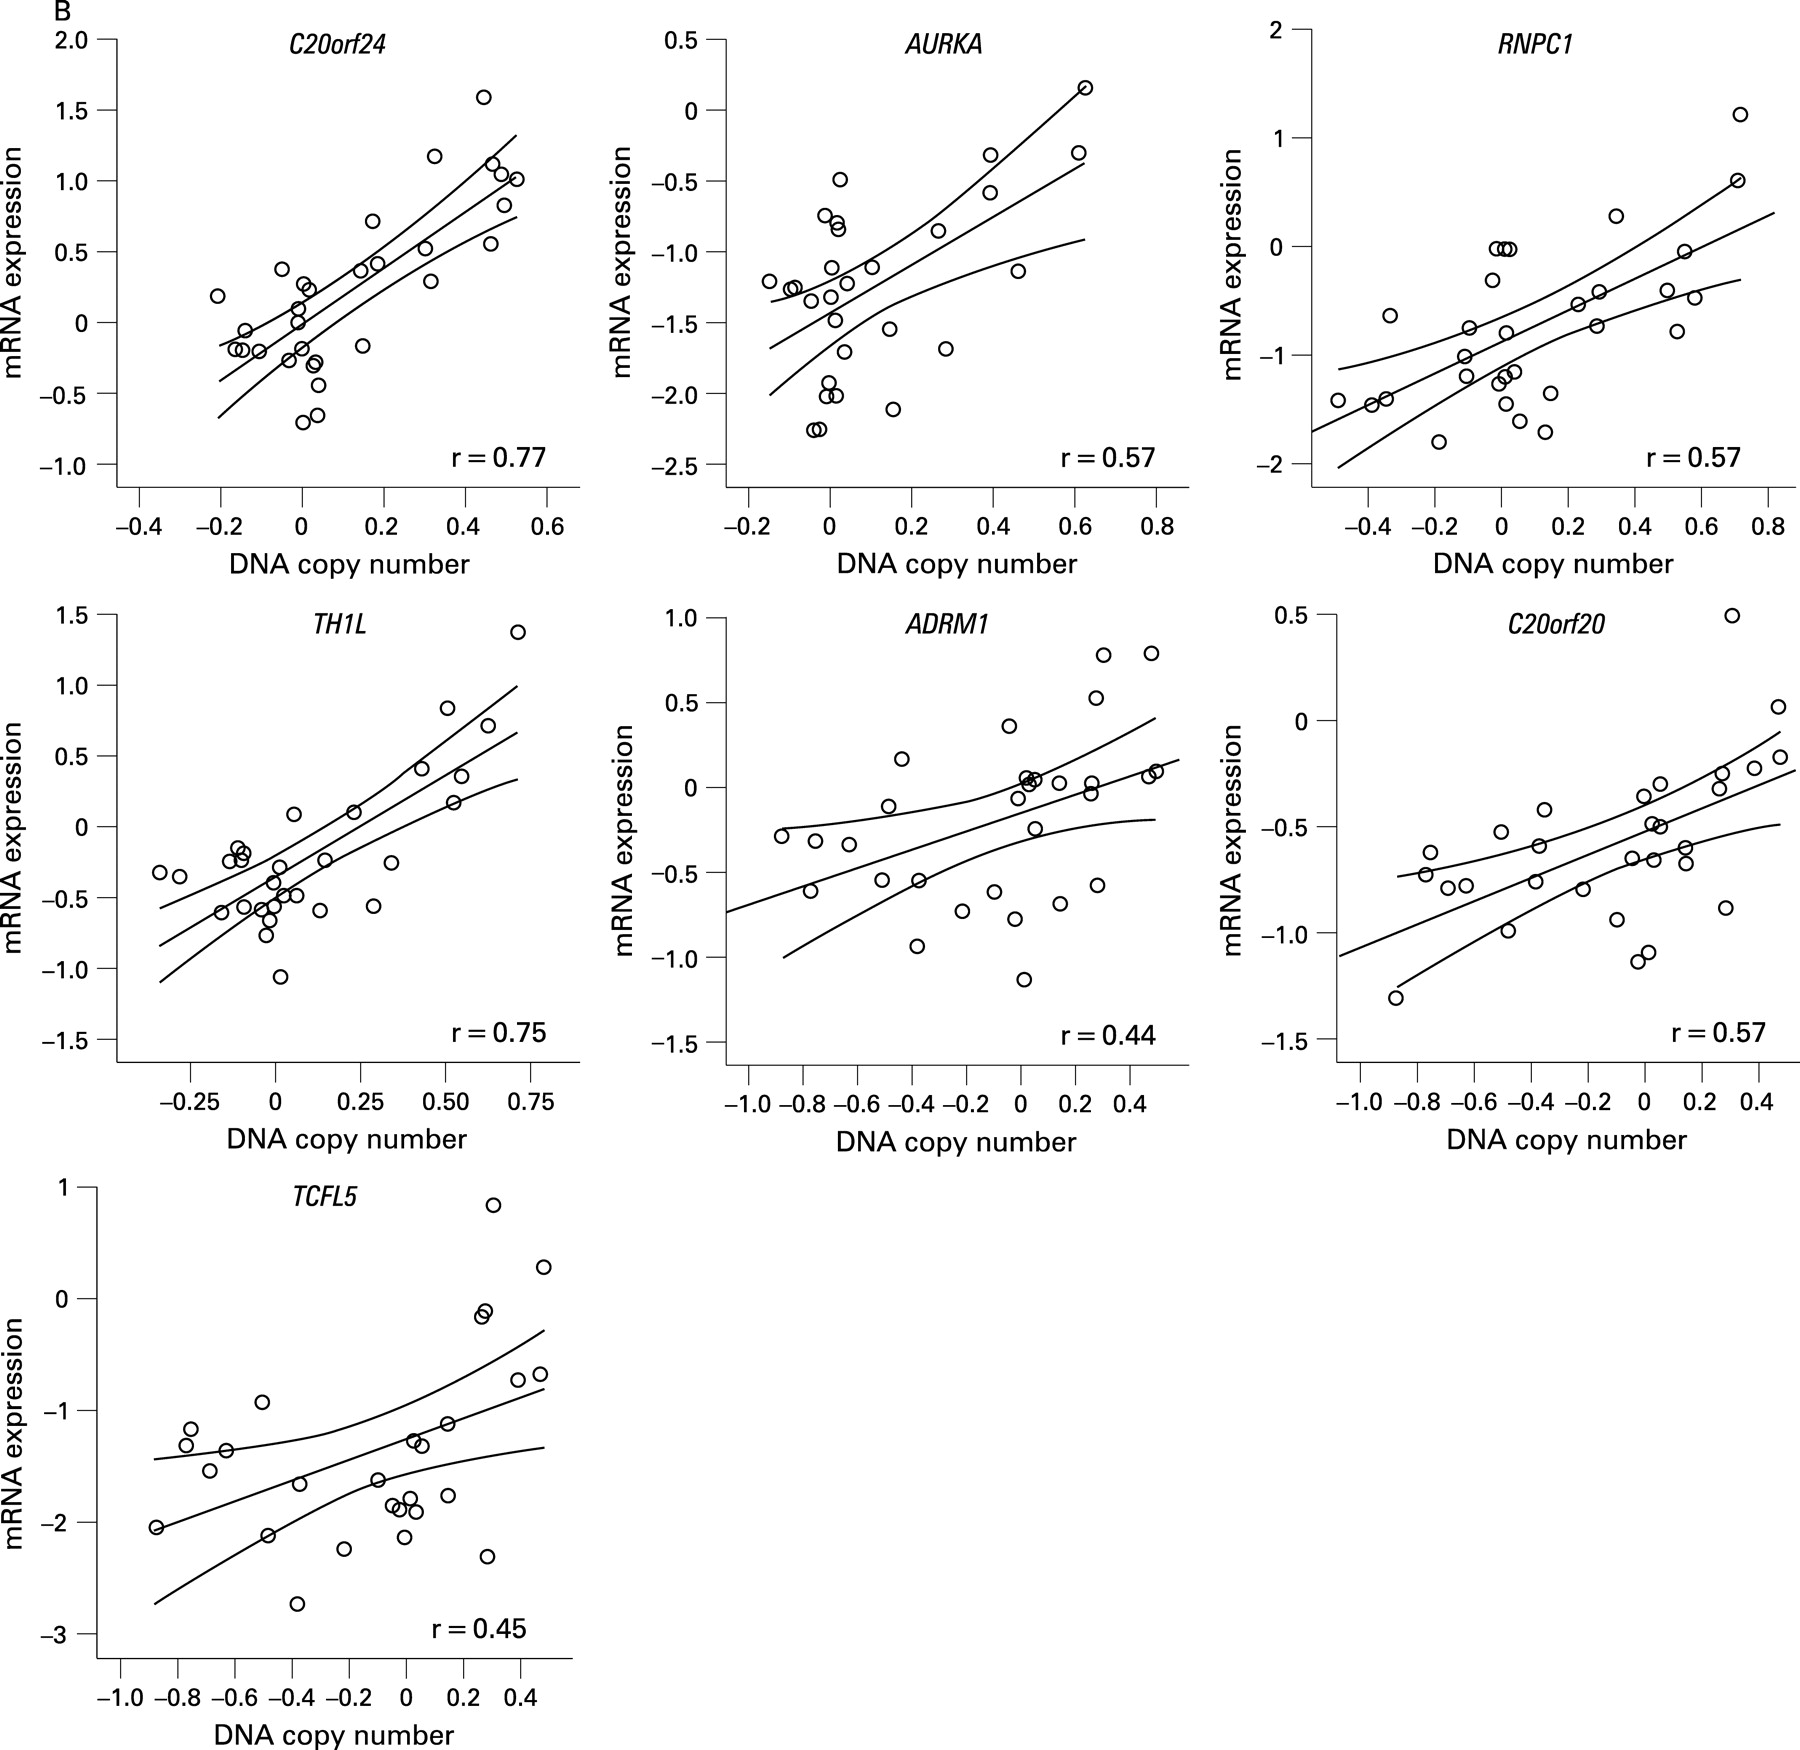
BAC array CGH data were related to oligonucleotide expression array data, independently of adenoma or carcinoma status, using a dedicated integration tool called ACEit.33 We obtained a list of 151 genes located at chromosome 20 for which gene dosage affected expression levels (FDR ⩽0.1), 120 of which are on the q-arm (Supplementary table 2). Combining this information with the results of the two supervised approaches for expression data analysis (carcinoma vs adenoma and 20q gain vs no 20q gain), seven genes were shared (fig 3). For these genes, C20orf24, AURKA, RNPC1, TH1L, ADMR1, C20orf20 and TCFL5, combined box plots with dot plots of mRNA expression in adenomas versus carcinomas (fig 4A) and scatter plots of mRNA expression versus DNA copy number ratio (fig 4B) are shown.


Of these seven candidate genes, six map within the SROs determined by STAC analysis. The seventh gene (AURKA) maps approximately 400 kb proximal to SRO2 at 55.6 Mb (20q13.31). C20orf24 maps within SRO1 at 35.9 Mb (20q11.23), RNPC1 and TH1L map within SRO2 at position 56.7 and 58.3 Mb, respectively (20q13.32), and ADMR1, C20orf20 and TCFL5 map within SRO3, the first at 61.6 Mb and the other two at 62.2 Mb (20q13.33).
Stepwise linear discriminant analysis with leave one out cross-validation showed that mRNA expression levels of two out of the seven candidate genes—that is, RNPC1 and TCFL5—allowed 88.2% of the cases (60/68) to be correctly classified as adenomas or carcinomas (fig 5 and table 3).

Confirmation of differential expression by qRT-PCR and immunohistochemistry
qRT-PCR was performed on a subsample (n = 30) of frozen tumours (15 adenomas and 15 carcinomas) to confirm the expression levels of six of the seven genes identified.
Carcinomas showed higher expression of all six genes compared with adenomas, and tumours with 20q gain (4 adenomas and 8 carcinomas) showed higher expression compared with tumours without 20q gain (11 adenomas and 7 carcinomas). Table 4 shows the fold changes observed between either carcinomas and adenomas or tumours with 20q gain vs tumours without 20q gain, by microarrays and by qRT-PCR.
In situ confirmation of AURKA protein expression by immunohistochemistry on TMAs yielded higher expression of AURKA in carcinomas compared with adenomas (p = 0.01) (table 5) as well as a significant positive correlation with the mRNA expression levels (p = 0.01) (fig 6). Validation of other genes was hampered by the absence of adequate antibodies.

DISCUSSION
One of the most frequent chromosomal aberrations observed in CRC is gain of the long arm of chromosome 20. Nonetheless, which of the many genes mapping at 20q show altered expression due to DNA copy number alterations and play a role in the progression of colorectal adenoma to carcinoma is not yet fully understood. In order to try to identify these putative oncogenes, we analysed a series of colorectal tumours, both adenomas and carcinomas, at the DNA and RNA level.
In this study, we confirmed that chromosome 20 was the most frequently altered in the progressed adenomas and carcinomas (in >60% of cases). In non-progressed adenomas, gains of 20q were detected in <20%, supporting a role for 20q gain in colorectal adenoma to carcinoma progression consistent with earlier observations.7 Narrowing down the gained region by array CGH across all tumours analysed yielded three SROs: SRO1 at 20q11.22–q11.23 (32–36 Mb), SRO2 at 20q13.32–q13.33 (56–59 Mb) and SRO3 at 20q13.33 (61–64 Mb). Douglas and collaborators,12 in a series of 48 cell lines and 37 primary CRCs, defined 20q13.3 as the most common region of gain by array CGH (at 62.3 Mb), which is included in SRO3. Moreover, Nakao and collaborators,13 also by array CGH in a panel of 125 primary CRCs, observed like us more than one prominent region of gain on 20q, centring at 32.3, 37.8, 45.4, 54.7, 59.4 and 65 Mb (according to the August 2001 freeze of the human genome). Based on these array CGH data, the previous studies listed several candidate oncogenes located at these genomic regions, such as AIB4 (35 Mb), ZNF217 (53.9 Mb), CYP24 (54.5 Mb) and AURKA (56.6 Mb), and at 62.3 Mb the genes LIVIN, PTK6, HD54 and EEF1A2. In the present study, the defined regions SRO1, 2 and 3 harbour 80, 35 and 94 genes, respectively, including AURKA, PTK6 and EEF1A2. Altogether, based on copy number alterations alone, the number of genes is still too high (209 genes, in total) really to pinpoint the genes that play a role in the progression of colorectal adenoma to carcinoma.
Comparison of the expression of carcinomas relative to adenomas using strict statistical parameters showed that 14 genes mapping at 20q were overexpressed in carcinomas as compared with adenomas. Most of these genes were not described in previous expression microarray studies comparing adenomas with carcinomas.36 37 These studies used either Affymetrix arrays representing 6600 genes or cDNA microarrays representing 23 000 genes as opposed to the 28 830 represented on our oligonucleotides arrays. In addition, the number of samples analysed in the present study is considerably higher, with 4–10 times more adenomas and 2–3 times more carcinomas. In combination with our multiangle, integrative data analysis, the power of the present study thus is higher. Two genes that have been described as being overexpressed in colon tumours, compared with normal mucosa, are ADRM1 and TOMM34.38 Moreover, cDNA expression analysis in a series of clinical samples of CRC patients showed frequent upregulation of TOMM34 in carcinomas, and inhibition of this gene by small interfering RNA (siRNA) in the HCT116 colon cancer cell line drastically reduced the cell growth.39 Together, these findings corroborate our results since ADRM1 and TOMM34 are on the list of genes that were shown to be upregulated in carcinomas (compared with adenomas) (table 1). This lends support to the approach of the present study, and suggests also that the other candidates identified might be relevant.
Looking at the same expression data from a different angle—that is, comparing the expression of tumours with and without 20q gain—we aimed to find genes with a dosage effect on expression. Genome-wide, expression of 127 out of 931 genes was related to 20q gain, 21 of which are located at chromosome 20q itself. Although chromosome 20 has a high gene density, and copy number gains of the long arm are very frequent, certainly not all genes mapping at the gained regions are recurrently overexpressed. A total of 209 genes are mapped to the SROs defined here, but only 21 genes are recurrently upregulated in association with 20q gain, consistent with earlier observations.40 41
Nine genes overlapped between the 14 adenoma versus carcinoma genes and the 21 genes associated or not with 20q gain, namely TPX2, C20orf24, AURKA, RNPC1, TH1L, ADRM1, C20orf20, TCFL5 and C20orf11.
TPX2 and AURKA, differentially expressed between carcinomas and adenomas and associated with 20q gain, are known to be related to aneuploidy and interact with each other.42 Moreover, in a microarray-based CIN gene signature, TPX2 ranked first.43 This finding supports the hypothesis that chromosome 20q gain has an important role in colorectal adenoma to carcinoma progression, and that the onset of manifest CIN is instrumental.
Our third approach, integration of DNA copy number changes and gene expression, demonstrated that throughout the genome 507 genes showed a statistically significant association between DNA copy number and mRNA expression status, for both amplified/upregulated and deleted/downregulated genes, 120 of these being located on chromosome 20q. Some well-known genes, such as ZNF217 and CSE1L, previously reported to be amplified in colon cancer,44–46 showed relatively higher expression when there was allelic gain. From these 120 genes, 17 overlapped with the 20q gain-associated list, and 11 overlapped with the adenoma and carcinoma versus carcinoma list. Overlapping these three approaches (expression in adenomas vs carcinomas, expression with no 20q gain vs with 20q gain, and genome-wide expression vs whole-genome copy number changes) showed that seven genes are consistently significant (fig 3), namely C20orf24, AURKA, RNPC1, TH1L, ADRM1, C20orf20 and TCFL5. In addition to the already stringent data analysis, a permutation analysis was performed, comparing the differential expression of the seven 20q genes with the expression of >50 000 random subsets out of 7946 genes in silent DNA regions (2q, 3, 5,10p, 11, 16, 21 and 22). For each random subset, the Wilcoxon scores of the seven most differentially expressed (adenoma vs carcinoma) genes were selected. The seven genes on 20q showed a significantly higher expression in adenocarcinomas versus adenomas compared with the best performing combination from the permutation test (p = 0.001), underlining that the copy number-based discovery of putative oncogenes did not yield random differentially expressed genes. The fact these overexpressed putative oncogenes on 20q actually resulted in biologically active components (ie, proteins) in the tumour cells was demonstrated by immunohistochemistry on TMA for AURKA. For the other candidates, antibodies did not perform adequately in the tissue samples or were not available at all.
Little is known about the function of most of these genes. Some are transcription factors, like TCFL5,47 or otherwise involved in transcriptional regulation, like C20orf20.48 The product of TH1L is involved in regulation of A-Raf kinase.49 ADRM1 encodes a putative cell adhesion molecule that recently was shown to be a component of the 26S proteosome.50 The product of RNPC1 is predicted to bind to RNA, based on sequence motifs, and C20orf24 interacts with Rab-5, although its precise function is still unknown. AURKA has been well characterized and is involved in cell cycle regulation. It has been shown to be amplified in CRC51 and its overexpression induces centrosome amplification, aneuploidy and transformation in vitro.52 Moreover, inhibiting AURKA by RNA interference led to growth suppression of human pancreatic cancer cells.53 Knocking down TCFL5 resulted in suppression of the number of multicellular HT29 tumour spheroids, supporting its role in cancer development.54
In summary, we demonstrated the involvement of three SROs in the 20q amplicon in CRC and showed strong DNA copy number–mRNA expression associations for seven genes in these areas. In addition we demonstrated significant differences between colorectal adenomas and carcinomas at the DNA, mRNA and, for one of the genes, the protein level, supporting an important role as oncogenes in colorectal adenoma to carcinoma progression. Furthermore, we showed that expression levels of two out of the seven genes allowed adenomas to be discriminated from carcinomas with high accuracy. These genes therefore may serve both as highly specific biomarkers for CRC and as possible targets for pharmaceutical intervention in the development of CRC.
Acknowledgments
We thank the mapping core and map finishing groups of the Wellcome Trust Sanger Institute for initial BAC clone supply and verification. We would like to thank Anders Svensson for handling the array CGH database, Wessel van Wieringen for supervising the use of the software tool ACEit, Marianne Tijssen and Sjoerd J Vosse for helping with formatting all the raw data into the MIAME format, and Meike de Wit and Pien van Diemen for helping in the immunohistochemistry analysis.
REFERENCES
Supplementary materials
web only appendix 58/1/79
Files in this Data Supplement:
Footnotes
▸ Additional tables and a figure are published online only at http://gut.bmj.com/content/vol58/issue1
Funding: This study was financially supported by the Dutch Cancer Society (KWF2002-2618).
Competing interests: None.