Article Text

Abstract
Objective To evaluate the potential for diagnosing colorectal cancer (CRC) from faecal metagenomes.
Design We performed metagenome-wide association studies on faecal samples from 74 patients with CRC and 54 controls from China, and validated the results in 16 patients and 24 controls from Denmark. We further validated the biomarkers in two published cohorts from France and Austria. Finally, we employed targeted quantitative PCR (qPCR) assays to evaluate diagnostic potential of selected biomarkers in an independent Chinese cohort of 47 patients and 109 controls.
Results Besides confirming known associations of Fusobacterium nucleatum and Peptostreptococcus stomatis with CRC, we found significant associations with several species, including Parvimonas micra and Solobacterium moorei. We identified 20 microbial gene markers that differentiated CRC and control microbiomes, and validated 4 markers in the Danish cohort. In the French and Austrian cohorts, these four genes distinguished CRC metagenomes from controls with areas under the receiver-operating curve (AUC) of 0.72 and 0.77, respectively. qPCR measurements of two of these genes accurately classified patients with CRC in the independent Chinese cohort with AUC=0.84 and OR of 23. These genes were enriched in early-stage (I–II) patient microbiomes, highlighting the potential for using faecal metagenomic biomarkers for early diagnosis of CRC.
Conclusions We present the first metagenomic profiling study of CRC faecal microbiomes to discover and validate microbial biomarkers in ethnically different cohorts, and to independently validate selected biomarkers using an affordable clinically relevant technology. Our study thus takes a step further towards affordable non-invasive early diagnostic biomarkers for CRC from faecal samples.
- BACTERIAL INTERACTIONS
- COLONIC MICROFLORA
- COLORECTAL CANCER
Statistics from Altmetric.com
Significance of this study
What is already known on this subject?
Changes in the gut microbial composition are associated with colorectal cancer (CRC), but causality is yet to be established.
Fusobacterium nucleatum potentiates intestinal tumorigenesis through recruitment of infiltrating immune cells and via activation of β-catenin signalling.
Faecal microbiota holds promise for early non-invasive diagnosis of CRC.
However, a simple and affordable targeted approach to diagnosing CRC from faecal samples is still lacking.
What are the new findings?
Discovery of significant enrichment of novel species, including Parvimonas micra and Solobacterium moorei, and a strong co-occurrence network between them in the faecal microbiomes of patients with CRC.
Identification of 20 gene markers that significantly differentiate CRC-associated and control microbiomes in a Chinese cohort, and trans-continental validation of four of them in a Danish cohort.
Further validation of the four gene markers in published cohorts from the French and Austrian cohorts with areas under the receiver-operating curve (AUC) of 0.72 and 0.77.
Quantitative PCR abundance of two gene markers (butyryl-CoA dehydrogenase from F. nucleatum, and RNA polymerase subunit β, rpoB, from P. micra) clearly separates CRC microbiomes from controls in an independent Chinese cohort consisting of 47 cases and 109 healthy controls, with AUC=0.84 and odds ratio of 23.
How might it impact on clinical practice in the foreseeable future?
The four microbial gene markers shared between the Chinese, Danish, Austrian and French cohorts suggest that even though different populations may have different gut microbial community structures, signatures of CRC-associated microbial dysbiosis could have universal features.
Our study takes a step further towards affordable early diagnosis of CRC by targeted analysis of metagenomic biomarkers in faecal samples.
Introduction
Colorectal cancer (CRC), the third most common cancer in the world affecting >1.36 million people every year,1 arises due to complex interactions between genetic, lifestyle and environmental factors. Despite massive efforts in whole-genome sequencing and genome-wide association studies, genetic factors only explain a small proportion of disease variance2—heritability may account for up to 35% all CRCs,3 but only about 5% of cancers occur in the setting of a known genetic predisposition syndrome.4 These findings support lifestyle and environment as additional major disease determinants.
Emerging evidence indicates that microbial dysbiosis in the human gut may be an important environmental factor in CRC. Early evidence for gut microbial contribution to CRC pathogenesis came from Apcmin/+ mice, a genetic mouse model of CRC, where mice housed in germ-free conditions showed a reduction of tumour formation in the intestine compared with mice housed in specific pathogen-free conditions.5 Further studies have suggested that several bacteria, including Bacteroides fragilis and a strain of Escherichia coli, may promote colorectal carcinogenesis.6–11 In humans, bacterial culture-based studies have reported associations between CRC and clinical infections by specific bacteria such as Streptococcus bovis12 and Clostridium septicum.13 Additionally, culture-free 16S ribosomal RNA sequencing studies have associated faecal microbial composition with CRC.14–16 Independent studies have identified Fusobacterium nucleatum to be more abundant in human CRC tissues,17 ,18 and follow-up studies showed that F. nucleatum potentiates intestinal tumorigenesis through recruitment of infiltrating immune cells19 and by modulating β-catenin signalling.20 Two recent studies investigated gut microbial dysbiosis in patients with CRC21 ,22 and reported diagnostic potential using metagenomic sequencing. These promising results are still far from directly translating to diagnostic tests for CRC, as a simple and affordable targeted approach to diagnosing CRC from faecal samples is still lacking.
Here we present the first study that (i) uses deep metagenomic profiling of CRC faecal microbiomes to discover and validate microbial gene biomarkers in ethnically different cohorts, and (ii) independently validates them using an affordable technology that can translate to clinical practice.
Materials and methods
Sample collection and DNA preparation
Cohorts C1 and C2 were from Hong Kong, China. C1 (see online supplementary table S1) comprised 128 individuals: 74 patients with CRC (15 stage I, 21 stage II, 34 stage III and 4 stage IV; median age 67 years; 26 were females) and 54 controls (median age 62 years; 21 were females). C2 (see online supplementary table S16) comprised 156 individuals: 47 patients with CRC (4 stage I, 24 stage II, 15 stage III and 4 stage IV; median age 69 years; 22 were females) and 109 controls (median age 58 years; 69 were females). Cohort D from Copenhagen, Denmark (see online supplementary table S18), comprised 40 individuals: patients with CRC (n=16; 1 stage I, 9 stage II, 5 stage III and 1 stage IV; median age 67.5 years; 6 were females) and controls (n=24; median age 65.5 years; 17 were females). Cancer staging in all three cohorts was performed using the tumour, node, metastasis staging system23 maintained by the American Joint Committee on Cancer and the International Union for Cancer Control. Stool samples were collected by individuals at home, followed by immediate freezing at −20°C. DNA from Chinese samples was extracted using Qiagen QIAamp DNA Stool Mini Kit (Qiagen) according to manufacturer's instructions. DNA from Danish samples was extracted using previously published method.24 For comprehensive description of sample collection and DNA extraction as well as ethical committee approval numbers, see online supplementary methods.
Metagenomic sequencing and annotation
Metagenomic sequencing using Illumina HiSeq 2000 platform, generating gene profiles using gene catalogue, constructing metagenomic linkage groups (MLGs), generating Kyoto Encyclopedia of Genes and Genomes (KEGG) ortholog, module and pathway profiles, were all done using previously published methods.25 Species-level molecular operational taxonomic units (mOTUs) were obtained using mOTU profiling software.26 Reads were mapped to the Integrated Microbial Genome (IMG) reference database27 (v400) to generate IMG species and IMG genus profiles. Genes of MLGs were mapped to the IMG database, and MLGs were annotated to an IMG genome when >50% of genes were mapped. MLG species were constructed by grouping MLGs using this annotation. For comprehensive description of these procedures, see online supplementary methods.
Data analysis
Permutational multivariate analysis of variance (PERMANOVA) was used to assess effects of different phenotypes on gene profiles. Enrichments of genes, KEGG features, mOTUs, IMG species and MLG species were calculated using Wilcoxon rank-sum tests. When appropriate, we adjusted for confounding effects of sample collection before/after colonoscopy: Wilcoxon rank-sum tests were performed using ‘colonoscopy before/after sampling’ as a stratifying factor using COIN package in R, and ORs were estimated using Mantel–Haenszel test after stratifying by ‘colonoscopy before/after sampling’. We controlled for multiple testing with Benjamini–Hochberg false discovery rate (FDR). Minimum-redundancy maximum-relevancy (mRMR) feature selection method28 was used to select optimal gene markers, which were then used in constructing a CRC index. Co-occurrence networks were constructed using Spearman's correlation coefficient (>0.5 or <−0.5) and visualised in Cytoscape V.3.0.2. Metagenomic sequences from French (F) and Austrian (A) cohorts were downloaded from NCBI Short Read Archive using study identifiers ERP005534 and ERP008729, respectively. For comprehensive description of biodiversity analysis, rarefaction analysis, identification of CRC-associated genes/species, estimation of FDR, mRMR feature selection framework, definition and validation of CRC index, and receiver operator characteristic (ROC) analysis, see online supplementary methods.
Validation of gene markers by qPCR
Abundances of selected gene markers were estimated in stool samples using TaqMan probe-based quantitative PCR (qPCR). Primer and probe sequences were designed manually and then tested using Primer Express V.3.0 (Applied Biosystems, Foster City, California, USA) for determination of Tm, guanine-cytosine (GC) content and possible secondary structures. Each probe carried a 5′ reporter dye 6-carboxy fluorescein or 4,7,2′-trichloro-7′-phenyl-6-carboxyfluorescein and a 3′ quencher dye 6-carboxytetramethyl-rhodamine. Primers and hydrolysis probes were synthesised by Invitrogen (Carlsbad, California, USA). Nucleotide sequences of primers and probes are listed in online supplementary table S27. qPCR was performed on an ABI7500 Real-Time PCR System using TaqMan Universal PCR Master Mixreagent (Applied Biosystems). Universal 16S rDNA was used as internal control and abundance of gene markers were expressed as relative levels to 16S rDNA.
Results
Dysbiosis in CRC gut microbiome
We recruited 128 individuals (74 patients with CRC and 54 control subjects) from China (cohort C1; see online supplementary table S1), performed metagenomic sequencing on their stool samples and generated 751 million metagenomic reads (5.86 million reads per individual on average; see online supplementary table S2) using Illumina HiSeq 2000 platform. Among the recorded metabolic parameters, elevated fasting blood glucose and reduced high-density lipoproteins showed significant associations with CRC status (Wilcoxon rank-sum test, q=0.0014 for both) agreeing with previous findings reporting them as risk factors.29 ,30 We also observed that a significantly higher number of CRC patient samples were collected after colonoscopy than before (Fisher's exact test, q=0.0165; see online supplementary table S1). We adjusted for this as a confounding factor in subsequent analyses when appropriate (see section ‘Materials and methods’). Rarefaction analysis using a previously published gut microbial gene catalogue consisting of 4 267 985 genes25 showed a curve reaching plateau, suggesting that this catalogue covers most prevalent microbial genes present in cohort C1 (see online supplementary figure s1A). Therefore, we based subsequent analyses on mapping the metagenomic reads to this catalogue. CRC patient microbiomes exhibited reduced gene richness (see online supplementary figure 1A, B; Wilcoxon rank-sum test, p<0.01) and gene alpha diversity (Wilcoxon rank-sum tests on Shannon and Simpson indices: p=0.075 and 0.028, respectively; see online supplementary figure S1C,D and table S3). However, these differences exhibited p>0.5 after correcting for colonoscopy.
To ensure robust comparison of gene content among 128 metagenomes from cohort C1, we created a set of 2 110 489 genes that were present in at least 6 subjects and generated 128 gene abundance profiles using these 2.1 million genes. When we performed multivariate analysis using PERMANOVA on 17 different covariates, only CRC status and CRC stage were significantly associated with these gene profiles (q<0.06, all other factors: q>0.27; see online supplementary table S4). Thus, the data suggest an altered gene composition in CRC patient microbiomes that cannot be explained by other recorded factors. When we performed a principal component analysis (PCA) based on gene profiles, the first and fifth principal components, which explained 6.6% and 3.2% of total variance, respectively, were associated with CRC status (Wilcoxon rank-sum test, PC1: p=0.029; PC5: p=1×10⁻⁶; see online supplementary figure S2 and table S5). Together, these results suggest a state of dysbiosis of the gut microbiome in patients with CRC.
Gut microbial genes associated with CRC
We performed a metagenome-wide association study (MGWAS) to identify genes contributing to the altered gene composition in CRC. From 2.1 million genes, we identified 140 455 genes that were associated with disease status (Wilcoxon rank-sum test p<0.01 and FDR 11.03%; see online supplementary figure S3). Interestingly, CRC-enriched genes occurred less frequently and at lower abundance compared with control-enriched genes (see online supplementary figure S4), suggesting that microbial dysbiosis associated with CRC may not involve dominant species. Such patterns of frequency and occurrence have been observed in two earlier metagenomic case–control studies on type 2 diabetes25 in Chinese individuals and CRC in Austrian individuals,31 suggesting that this may be a common trend in disease-associated gut microbial dysbiosis.
We annotated the 140 455 genes using KEGG32 functional database (V.59) to investigate whether certain microbial functions were associated with CRC. None of the KEGG pathways passed our stringent criteria (Wilcoxon rank-sum test, q<0.05; see online supplementary table S6), suggesting that bacterial metabolic pathways present in KEGG database may not be involved in CRC pathogenesis. However, two KEGG modules were enriched in CRC microbiomes: leucine degradation (q=0.0148) and guanine nucleotide biosynthesis (q=0.0241; see online supplementary table S6). Leucine stimulates both protein synthesis and degradation,33 ,34 suggesting possible links between leucine metabolism and cancer. At the gene level, several KEGG orthologous groups showed significant associations with disease status (Wilcoxon rank-sum test, q<0.05; see online supplementary table S7).
Taxonomic alterations in CRC gut microbiomes
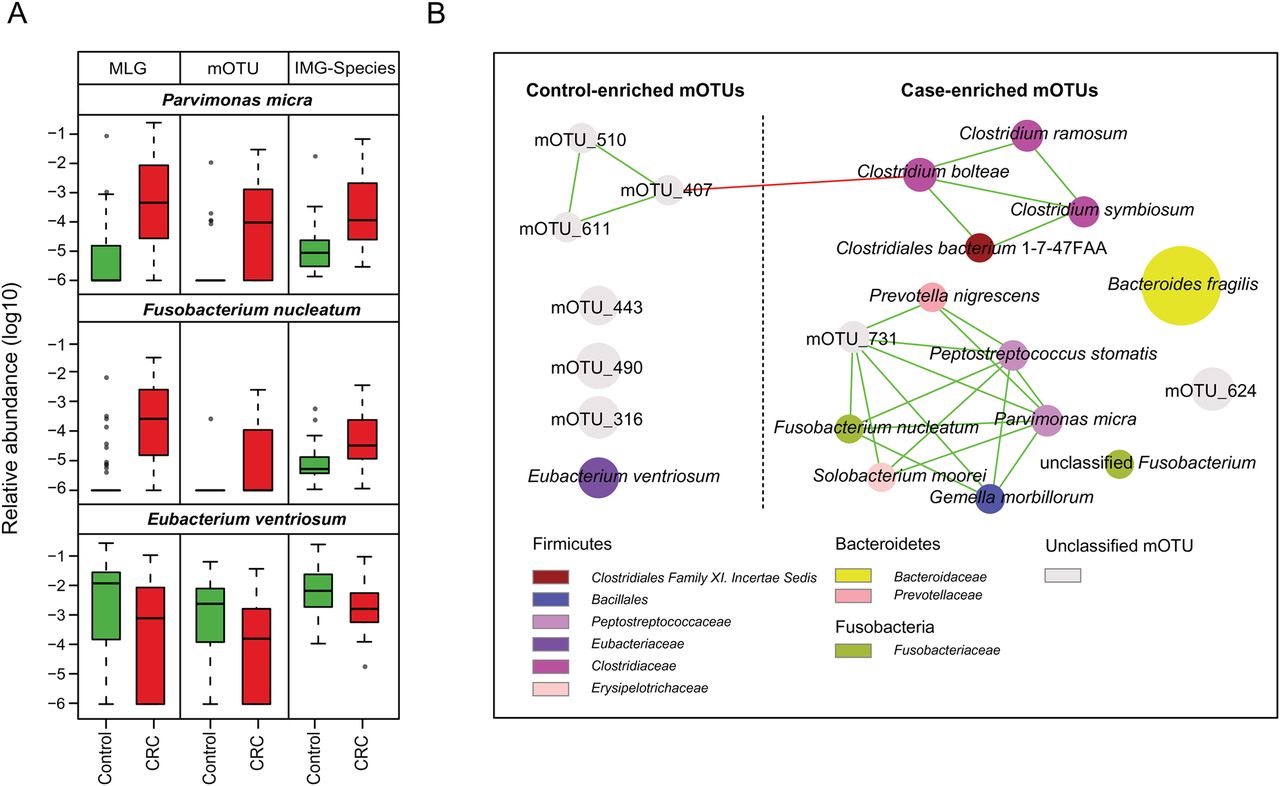
We examined taxonomic differences between CRC-associated and control microbiomes to identify microbial taxa contributing to the dysbiosis. For this, we used species profiles derived from three different methods—IMG species, species-level mOTUs and MLG species (see section ‘Materials and methods’)—as supporting evidence from multiple methods would strengthen an association. Our analysis identified 28 IMG species, 21 mOTUs and 85 MLG species that were significantly associated with CRC status after adjusting for colonoscopy as a confounding factor (Wilcoxon rank-sum test, q<0.05; see online supplementary table S8). Eubacterium ventriosum was consistently enriched in control microbiomes across all three methods (IMG: q=0.002; mOTU: q=0.0049; MLG: q=3.33×10⁻⁴). On the other hand, Parvimonas micra (q<7.73×10⁻⁶), Solobacterium moorei (q<0.011) and F. nucleatum (q<0.00279) were consistently enriched in CRC patient microbiomes across all three methods (figure 1A and online supplementary figure S5), while Peptostreptococcus stomatis (q<7.73×10⁻⁶) was enriched according to two methods. PERMANOVA analysis showed that only CRC status (p≤0.013 from all three methods) and colonoscopy (p=0.079 from two methods) explained the quantitative variation in the three CRC-enriched species. All other non-CRC-specific factors could not explain the variation with statistical significance (p>0.18; see online supplementary table S9). P. stomatis has recently been shown to significantly associate with CRC,22 and S. moorei has previously been associated with bacteraemia.35 However, a highly significant enrichment of P. micra—an obligate anaerobic bacterium that can cause oral infections like F. nucleatum36—in CRC-associated microbiomes is a novel finding.

Species involved in gut microbial dysbiosis associated with colorectal cancer (CRC). (A) Differential relative abundance of two CRC-enriched and one control-enriched microbial species consistently identified using three different methods: metagenomic linkage group (MLG), molecular operational taxonomic unit (mOTU) and Integrated Microbial Genome (IMG) database. (B) A co-occurrence network deduced from relative abundance of 21 mOTUs significantly associated with CRC. Species are rearranged in two sides based on their enrichment in CRC or control microbiomes. Spearman correlation coefficient values below −0.5 (negative correlation) are indicated as red edges, and coefficient values above 0.5 (positive correlation) are indicated as green edges. Node size shows the average relative abundance for each species, and node colour shows their taxonomic annotation.
Species co-occurrence networks derived from pairwise correlations of species abundances showed a strong positive association between three oral pathogens: P. micra, F. nucleatum and S. moorei (figure 1B and online supplementary figure S6). Previous reports suggest that P. micra commonly occurs together with F. nucleatum in infected root canals, where they could account for up to 90% of the endodontic microbiome.36 Given this, our results could suggest cooperation between these two species in CRC-associated gut environment.
Although several bacterial genera corresponding to the CRC-associated species identified earlier (including Parvimonas, Fusobacterium, Solobacterium and Peptostreptococcus) showed significant associations with CRC status (see online supplementary table S10), we observed some exceptions as well. While we identified a significant over-representation of B. fragilis in patients with CRC (mOTU: q=0.0158; MLG: q=3.02×10⁻⁴; see online supplementary table S8), there was no association with Bacteroides genus. At the phylum level, only Fusobacteria and Basidiomycota were significantly enriched in CRC-associated microbiomes (q<0.0002; see online supplementary table S11).
In order to evaluate the predictive power of these taxonomic associations, we used random forest ensemble learning method37 to identify 17 IMG species, 7 species-level mOTUs and 27 MLG species that were highly predictive of CRC status (see online supplementary table S12), with predictive power of 0.86, 0.89 and 0.96 in ROC analysis, respectively (see online supplementary figure S7). P. micra was identified as a key species from all three methods, while F. nucleatum, P. stomatis and S. moorei were identified from two out of three methods, providing further statistical support for their association with CRC status.
CRC biomarker discovery
We used the mRMR feature selection method28 to identify potential CRC biomarkers from the 140 455 genes identified by MGWAS. First, to eliminate confounding effects of colonoscopy, we performed blocked independent Wilcoxon rank-sum tests on these genes with colonoscopy as a stratifying factor. This resulted in 102 514 genes at a significance level of p<0.01 (FDR ≤13%) and 24 960 genes at a significance level of p<0.001 (FDR ≤5.23%). Then, from the latter, we identified groups of genes that were highly correlated with each other (Kendall's τ >0.9) and chose the longest gene in each group to generate a statistically non-redundant set of 11 128 significant genes. Finally, we used mRMR method and identified an optimal set of 20 genes that were strongly associated with CRC status (see online supplementary figure S8 and table S13). PCA using these 20 genes showed good separation of patients with CRC from controls (figure 2A). PERMANOVA analysis showed that only CRC status, stage and fasting blood glucose explained the variation in the 20 marker gene abundances with statistical significance (p≤0.01; see online supplementary table S14). We computed a simple CRC index based on unweighed log relative abundance of these 20 markers, which clearly separated CRC patient microbiomes from control microbiomes, as well as from 490 faecal microbiomes from two previous studies on type 2 diabetes in Chinese individuals25 and IBD in European individuals38 (figure 2B; median CRC index for patients and controls in our study were 7.31 and −5.56, respectively; Wilcoxon rank-sum test, q<6×10⁻¹¹ for all five comparisons; see online supplementary table S15).

Discovering gut microbial gene markers associated with colorectal cancer (CRC). (A) Principal component analysis based on abundances of 20 gene markers separates CRC cases and control individuals in cohort C1. First and second principal components associate with CRC status (PC1 and PC2 explain 31.9% and 13.3% of variance, respectively). Compare this with online supplementary figure S2 based on 2.1 million genes, where no separation can be observed. (B) CRC index computed using a simple unweighed linear combination of log-abundance of 20 gene markers for patients with CRC (red) and control individuals (green) from this study, shown together with patients and control individuals (brown) from earlier studies on type 2 diabetes25 and IBD.38 CRC indices for CRC patient microbiomes are significantly different from the rest (p<0.001), suggesting that the 20 gene markers are CRC-specific. The box depicts the IQRs between the first and third quartiles, and the line inside denotes the median.
Evaluating CRC biomarkers using targeted qPCR
Translating our gene markers into diagnostic biomarkers would require reliable measurement by simple, affordable and targeted methods such as qPCR. To verify whether gene abundances measured by metagenomics sequencing and qPCR are comparable, we randomly selected two case-enriched and two control-enriched gene markers and measured their abundances by qPCR in a subset of cohort C1 (51 cases and 45 controls). Quantification by metagenomic sequencing and qPCR platforms showed strong correlations (Spearman r=0.81–0.95; see online supplementary figure S9), suggesting that both measurements are reliable. Next, we measured the abundance of these four gene markers using qPCR in an independent Chinese cohort C2 (156 faecal samples; 47 cases and 109 controls; see online supplementary table S16). The two control-enriched genes did not show significant associations in C2 (p>0.31; see online supplementary table S17). On the other hand, CRC-enriched gene markers (m1704941, butyryl-CoA dehydrogenase from F. nucleatum; m482585, RNA-directed DNA polymerase from an unknown microbe) were also significantly enriched in CRC samples of C2 after adjusting for colonoscopy (p=0.0015 and 0.045, respectively, see online supplementary table S17). Among these, only the gene from F. nucleatum exhibited a significant OR after a Mantel–Haenszel test adjusted for colonoscopy (OR 18.5, p=0.0051; see online supplementary table S17). CRC index based on abundances of the four genes only moderately classified CRC microbiomes from control microbiomes in C2 (areas under the receiver-operating curve (AUC)=0.73; see online supplementary figure S10), suggesting that choosing randomly from the list of 20 biomarkers was not an effective strategy. Nevertheless, the gene from F. nucleatum was present only in 4 out of 109 control microbiomes, suggesting a potential for developing specific diagnostic tests for CRC using faecal samples.
Gene marker validation in independent metagenomic cohorts
To identify robust biomarkers that can have a more general applicability, we evaluated all 20 gene markers using faecal metagenomes from a cohort with different genetic background and lifestyle: 16 patients with CRC and 24 control individuals from Denmark (cohort D; see online supplementary table S18). When mapped to 4.3 million gut microbial genes, Danish metagenomes exhibited significantly higher gene richness and gene alpha diversity, both in cases (Wilcoxon rank-sum tests, gene count: p=1.94×10⁻⁵; Shannon's index: p=5.85×10⁻⁵) and controls (gene count: p=0.0017; Shannon's index: p=9.34×10⁻⁴; see online supplementary figure S11 and table S19), agreeing with a recent study and suggesting differences in gut microbial community structure between Chinese and Danish populations.39 Among the 102 514 genes associated with CRC status in cohort C1, only 1498 genes could be validated in cohort D. However, CRC-enriched genes were shared significantly more between the two populations than control-enriched genes (1452 out of 35 735 CRC-enriched vs 46 out of 66 779 in control-enriched; two-tailed χ2 test, χ2=2576.57, p<0.0001). Over half (53.6%) of the 1452 CRC-enriched genes were from just three species: P. micra (389 genes), S. moorei (204 genes) and Clostridium symbiosum (177 genes) (see online supplementary table S20). At the species level, P. micra was enriched in CRC microbiomes using all three methods, while P. stomatis, Gemella morbillorum and S. moorei were enriched according to two methods (Wilcoxon rank-sum test, q<0.05; see online supplementary table S21). Notably, all species that were validated by at least one method were CRC-enriched. These results suggest that changes in colorectal environment during CRC development and progression may facilitate growth of similar species across the two populations, potentially leading to the reduced microbial diversity observed in patients with CRC (see online supplementary figure S1C), in line with earlier observations by others.40 CRC index using 20 gene markers discovered in cohort C1 marginally differentiated Danish patient microbiomes from controls (Wilcoxon rank-sum test, p=0.029) and exhibited moderate classification potential (area under ROC curve, AUC=0.71; see online supplementary figure S12). Only 4 out of 20 genes (two from Peptostreptococcus anaerobius and one each from P. micra and F. nucleatum) were associated with CRC status in cohort D (Wilcoxon rank-sum test, q≤0.05; all CRC-enriched; see online supplementary table S22). Among the factors we had recorded, only CRC status could explain the variation in these four genes (PERMANOVA p≤0.0001; see online supplementary table S23).
For additional unbiased validation of the four gene markers, we used two recently published metagenomic datasets—an Austrian population (cohort A) consisting of 55 controls and 41 patients with CRC31 and a French population (cohort F) consisting of 61 controls and 53 patients with CRC.22 As our discovery cohort C1 only included carcinoma samples, we excluded all patients with adenoma and compared carcinoma patients with non-adenoma/non-carcinoma controls, contrary to the strategy used by the latter study22 that included small adenomas in controls and excluded large adenomas. All four genes were significantly enriched in carcinoma faecal samples from both cohorts (Wilcoxon rank-sum test q<0.0035; see online supplementary table S24). CRC index using these four genes classified patients with CRC with AUC of 0.77 and 0.72 for cohorts A and F, respectively. When we checked association of all 20 markers, cohorts A and F each could validate an additional gene associated with CRC (see online supplementary table S25). Interestingly, one marker enriched in control samples in cohort C1 was enriched in CRC samples in cohort A.
Accurate classification of CRC using qPCR
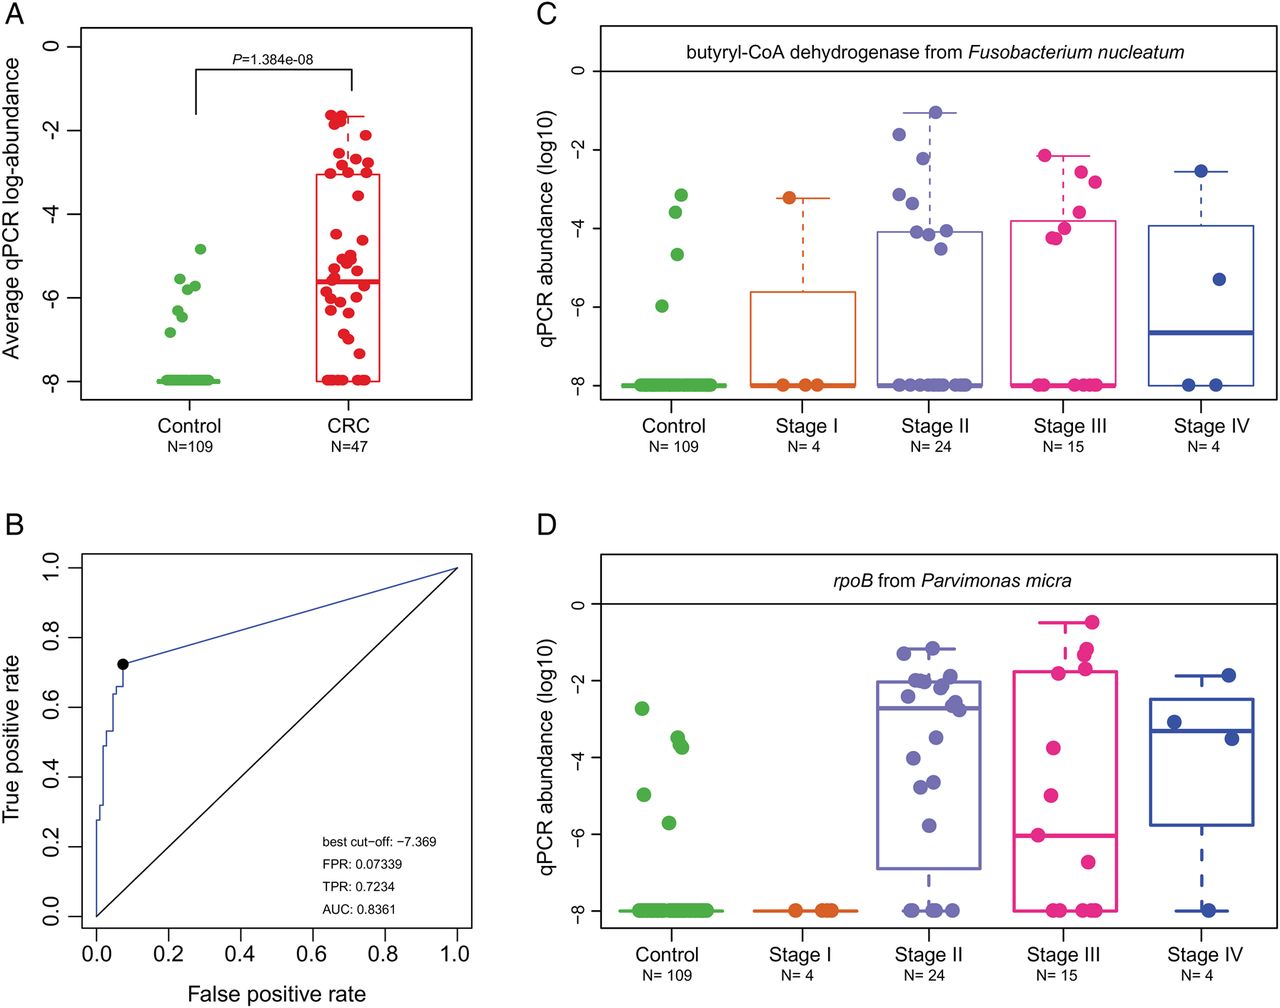
Two of the four cross-ethnically validated gene markers were transposases from P. anaerobius. The third gene (m1704941, butyryl-CoA dehydrogenase from F. nucleatum) was incidentally among the two genes successfully validated using qPCR in cohort C2. The fourth gene from P. micra was the highly conserved rpoB gene encoding RNA polymerase subunit β, often used as a phylogenetic marker.41 We performed additional qPCR measurements of rpoB from P. micra in cohort C2, which showed a significant enrichment in CRC patient microbiomes (Wilcoxon rank-sum test adjusted for colonoscopy, p=8.97×10⁻⁸). Mantel–Haenszel OR adjusted for colonoscopy was 20.17 (95% CI 4.59 to 88.6, p=3.36×10⁻⁷). Combined qPCR measurements of the two genes clearly separated CRC from control samples in cohort C2 (Wilcoxon rank-sum test adjusted for colonoscopy, p=1.384×10⁻⁸, figure 3A) and accurately classified CRC samples with an improved AUC of 0.84 (true-positive rate (TPR)=0.723; false-positive rate (FPR)=0.073; figure 3B). Accuracy was slightly better than that in a recent study (reporting AUC=0.836, TPR=0.58, FPR=0.08), even though they used a combination of abundances of 22 species using metagenomic sequencing.22 Mantel–Haenszel OR, adjusted for colonoscopy, for detecting at least one of the two markers by qPCR in patients with CRC was 22.99 (95% CI 5.83 to 90.8, p=5.79×10⁻⁸). When stratifying cohort C2 into early-stage (stages I–II) and late-stage (stages III–IV) patients with cancer, classification potential and ORs were still significant (see online supplementary table S26). Abundance of these two genes was significantly higher compared with control samples starting from stage II of CRC (figure 3C, D), agreeing with our results from species abundances and providing proof- of principle that faecal metagenomes may harbour non-invasive biomarkers for identification of early-stage CRC.

Validating robust gene markers associated with colorectal cancer (CRC). Quantitative PCR (qPCR) abundance of two gene markers (m1704941: butyryl-CoA dehydrogenase from Fusobacterium nucleatum, m1696299: RNA polymerase subunit β, rpoB, from Parvimonas micra) were measured in cohort C2 consisting of 47 cases and 109 healthy controls. Combined log-abundance of the two genes clearly separates CRC microbiomes from controls (A) and classifies CRC microbiomes with an area under the receiver operating characteristic curve of 0.84 (B). The two marker genes show relatively higher incidence and abundance in CRC stages II and III compared with control and stage I microbiomes (C and D). Abundances are plotted in log10 scale, and zero abundance is plotted as −8. AUC, areas under the receiver-operating curve; FPR, false-positive rate; TPR, true-positive rate.
Discussion
We have reported the first successful cross-ethnic validation of metagenomic gene markers for CRC, notably including data from four countries. Two recent studies reported on potential CRC diagnosis using metagenomic sequencing of faecal microbiomes. The first study based on 16S ribosomal RNA gene used five operational taxonomic units to classify CRC from healthy samples in a cohort from the USA.21 As they did not perform any independent validation, we cannot compare our validation accuracy with theirs. The second study based on shotgun metagenomic sequencing used 21 species discovered in a French cohort to accurately classify patients with CRC in a German cohort.22 Higher accuracy in their external validation (AUC=0.85 compared with our AUC of 0.77 and 0.72) could be because the validation cohort comes from the same ethnic group. Indeed, when two gene markers discovered in Chinese cohort C1 were validated in the independent Chinese cohort C2 using qPCR, we also achieved a high accuracy (AUC=0.84) even though we moved to a different platform. By doing so, we have also demonstrated, for the first time, the potential for CRC diagnosis through affordable targeted detection methods for microbial biomarkers in faecal samples. Significant improvement in the qPCR classification potential (from AUC=0.73 to AUC=0.84) by using a gene (rpoB gene from P. micra) validated in cohorts D, F and A reiterates the importance of validating newly discovered biomarkers in independent cohorts with different genetic and environmental background. Further work performing biomarker discovery in high-diversity cohorts or a meta-analysis of published cohorts could reveal whether it leads to increased predictive power. Combining metagenomic markers with the current clinical standard test (faecal occult blood test (FOBT)) has been shown to improve TPR from 49% to 72%.22 The two markers reported here have reached a comparable TPR without using FOBT. It remains to be seen whether combining FOBT with these markers will further improve accuracy.
Gene markers shared between cohorts from China, Denmark, Austria and France suggest that even though different populations may have different microbial community structures, signatures of CRC-associated microbial dysbiosis could have universal features. Several important observations should be noted: (i) CRC-enriched gene markers had higher correlation between metagenomic and qPCR abundances (r=0.93 and r=0.95) compared with control-enriched genes (r=0.81 and 0.85) in cohort C1; (ii) among four gene markers randomly tested using qPCR in cohort C2, only CRC-enriched genes were validated; (iii) all four gene markers validated in cohort D, all five markers validated in cohort A and four out of five markers validated in cohort F were CRC-enriched (see online supplementary table S25), even though there were 12 control-enriched markers compared with only 8 CRC-enriched markers; (iv) the only marker that switched enrichment during validation in different cohorts was control-enriched; (v) cohort D shared significantly more CRC-enriched genes than control-enriched genes with cohort C1; and (vi) all CRC-associated species from cohort C1 validated in cohort D were CRC-enriched. These features suggest that CRC-enriched biomarkers have a higher chance to be shared across populations and have better diagnostic potential than control-enriched biomarkers. One explanation could be that biomarkers for being healthy are harder to find than biomarkers for a specific disease, which goes against the Anna Karenina principle applied to gut microbiome that predicts higher number of disease-specific disturbed states than undisturbed states.42 Although it is mandatory to have further validation for all biomarkers in larger cohorts across different populations, our results provide a proof of principle that development of an affordable diagnostic test using faecal microbial gene markers to identify patients with CRC may indeed be possible.
The finding that only two microbial metabolic modules associated with CRC status suggests that the role of microbial pathogens may be more important in disease development than that of functional abnormalities of the gut microbiome. Alternatively, expression levels of microbial genes may be more important than functional potential. Further research employing metatranscriptomic studies of microbial gene expression levels will clarify this.
The fact that only CRC-enriched genes and species could be validated across cohorts limits our conclusions on species depleted in CRC-associated microbiomes. We observed significant over-representations of several oral pathogens—P. micra, P. stomatis, S. moorei and F. nucleatum in the stool from patients with CRC, suggesting an oral–gut translocation route associated with CRC. Even though we cannot prove this route without further experiments, a recent study based on 300 healthy individuals reported that oral and gut microbiomes were predictive of each other, supporting this view.43 While some of these species have been statistically associated with oral cancer in earlier studies,21 ,22 ,40 only F. nucleatum has been shown to promote a proinflammatory environment leading to tumorigenesis.19 Our study now introduces P. micra as a novel bacterial candidate involved in CRC-associated dysbiosis showing stronger associations with CRC across all five cohorts we investigated. Strong co-occurrence pattern between P. micra and the Gram-negative F. nucleatum,44 and the former's ability to increase its capacity to induce inflammatory responses by binding to lipopolysaccharides from Gram-negative bacteria,45 could mean cooperation between the two, both in terms of colonisation strategies and in promoting a proinflammatory tumorigenic microenvironment. Enrichment of these species starts as early as in stage II of CRC, suggesting that they may play a role in the progression of CRC. Further work characterising P. micra could elucidate its role in CRC.
We have demonstrated consistent faecal microbial changes in CRC across four cohorts, identified novel bacterial candidates that may be involved in the development and progression of CRC, validated gene markers in three cohorts from three different countries and reported two bacterial genes that could serve as effective diagnostic biomarkers of CRC. Systematic investigation of key species and gene markers identified here might reveal further candidates. Additional work will be imperative (i) to benchmark these observations against currently used diagnostic approaches, (ii) to identify additional markers with improved predictive value and (iii) to eventually validate them in much larger cohorts. The ultimate goal would be to identify faecal metagenomic markers with strong predictive power to detect early stages of CRC, which would significantly reduce CRC-associated mortality.
References
Supplementary materials
Supplementary Data
This web only file has been produced by the BMJ Publishing Group from an electronic file supplied by the author(s) and has not been edited for content.
- Data supplement 1 - Online Methods
- Data supplement 2 - Online figures
- Data supplement 3 - Online tables
Footnotes
JuY, QF, SHW, DZ, QL contributed equally.
Correction notice This article has been corrected since it published Online First. The data sharing statement has been corrected.
Contributors JuY, QF, SHW, DZ and QL contributed equally. The project was designed by JuW, JoJS, JuY, NB and MA. JuY, QF, JoJS and JuW managed the project. JuY, TOY, JS, HJN, TYTL, SCN, QL, ASLC, VW-SW, WKKW and FKLC contributed to acquisition of clinical samples, patients’ information and clinical data analyses. QL, SHW, JuY, ZL, PK and BAHJ performed DNA experiments. JuW, JuY, SHW, MA, KK, QF and DYZ designed the analysis. DYZ, MA, QF, YWQ, LQT, YLL, YL, NC, HJJ, JHL, LX and ZL performed the data analysis. DYZ, MA, QF, YWQ, LQT, YLL, YL, NC, HJJ, JHL, LX and ZL worked on metagenomic-wide association study. QL, JuY and T OY did the experimental validation. MA, JuY, SH W, QF, DY Z and LQT wrote the paper. JuW, KK, LM, JoJS, JuY, NB, JiW, HMY, HJJ, JA-A and XX revised the paper.
Funding The project was supported by the National Basic Research Program of China (973 Program, 2011CB809203, 2013CB531401), SHHO foundation Hong Kong, theme-based Research Scheme of the Hong Kong Research Grants Council (T12-403-11), the introduction of innovative R&D team programme of Guangdong Province (no. 2009010016), the Danish Cancer Society (R72-A4659-13-S2) and the Shenzhen Municipal Government of China (CXB201108250098A).
Competing interests None declared.
Patient consent Obtained.
Ethics approval Joint Chinese University of Hong Kong – New Territories East Cluster Clinical Research Ethics Committee (CUHK-NTEC CREC), Ethics Committee of the Capital Region of Denmark and Danish Data Protection Agency.
Provenance and peer review Not commissioned; externally peer reviewed.
Data sharing statement Metagenomic sequence data set has been deposited in European Nucleotide Archive with accession number PRJEB10878.