Article Text

Abstract
Objective Vedolizumab, a monoclonal antibody directed against the integrin heterodimer α4β7, is approved for the treatment of Crohn’s disease and ulcerative colitis. The efficacy of vedolizumab has been suggested to result from inhibition of intestinal T cell trafficking although human data to support this conclusion are scarce. We therefore performed a comprehensive analysis of vedolizumab-induced alterations in mucosal and systemic immunity in patients with inflammatory bowel disease (IBD), using anti-inflammatory therapy with the TNFα antibody infliximab as control.
Design Immunophenotyping, immunohistochemistry, T cell receptor profiling and RNA sequencing were performed using blood and colonic biopsies from patients with IBD before and during treatment with vedolizumab (n=18) or, as control, the anti-TNFα antibody infliximab (n=20). Leucocyte trafficking in vivo was assessed using single photon emission computed tomography and endomicroscopy.
Results Vedolizumab was not associated with alterations in the abundance or phenotype of lamina propria T cells and did not affect the mucosal T cell repertoire or leucocyte trafficking in vivo. Surprisingly, however, α4β7 antibody treatment was associated with substantial effects on innate immunity including changes in macrophage populations and pronounced alterations in the expression of molecules involved in microbial sensing, chemoattraction and regulation of the innate effector response. These effects were specific to vedolizumab, not observed in response to the TNFα antibody infliximab, and associated with inhibition of intestinal inflammation.
Conclusion Our findings suggest that modulation of innate immunity contributes to the therapeutic efficacy of vedolizumab in IBD.
Trial registration number NCT02694588
- inflammatory bowel disease
- integrins
- crohn’s disease
- ulcerative colitis
Statistics from Altmetric.com
Significance of this study
What is already known on this subject?
Vedolizumab is a monoclonal antibody directed against the integrin heterodimer α4β7 and is approved for the treatment of Crohn’s disease and ulcerative colitis.
α4β7 regulates intestinal T cell homing in animal models and α4β7 antibodies are therefore believed to inhibit intestinal inflammation through interference with intestinal T cell trafficking.
Recent data in animal models suggested that effects of α4β7 antibodies extend beyond T cells to innate immunity.
What are the new findings?
Vedolizumab only has minor effects on intestinal T cell abundance and the mucosal T cell receptor repertoire in patients with inflammatory bowel disease.
Vedolizumab substantially affects innate immunity and particularly intestinal macrophage populations.
Effects of vedolizumab on innate immunity closely correlate with clinical efficacy.
How might it impact on clinical practice in the foreseeable future?
This study suggests that alterations in innate immunity contribute to the therapeutic efficacy of vedolizumab.
Vedolizumab-induced alterations in innate immunity may be of value for the prediction of clinical responses to vedolizumab.
Future therapeutic strategies may directly address innate immunity as a target.
Introduction
Naïve T lymphocytes circulate through secondary lymphoid organs such as the spleen and lymph nodes, in which they encounter cognate antigens, leading to clonal expansion, maturation and polarisation dependent on the immunological microenvironment. In this process, T cells acquire expression of molecules that promote the migration to peripheral tissues. Among the families of receptors and ligands which regulate T cell migration to tissues, specific integrins have received particular attention. In the intestine, interactions between the integrin heterodimer α4β7 and its endothelial ligand mucosal vascular addressin cell adhesion molecule-1 (MAdCAM1) facilitate lymphocyte recruitment to Peyer’s patches and the intestinal lamina propria.1 In accordance with a critical role of these interactions in the regulation of intestinal T cell migration, antibody-mediated blockade of α4, β7 or the α4β7 heterodimer in mice inhibits the recruitment of T cells to Peyer’s patches and the intestinal mucosa, while genetic deletion of β7 in mice leads to hypoplasia of Peyer’s patches and reduced numbers of B cells in the intestinal lamina propria.2–5
Intestinal inflammation is partially dependent on recruitment of adaptive immune cells to the intestinal mucosa. The critical role of α4β7 in intestinal trafficking of lymphocytes and the upregulation of its ligand MAdCAM-1 in the inflamed mucosa6 suggested that therapeutic inhibition of interactions between α4β7 and MAdCAM-1 may be efficacious for the treatment of IBD. In accordance with this concept, antibody-mediated blockade of α4, β7, the α4β7 heterodimer or its ligand MAdCAM-1 reduced the homing of T cells into the inflamed colon of colitic mice, which was associated with a reduction in colonic T cell density and reduced intestinal inflammation and injury.4 6 Moreover, in colitic cotton-top tamarins, antibody-mediated neutralisation of α4β7 was associated with decreased mucosal densities of T cells, B cells and myeloid cells as well as with amelioration of inflammation.7 In line with these studies in model systems, vedolizumab, a humanised version of the anti-α4β7 antibody Act-1,8 was demonstrated to be efficacious in Crohn’s disease (CD) and ulcerative colitis (UC) and has become a mainstay of IBD treatment.9 10
Although data in animal models have suggested that α4β7 targeting acts through inhibition of T cell trafficking to the inflamed intestinal mucosa, it remains unclear whether similar mechanisms are responsible for the efficacy of vedolizumab in the treatment of IBD. Furthermore, recent work in mice and rhesus macaques has shown limited effects of α4β7 targeting on intestinal T cells and has documented α4β7-dependent contributions of innate immunity to intestinal inflammation.11–16 Here, we performed a comprehensive, longitudinal analysis of vedolizumab-induced alterations in mucosal and systemic immunity to delineate the effects of vedolizumab on innate and adaptive immune cells and their relation to the clinical efficacy of α4β7 targeting. We found that vedolizumab had little impact on the abundance, phenotype and T cell receptor (TCR) repertoire of intestinal T cells as well as on leucocyte trafficking to the intestine, but elicited pronounced alterations in innate immunity, which were tightly linked to achievement of clinical remission. These alterations were specific to treatment with vedolizumab and not observed in response to anti-inflammatory therapy using the TNFα antibody infliximab.
Methods
Experimental design and study approval
This prospective observational study is registered under ClinicalTrials.gov (NCT02694588). All subjects provided written informed consent. A total of 38 patients were investigated including 17 patients with CD and 21 patients with UC. Clinical characteristics of patients are shown in table 1. We included patients with active colonic disease who received vedolizumab or infliximab for induction of remission in standard medical care. Indication and choice of treatment were based on clinical decisions and not part of the study protocol. Patients were investigated 24 hours before initiation of treatment and at weeks 2, 6 and 14 after initiation of treatment. At each time point, 60 mL of peripheral blood were obtained and a sigmoidoscopy was performed, in which up to eight biopsies were taken from the sigmoid colon. Peripheral blood and biopsies from the sigmoid colon of patients were obtained within 24 hours prior to initiation of treatment and immediately before administration of vedolizumab or infliximab at weeks 2, 6 and 14. Three patients with CD received autologous leucocytes labelled with fluorescein and indium for the investigation of leucocyte trafficking by endomicroscopy and single photon emission computed tomography (SPECT)/CT. To this end, leucocytes were obtained from peripheral blood before as well as 2 and 6 weeks after initiation of vedolizumab treatment. Leucocytes were labelled as described below, followed by reinfusion and endomicroscopy of the sigmoid colon as well as SPECT/CT analysis.
Baseline disease characteristics of patients with CD and patients with UC and clinical outcomes (for definitions, see Methods section)
Patients with CD with a Harvey-Bradshaw Index (HBI) of ≤4 were considered to be in remission, those with ≥5 to have active disease. Responders were defined as patients with a decrease of ≥2 points in HBI compared with baseline or patients who achieved remission as defined above. Patients with UC and a total Mayo Score of ≤2 (bleeding 0 and endoscopy ≤1) were considered to be in remission, those with ≥3 to have active disease. Responders were defined as patients with a decrease in Mayo Score of ≥30% compared with baseline or those who achieved remission as defined above. Eight healthy individuals who underwent routine screening colonoscopy without pathological findings were included in the TCR analysis and were matched with regard to gender and age of patients with IBD.
Peripheral blood mononuclear cells (PBMCs)
Blood was collected using K3-EDTA tubes (Sarstedt, Germany) and diluted with an equal volume of 1 × phosphate buffered saline (PBS). The diluted blood was underlayed with one volume of Biocoll (density 1.077 g/mL; Biochrom, Germany). Following centrifugation for 20 min at 800×g, the interface containing mononuclear cells was transferred to a new tube. Cells were washed once with 1 × PBS and once with FACS buffer (1 × PBS, 1% fetal calf serum (FCS)) before determination of cell number and flow cytometric analysis.
Isolation of intraepithelial and lamina propria leucocytes
Biopsies were washed once with 10 mL solution A (Hank’s balanced salt solution (HBSS) with 25 mM HEPES) and transferred to a 50 mL tube containing 25 mL of solution B (solution A including 10% FCS, 2.5 mM EDTA, 1 mM DTT). To collect epithelial cells and intraepithelial lymphocytes (IELs), biopsies were shaken at 37°C at 250 rpm for 20 min and the supernatant was passed through a 40 µm cell strainer. Shaking was repeated with 25 mL fresh solution B and the supernatant was passed through a 40 µm strainer. Supernatants were centrifuged at 500×g for 5 min, washed once with 20 mL of solution A and resuspended in 5 mL of HBSS with 1% FCS. This fraction contained epithelial cells and IELs. Remaining tissue was washed once with solution A and minced. To isolate lamina propria mononuclear cells (LPMNCs), 35 mL of solution C (RPMI 1640, 10% FCS, 30 mg collagenase IV (Merck-Millipore, Germany), 0.6 mg DNAseI (Roche, Germany) were added and tissue pieces were shaken for 60 min at 37°C at 180 rpm. The cell suspension was passed through a 40 µm strainer, was washed with 10 mL of solution A, centrifuged at 400×g for 5 min, washed with 20 mL of solution A, centrifuged and resuspended in 5 mL of HBSS containing 1% FCS.
Flow cytometry
The following antibodies were used: CD62L-FITC clone DREG-56 (Biolegend), CD69-PE clone FN50 (Biolegend), CD4-Alexa Fluor 700 clone RPA-T4 (BD Biosciences), CD45RA-PE-TexasRed clone MEM 56 (Life technologies), CD8b PE-Cy7 clone SIDI8BEE (eBioscience), TCRγδ-Brilliant Violet 421 clone B1 (Biolegend), TCRαβ-APC-Vio770 clone BW242/412 (Miltenyi Biotech), CCR7-Brilliant Violet 510 (BD Biosciences), CD25-Brilliant Violet 605 (BD Biosciences), CD27-PerCp/Cy5.5 clone O323 (Biolegend), CD56-FITC clone MEM-188 (Biolegend), CD38-PE clone HIT2 (Biolegend), CD19-PE-Cy7 clone HIB19 (BD Biosciences), CD3-PE-TexasRed clone 7D6 (Life technologies), CD14-Alexa Fluor 700 clone HCD14 (Biolegend), CD203c-Alexa Fluor 700 clone NP4D6 (Novusbio), CD49d-Brilliant Violet 421 clone 9F10 (Biolegend), CD11c-APC-Bio770 clone MJ4-27G12 (Miltenyi Biotech), CD16-Brilliant Violet 510 clone 3G8 (BD Biosciences) and CD15-Brilliant Violet 605 clone W6D3 (BD Biosciences). Cells were incubated with antibodies diluted in FACS buffer for 20 min at 4°C and washed twice with FACS buffer. Flow cytometry was performed using a BD FACSAria II. Data analysis was performed using FlowJo software.
TCR repertoire profiling
Total RNA from whole biopsies was isolated using the mirVana miRNA isolation kit (Life Technologies) following the manufacturer’s instructions. TCR-specific library preparation was performed with a method adapted from Mamedov et al.17 Briefly, cDNA synthesis was performed using the SMARTScribe kit (Clonotech) with primers specific for the constant region of TCR-α and TCR-β and a 5’-template switch adapter to capture all variable regions present in the sample. A unique molecular identifier (UMI) was also included in the adapter for further PCR and sequencing error correction.18 After cDNA synthesis, samples underwent Uracil glycosylase treatment to remove remaining 5’-template switch adapters (New England Biolabs). Two consecutive nested PCRs were performed and samples were purified after each PCR with MagSi-NGSprep Plus (MagnaMedics). Unique barcodes and illumina adaptors were added during the second PCR.19 Quality and quantity of final PCR products were assessed using Tape Station D1000 (Agilent) and Qubit measurement (Thermofisher).
PCR products were pooled and sequenced using the Illumina MiSeq 150PE platform. Low quality reads were filtered out from raw data and PCR and sequencing error correction was applied using the MIGEC software for unique UMI filtering.20 Complementary determining region 3 (CDR3) region information was extrapolated from each sample using MiXCR software.21 Further analyses and plot generation were performed using the software VDJtools,22 the R software ‘tcR’ and ‘Vegan’ packages23 24 for gene usage and diversity calculation.
Leucocyte labelling, SPECT/CT and endomicroscopy
Forty-five mL of heparinised peripheral blood were obtained. After sedimentation for 60 min at room temperature, the supernatant (leucocyte-rich plasma) was collected and leucocytes were separated from plasma by centrifugation at 100×g and washed with 5 mL PBS at 100×g. After resuspension in 1 mL PBS, leucocytes were labelled using 20–37 MBq Indium-111-Oxin (In-111) for 10 min followed by addition of 200 µl fluorescein for 30 s (Alcon, Freiburg). Cells were centrifuged at 400×g for 5 min, washed using 5 mL of PBS and centrifuged again. Leucocytes were resuspended in autologous plasma and injected intravenously.
Whole body scintigraphy and abdominal SPECT/CT scans were performed at 2 and 24 hours after leucocyte administration using a hybrid gamma camera (Symbia Intevo, Siemens, Erlangen, Germany). Region of interest analysis was performed using PMOD (PMOD Technologies LLC, Zurich, Switzerland). Standard Uptake Value body surface area (SUVbsa) was calculated as shown:

for lung, heart, liver, spleen, kidneys, bone marrow and colon. Data were normalised to activity in bone marrow.
Endomicroscopy was performed using probes from Mauna Kea Technologies. Recording in sigmoid colon was started 1 min after intravenous administration of fluorescein-labelled leucocytes and leucocyte migration was investigated for 10 min. The number of bright cells outside of blood vessels was determined and expressed per visual field.
Transcriptome mapping
Strand-specific paired-end sequencing libraries from total RNA were constructed using the TruSeq stranded Total RNA kit (Illumina Inc). Sequencing was performed on an Illumina HiSeq3000 (2×75 base pairs, 1/10 samples per lane). Low quality nucleotides were removed using the Illumina fastq filter (http://cancan.cshl.edu/labmembers/gordon/fastq_illumina_filter/). Reads were further subjected to adaptor trimming using cutadapt.25 Alignment of the reads to the human genome was done using TopHat226 using the parameters: ‘--library-type fr-firststrand --b2-very-sensitive --read-mismatches 16 --read-edit-dist 16’. The GTF file (GRCh38, release 22 GENCODE) for the alignment was downloaded from GENCODE (ftp://ftp.sanger.ac.uk/pub/gencode/Gencode_human/release_22/gencode.v22.annotation.gtf.gz). The average concordant mapping rates for the samples were between 91% and 96%.
For RNA-based approaches to cell deconvolution, we analysed RNAseq data using the CIBERSORT online tool (https://cibersort.stanford.edu/).27 To this end, the LM22 matrix from CIBERSORT, a matrix based on 547 genes designed and validated to distinguish 22 human haematopoietic cell phenotypes served as reference matrix.27
Read quantification
Using the parameters: ’htseq-count -f bam -s reverse -m union -a 20', HTSeq-0.6.1p128 was used to count the reads that map to the genes in the aligned sample files. The GTF file used for mapping was also used for read quantification. Gene centric differential expression analysis was performed using DESeq2_1.8.1.29 Genes were considered as differentially expressed if the adjusted p value was less than 0.05.
Immunohistochemistry
Immunohistochemistry was performed using paraffin-embedded tissues. For immunohistochemical staining, 5 µm sections of paraffin-embedded colon sections were deparaffinized with Xylol substitute (Roth), incubated in citrate buffer for 3 min and subsequently blocked with blocking serum (Vectastain) for 20 min. Primary rabbit anti-CD3 antibody (1:100 dilution, Abcam, #ab16669) was incubated for 1 hour at room temperature in PBS, containing 1% bovine serum albumin. Sections were washed, incubated with secondary antibody (anti-rabbit, 1:1000 dilution, Jackson Immunoresearch, #111-065-144) and DAB substrate (Vectastain ABC Kit). Slides were visualised using an AxioImager Z1 microscope (Zeiss, Jena, Germany). Pictures were captured by a digital camera system (AxioCam HrC/HrM, Zeiss). Measurements were made using a semiautomated image analysis software (AxioVision V.08/2013). For the quantification of lamina propria T cells, CD3+ cells were counted in 3–4 high-power fields (HPFs) per section in 3–4 different tissue sections per patient. CD3+ T cells numbers were then expressed as a percentage of LPMNCs or as absolute counts per HPF.
Statistics
Statistical significance of immunophenotyping data was assessed using the Wilcoxon rank sum test. For TCR repertoire diversity analysis, age and gender correction was applied for calculation of significant statistical differences using linear regression modelling. For TCR diversity and gene usage analysis, clonotype tables were normalised by downsampling of the read count to samples with the lowest read count. The Gini index,30 which measures the inequality among values of a frequency distribution, and the absolute clonotype count were calculated. Statistically significant differences were assessed using the Wilcoxon rank sum test. Correction for multiple comparisons was applied using the Benjamini-Hochberg method.31
Results
Study design
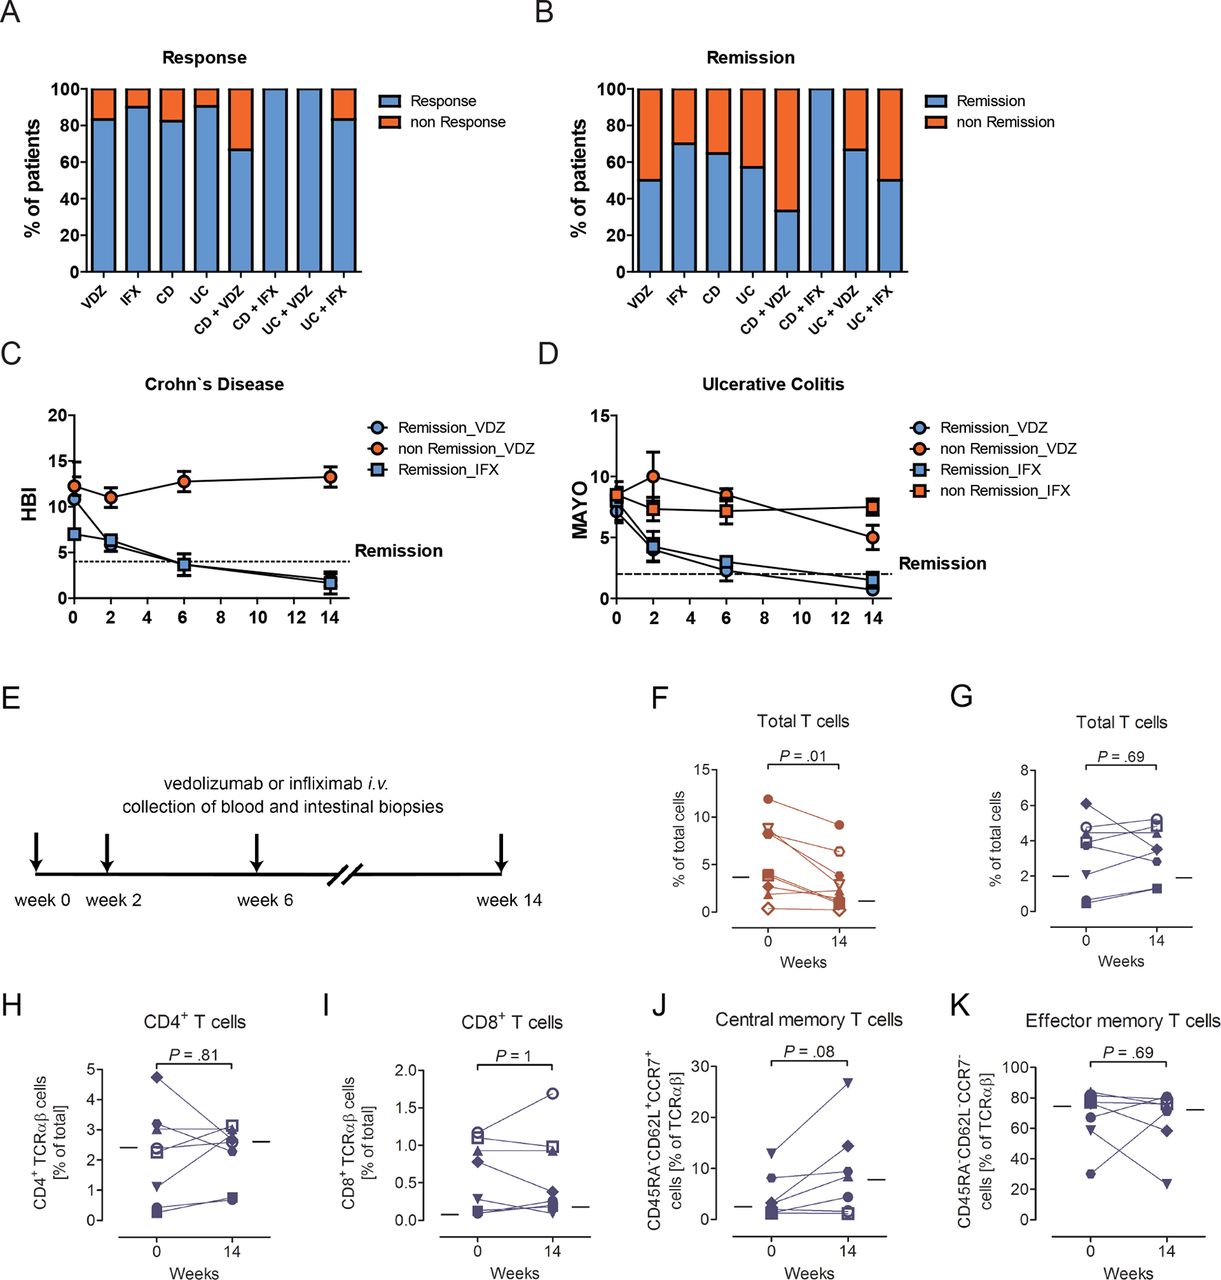
We performed a longitudinal investigation of mucosal and systemic immunity in patients with CD (n=9) and UC (n=9), who received first-time therapy with vedolizumab during standard clinical care for the treatment of active IBD. Eight patients with CD and 12 patients with UC who received first-time therapy with infliximab, a monoclonal antibody directed against TNFα, served as treatment controls. The clinical characteristics of all patients are described in table 1 and figure 1A–D. Briefly, six of nine patients with CD (67%) and nine of nine patients with UC (100%) showed a clinical response to vedolizumab at week 14 of treatment, with three of nine patients with CD (33%) and six of nine patients with UC (67%) achieving clinical remission (table 1, figure 1A,B). All 8 patients with CD treated with infliximab achieved clinical remission in response to treatment, while 10 of 12 patients with UC (83%) showed a clinical response with 6 of 12 patients (50%) achieving clinical remission (table 1, figure 1A,B). The dynamics of clinical responses were comparable between vedolizumab-treated and infliximab-treated patients (figure 1C,D). Peripheral blood and biopsies from the sigmoid colon of patients were obtained within 24 hours prior to initiation of treatment and immediately before administration of vedolizumab or infliximab at 2, 6 and 14 weeks of treatment (figure 1E) and were subjected to FACS-based immunophenotyping, immunohistochemical staining and TCR sequencing. In addition, RNA sequencing of whole colonic biopsies was performed. Moreover, in a subset of patients, leucocyte trafficking in vivo was directly examined using endomicroscopy and SPECT. The allocation of individual patients to procedures is shown in online supplementary table S1.
Supplemental material

Clinical responses and changes in the frequency of lamina propria T cells on treatment with biologicals. (A,B) Percentage of patients showing clinical response (A) and remission (B) at week 14 of the respective treatment. (C,D) Dynamics of clinical responses. (E) Schematic depiction of interventions. Peripheral blood and biopsies from the sigmoid colon of patients were obtained within 24 hours prior to initiation of treatment and immediately before administration of vedolizumab or infliximab at weeks 2, 6 and 14. (F–K) Relative frequency of lamina propria T cell subsets in individual patients (indicated by individual symbols) before (week 0) and at week 14 of treatment with infliximab (F, red) or vedolizumab (G-K, blue). Lines show the median of all patients at the respective time point. Statistical significance was determined using the Wilcoxon rank sum test. IFX indicates infliximab and VDZ indicates vedolizumab. CD, Crohn’s disease; HBI, Harvey-Bradshaw Index; TCR, T cell receptor; UC, ulcerative colitis.
Vedolizumab has minor effects on the abundance and phenotype of intestinal T cells
To investigate potential changes in immune cell composition and activation associated with vedolizumab treatment, we performed a systematic flow cytometry-based analysis of mononuclear immune cell populations in peripheral blood, the colonic lamina propria and the colonic intraepithelial compartment. Since the efficacy of vedolizumab is believed to result from inhibition of T cell homing to the intestine, we reasoned that potential changes in mucosal immune cell composition associated with vedolizumab will increase over time. We therefore focused in our initial analysis on results obtained at week 14 of treatment, the latest time point investigated and compared patients who received vedolizumab with those who received infliximab.
Anti-inflammatory therapy with the TNFα antibody infliximab led to a reduction in the relative abundance of lamina propria T cells (figure 1F), which was rapid and already observed 2 weeks post-treatment initiation (online supplementary figure S1A), findings consistent with previous observations of rapid induction of T cell death and reverse signalling by infliximab in the intestinal lamina propria.32–34 In contrast, α4β7 inhibition by vedolizumab was not associated with a decrease in the relative abundance of lamina propria T cells (median 3.8% and 3.5% of LPMNCs at week 0 and 14, respectively; figure 1G). These results were confirmed by immunohistochemical staining for CD3, which revealed unaltered relative and absolute numbers of lamina propria CD3+ T cells at week 14 of vedolizumab treatment (online supplementary figure S1B,C). Flow cytometry further demonstrated that vedolizumab did not affect the relative abundance of lamina propria CD4+ T cells (figure 1H), CD8+ T cells (figure 1I), central memory T cells (figure 1J) and effector memory T cells (figure 1K). T cell expression of the activation marker CD69 and the activation/regulatory T cell marker CD25 was also unaffected by vedolizumab, with five of seven vedolizumab-treated patients showing unaltered or even increased CD69 expression at week 14 of treatment (online supplementary figure S1D). Analysis of other time points such as weeks 2 and 6 similarly failed to demonstrate vedolizumab-induced alterations in the abundance of T cells or their subpopulations among LPMNCs (online supplementary table S2). Furthermore, subgroup analysis of patients with CD and UC, patients who did or did not show clinical response or remission on vedolizumab treatment (see Methods section) and of male compared with female patients also did not reveal any trend towards alterations in lamina propria T cell composition or activation in response to vedolizumab (data not shown).
We performed a detailed analysis of mononuclear immune cells in the lamina propria to investigate whether vedolizumab affects the intestinal immune cell composition through effects on LPMNCs beyond the T cell compartment. However, the relative abundance of NK cells, total and memory B cells as well as plasma cells in the lamina propria was not affected by vedolizumab (online supplementary figure S2 and table S2). We also extended our analysis to the study of IELs and PBMCs. Among IELs, vedolizumab did not affect the relative abundance of T cells or their CD4+ and CD8+ subpopulations, but was associated with a non-significant trend towards a reduction in activated, CD69+ CD4+ but not CD69+ CD8+ T cells (online supplementary figure S3A and table S3). In peripheral blood, individuals treated with vedolizumab showed an increase in CD69+ T cells which, however, predominantly affected CD8+ T cells (online supplementary figure S3B and table S4). While the mechanistic basis of this increase in CD69+ CD8+ T cells is not known, unaltered frequencies of CD69+ CD8+ T cells in the lamina propria and intraepithelial compartment (online supplementary figure S3A and tables S2and S3) argue against a redistribution of activated CD8+ T cells from the intestinal compartment. Together, these data demonstrate minor and selective effects of α4β7 targeting on intraepithelial and peripheral blood T cells, while alterations among LPMNCs were only observed in response to infliximab but not vedolizumab.
Vedolizumab does not affect the intestinal T cell receptor repertoire
Flow cytometry-based studies as reported above did not reveal consistent changes in the frequency or activation of colonic lamina propria T cells in response to vedolizumab. To further investigate whether α4β7 targeting affects intestinal T cells, we studied the colonic TCR repertoire in patients receiving vedolizumab. We analysed individual TCRs, hereafter referred to as clonotypes, using high-throughput sequencing of the CDR3 of the TCR-α and TCR-β chains and identified the variable (V), joining (J) and constant (C) region alleles.
While human data on intestinal T cell turnover and its regulation by α4β7 are scarce, studies in parabiotic mice have demonstrated that renewal of T cells in the intestinal lamina propria is supported by the influx of T cells from the systemic circulation in a process partially dependent on β7.35–38 Importantly, this work also revealed that the dynamics of replenishment of intestinal T cells from the circulation differ between CD4+ and CD8+ T cells and between the intraepithelial and lamina propria compartment.35–38 Given differences in T cell turnover between distinct T cell subsets and dependence of this process on α4β7, vedolizumab-induced blockade of α4β7 was anticipated to be associated with alterations in the intestinal T cell composition and thus in the TCR repertoire. To test this hypothesis, we obtained biopsies from the sigmoid colon before initiation and at early (2 weeks), intermediate (6 weeks) and late (14 weeks) time points of vedolizumab treatment (five patients with CD and five patients with UC, online supplementary table S1). While segmental heterogeneity exists in the colonic TCR repertoire, particularly between distant sites of the colon, adjacent areas of the mucosa share dominant TCR clonotypes, which allows for repeated sampling to assess the temporal stability of the TCR repertoire.39 40
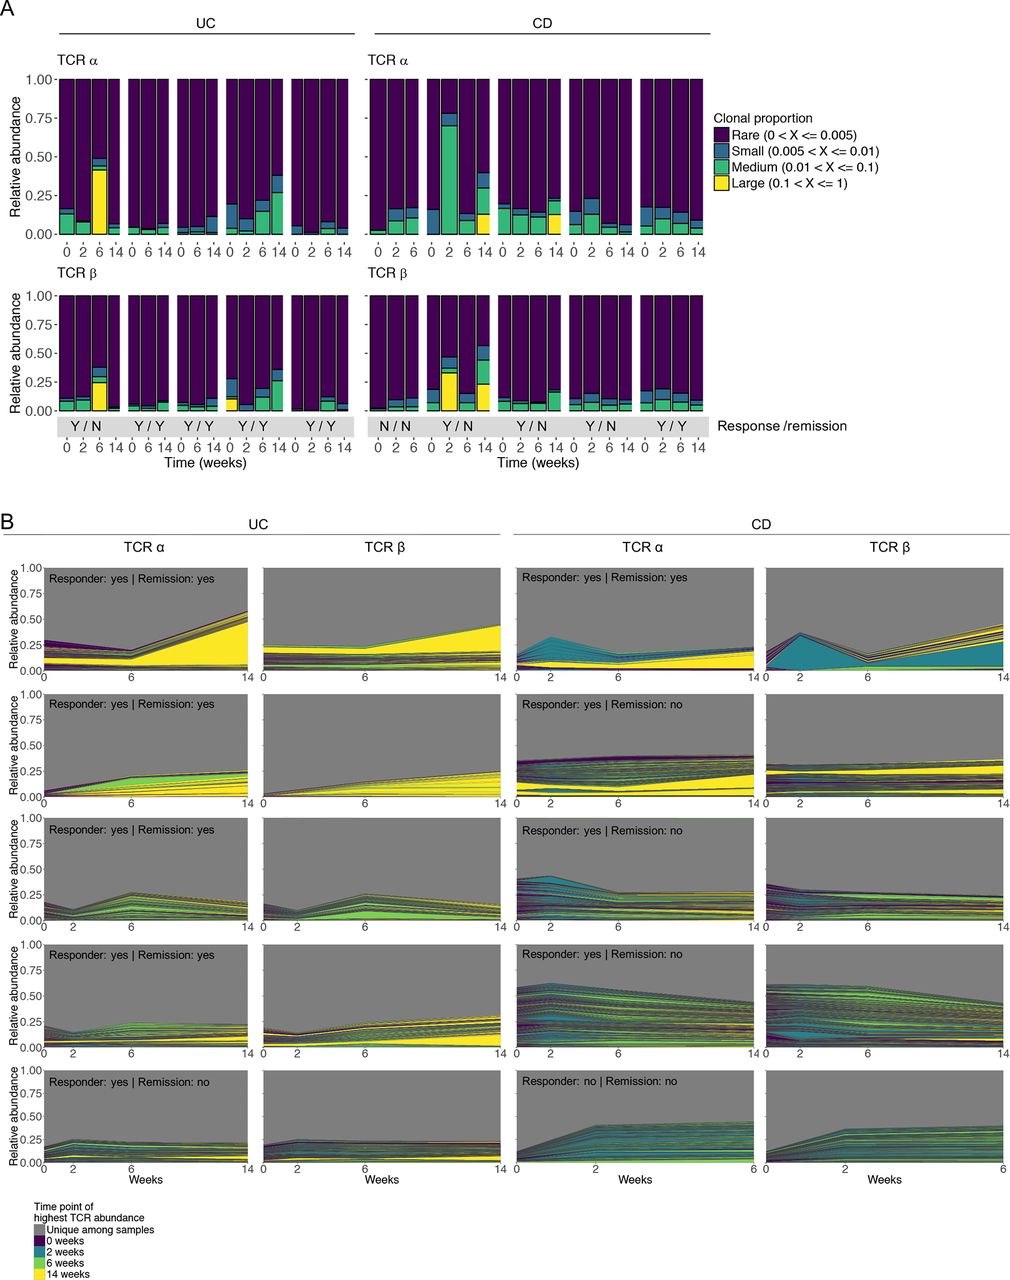
In accordance with the oligoclonal nature of the intestinal TCR repertoire, dominant T cell clonotypes were found in most patients with different degrees of clonotype expansion (figure 2A). Significant interindividual differences in the TCR repertoire were observed with little overlap in the relative representation of abundant clonotypes between different individuals and less than 300 functional TCR sequences shared by more than three individuals (online supplementary table S5). Sequences shared between individuals mainly originated from invariant TCR-α chains of mucosal-associated invariant T or invariant natural killer T cells. Importantly, vedolizumab was not associated with a consistent pattern of changes in TCR clonotype abundance. In particular, we did not observe a picture in which vedolizumab treatment was associated with a consistent gradual loss of abundant existing clonotypes and the emergence of new dominant clonotypes (figure 2A,B). This observation was identical in responders and non-responders to treatment (figure 2A,B).
Supplemental material

Individual TCR repertoires before and during treatment with vedolizumab. (A) Clonotype proportion over time among vedolizumab-treated patients before and during vedolizumab treatment, divided by disease (UC and CD). The bottom grey panel indicates achievement of clinical response/clinical remission in response to vedolizumab for each patient (Y, yes; N, no). Clonotypes are categorised based on their relative frequency within each sample. (B) Individual repertoires of the TCR-α and TCR-β chain over 14 weeks of vedolizumab treatment are depicted as a function of each TCRs proportion within each sample. Coloured areas represent TCR CDR3 regions found at ≥2 different time points. The colour of the area is indicative of the time point with the highest abundance of the specific TCR. The grey area represents the proportion of TCRs uniquely found at a single time point. Achievement of clinical response and remission is indicated. CD, Crohn’s disease; CDR3, complementary determining region 3; TCR, T cell receptor; UC, ulcerative colitis.
Colonic TCR-α and TCR-β chain usage was characterised by over-representation of specific TCR V and J segments (figure 3 and online supplementary figure S4). While individual TCR clonotypes exhibited a low degree of sharing between different patients (online supplementary table S5), TCR-α and TCR-β segment usage showed significant overlap between patients within this study (figure 3 and online supplementary figure S4) as well as with TCR-α and TCR-β segments previously reported to be overrepresented in peripheral blood of healthy individuals (TRBV20-1, TRBV5-1) and in the intestinal mucosa of patients with CD (TRBV20-1, TRBV5-1, TRBV7-2, TRAV13-1).39 41–43 Inclusion of biopsies from the sigmoid colon of eight healthy subjects undergoing routine screening colonoscopy without pathological findings demonstrated that TCR-α and TCR-β chain segments increased in relative abundance in patients with CD and UC are also dominant in healthy controls and thus not do not represent a disease-specific TCR signature (online supplementary figure S5A–D). However, statistically significant differences in the relative abundance of some TCR genes between healthy subjects and patients with IBD were observed (online supplementary figure S5E). Most importantly, in line with results of TCR clonotype analysis (figure 2), the TCR V and J segment usage was relatively stable over time, with no consistent changes in response to treatment with vedolizumab (figure 3 and online supplementary figure S4).
TCR-α and TCR-β diversity measures were determined by TCR clonotype count (figure 4A) and the distribution inequality Gini index24 44–46 (online supplementary figure S6). Clonotype counts were similar in CD and UC but mildly increased compared with healthy controls (figure 4A, online supplementary figure S6). In accordance with temporal stability of the TCR repertoire (figure 2) and TCR gene usage (figure 3) during vedolizumab treatment, TCR-α and TCR-β diversity did not show statistically significant changes in response to treatment (figure 4B,C, online supplementary figure S6).

Colonic V gene usage of TCR-β at different time points before and during vedolizumab treatment. The relative abundance of each TRBV gene is shown for each sample. Different patients are divided by white lines. For visualisation purposes, genes are hierarchically clustered using the Ward.D agglomeration method.62 TCR, T cell receptor.

Colonic TCR clonotype count at baseline (A) and during vedolizumab treatment (B,C). (A) TCR-α and TCR-β clonotype count in patients with IBD and controls at baseline. (B,C) TCR-α (B) and TCR-β (C) clonotype count in individual patients during vedolizumab treatment. Statistical significance was determined using the Wilcoxon rank sum test. IBD, inflammatory bowel disease; TCR, T cell receptor.
Unaltered leucocyte trafficking to the intestine in patients treated with vedolizumab
Flow cytometry-based analysis as well as TCR sequencing did not detect consistent alterations in the phenotype, activation or TCR repertoire of lamina propria T cells in response to vedolizumab. To directly examine the effects of α4β7 targeting on the trafficking of leucocytes to the intestine, we labelled leucocytes obtained from peripheral blood using Indium (In)−111 and investigated their trafficking to the intestine by SPECT/CT, a sensitive method for quantification of intestinal leucocyte migration and detection of intestinal inflammation in IBD.47 Peripheral blood of three patients with colonic CD was collected before as well as after 2 and 6 weeks of vedolizumab treatment. Autologous, In-111-labelled leucocytes were administered intravenously followed by SPECT/CT at 2 and 24 hours after leucocyte administration.
At baseline, all patients showed enhanced leucocyte trafficking to the sigmoid colon, consistent with mild to moderate colitis by scintigraphic criteria (figure 5A,B), which was in accordance with endoscopic and histological findings. Surprisingly, leucocyte trafficking to the colon as detected by colonic indium accumulation was largely unaffected by vedolizumab treatment. Specifically, patients 1 and 3 exhibited a mild increase in colonic indium uptake during the course of vedolizumab treatment, while patient 4 showed unaltered indium uptake at week 2 of vedolizumab treatment and a mild decrease in colonic indium accumulation at week 6 of treatment (figure 5B). Importantly, colonic indium uptake was not related to clinical responses as patient 1 showed no response to vedolizumab, while patients 3 and 4 responded clinically. In conclusion, even when restricting the analysis to the two clinical responders, we did not observe a reduction in intestinal leucocyte trafficking after treatment with vedolizumab. These data are consistent with previous indium-based studies showing that even α4β7-expressing, gut-derived human T cells bind to MAdCAM-1 in vitro but do not preferentially home to the intestine in vivo on autologous reinfusion.48
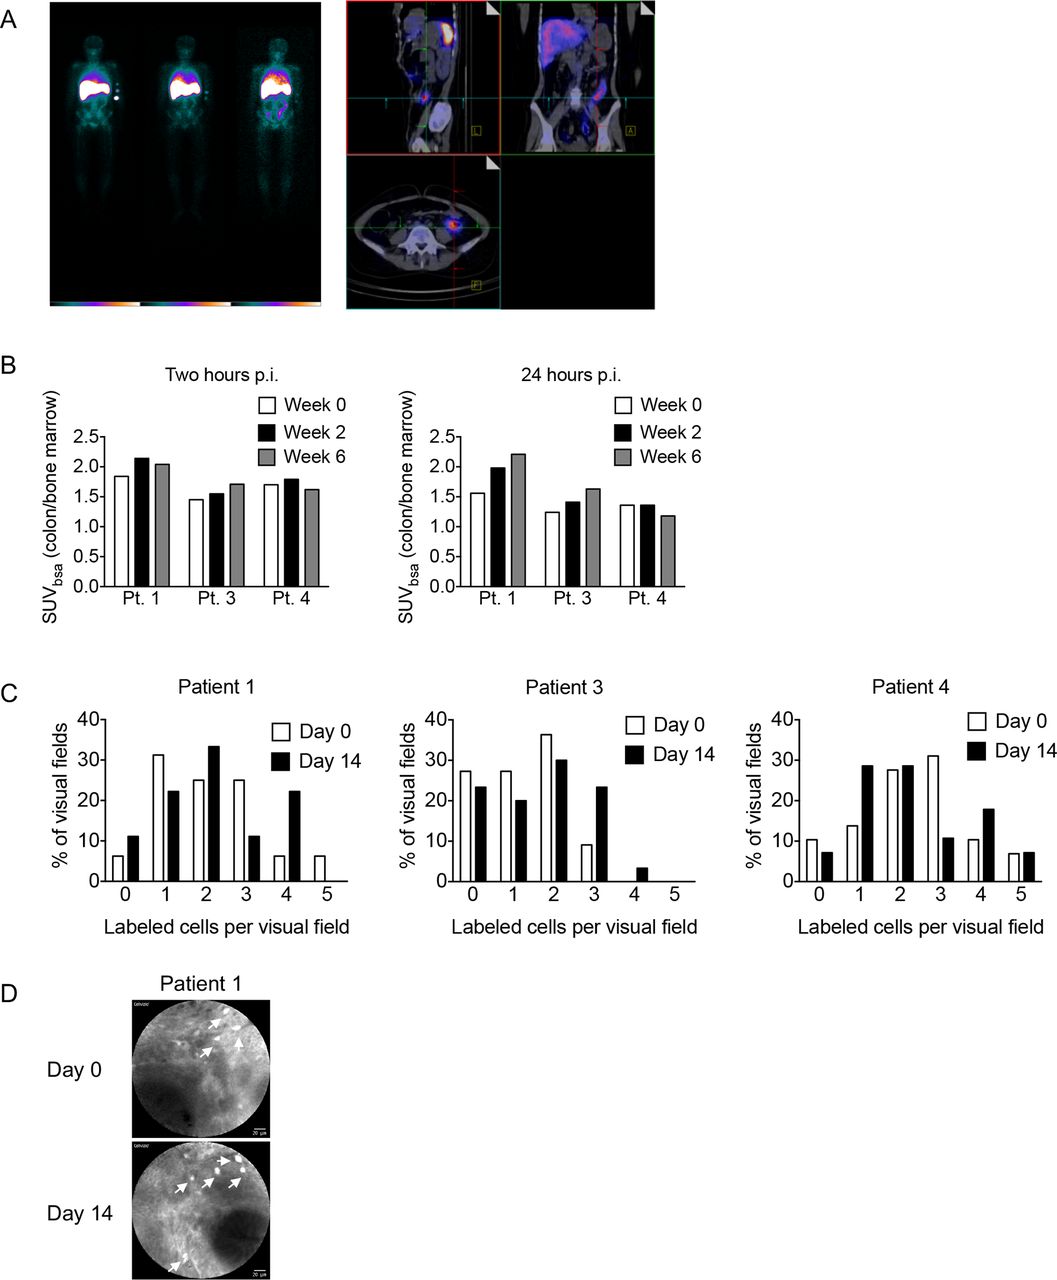
Intestinal leucocyte homing is not affected by vedolizumab treatment. (A) Representative whole body scintigraphy (left) and SPECT/CT images (right) of patient 1 at week 0. (B) Standard uptake values in the sigmoid colon, normalised to bone marrow, in the indicated patients at the indicated time points p.i. (C) Percentage of visual fields (y-axis) containing the indicated number of fluorescein-labelled cells per field (x-axis) before and 14 days after vedolizumab treatment as determined by endomicroscopy. (D) Representative endomicroscopy images. p.i., post-infusion; SPECT, single photon emission computed tomography; SUVbsa, standard uptake value body surface area.
Leucocyte scintigraphy allows to investigate the accumulation of leucocytes in a broad region of the intestine over the course of several hours but does not allow for tracking of individual leucocytes. Endomicroscopy serves as an approach for individual live cell imaging during endoscopy and provides microscopic, cellular and subcellular resolution. Endomicroscopy is typically combined with intravenous administration of fluorescein, which is associated with intense staining of cells and blood vessels. While fluorescein leads to almost ubiquitous staining when administered intravenously, the isolation of peripheral blood leucocytes for indium labelling offered the opportunity to selectively label leucocytes using fluorescein ex vivo. To this end, fluorescein was added at the last step of indium labelling, unbound fluorescein was removed and labelled cells were directly visualised by endomicroscopy in the sigmoid colon starting 1 min after intravenous injection, when labelled leucocytes began to accumulate in intestinal small vessels. Recording was continued for a total of 10 min after leucocyte administration. To assess the impact of vedolizumab treatment on intestinal leucocyte migration, endomicroscopic studies were performed before and 2 weeks after initiation of vedolizumab therapy. Analyses focused on the quantification of extravascular, labelled cells in the colonic lamina propria. Consistent with results of leucocyte scintigraphy, endomicroscopy-based, direct visualisation of individual leucocytes did not reveal alterations in leucocyte accumulation in the colonic lamina propria under the influence of vedolizumab (figure 5C,D). Together, these data are in accordance with those obtained by flow cytometry and TCR sequencing and show limited effects of vedolizumab on intestinal trafficking of leucocytes.
The clinical efficacy of vedolizumab is tightly linked to alterations in innate immunity
Given limited effects of vedolizumab on the abundance, phenotype and TCR repertoire of lamina propria T cells as well as on the trafficking of leucocytes to the intestine, we wondered whether alternative mechanisms contribute to the clinical efficacy of α4β7 targeting. We therefore investigated transcriptional signatures in the sigmoid colon before and at week 14 after induction of vedolizumab therapy in 16 patients with IBD (7 patients with CD, 9 patients with UC, online supplementary table S1). In this cohort, nine patients achieved clinical remission, whereas seven did not. In total and irrespective of remission status (n=16 patients), 1127 genes were found to be differentially expressed (174 upregulated, 953 downregulated) on vedolizumab treatment (pairwise comparison between week 0 and week 14) (figure 6A,B, online supplementary table S6). Among vedolizumab-treated patients who achieved clinical remission, 1340 (266 up, 1074 down) genes were differentially expressed in a similar pairwise comparison between week 0 and 14 (figure 6A,B, online supplementary table S7). Of these 1340 genes, 763 (77 upregulated, 686 downregulated) showed overlap with the 1127 genes differentially expressed in the total population of vedolizumab-treated patients (figure 6A,B, online supplementary table S8). In contrast, among vedolizumab-treated patients who did not achieve clinical remission, only one gene was differentially expressed in a comparison between results of week 0 and week 14 (figure 6A).
Supplemental material
Supplemental material
Supplemental material

Vedolizumab-induced clinical remission is linked to alterations in innate immunity. (A) Venn diagram of differentially expressed genes in response to vedolizumab (week 0 vs week 14). Shown are vedolizumab-induced transcriptional changes irrespective of remission status (all patients) or separated according to remission status (remission, non-remission). (B) Venn diagram of genes regulated in response to vedolizumab in all patients and those patients who achieved treatment-induced remission. (C) GO-term and TFBS analysis of the top 250 overlapping downregulated genes as shown in (B). (D) STRING network analysis of top 250 overlapping downregulated genes. Shown are gene-gene interactions with a medium confidence of 0.4. Gene names were manually coloured to highlight innate immune genes (red) and genes related to the Th17 signature (grey). TFBS, transcription factor binding site.
To identify potential mechanisms through which vedolizumab induces clinical efficacy, we analysed the set of 763 genes differentially expressed in response to vedolizumab and linked to achievement of clinical remission (figure 6A). Interestingly, the overwhelming number of genes was downregulated in response to vedolizumab treatment (figure 6B), indicating a strong inhibitory effect on immune pathways. GO-term analysis and transcription factor binding site (TFBS) analysis of the top 250 downregulated genes revealed highly significant enrichment for the terms ‘innate immune response’ and ‘inflammatory response’. TFBS enrichment analysis demonstrated significant enrichment for NF-κB and the myeloid transcription factor SPI1 (figure 6C). Of note, we did not find significant GO-term or TFBS enrichment for the set of 77 upregulated genes. We further aimed to describe the gene network involved in the vedolizumab-induced signature of clinical remission. Intriguingly, STRING-based network inference of the top 250 downregulated genes demonstrated key hubs around chemokines (CXCL1, CXCL2, CXCL3, CXCL10), chemokine receptors (eg, CXCR1, CXCR2, CXCR5, CCR3), innate immune receptors (TLR2, TLR6, NOD2), innate cytokines and their receptors (CSF3, CSF3R, CSF2RB), regulators of innate effector function (DUOX2, NCF1, PI3, RAC2, TREM1) and other genes involved in the regulation of innate immunity (FPR1, MEFV, MNDA) (figure 6D). This indicates that the therapeutic efficacy of α4β7 targeting is associated with a strong downregulation of an innate immune signature, consistent with results of GO term analysis. Moreover, we found altered expression of genes associated with the T helper (Th) 17 signature (eg, IL17A, IL23A, IL21R), suggesting potential direct or indirect effects of vedolizumab on this subgroup of T cells (figure 6D).
We further aimed to evaluate whether vedolizumab-induced transcriptional changes are specifically attributed to vedolizumab treatment or rather reflect a transcriptional signature common to patients who achieve clinical remission, independent of the specific drug used to induce remission. We therefore compared the mucosal transcriptome of vedolizumab-treated patients with IBD with those treated with infliximab (n=15, 9 UC, 6 CD) (online supplementary table S1). Among infliximab-treated patients, 11 achieved clinical remission, whereas 4 did not. In total, we found 65 genes (12 upregulated, 53 downregulated) to be associated with achievement of clinical remission in the infliximab group (online supplementary table S9). Among the 53 downregulated genes, only 29 were found to overlap with the 1074 genes downregulated in response to vedolizumab (online supplementary figure S7 and table S10). Together, these data demonstrate that the overwhelming majority of genes that were downregulated in response to vedolizumab indeed showed a unique attribution to the specific treatment type.
Supplemental material
RNA-Sequencing (RNA-Seq) demonstrated vedolizumab-induced alterations in innate immunity that were linked to therapeutic efficacy. Since our FACS analysis was tailored towards to identification of vedolizumab-induced alterations in adaptive immunity, these data did not allow to characterise the cellular origin of vedolizumab-induced changes in innate gene expression. We therefore pursued a computational approach based on RNA-Seq data of whole colonic biopsies to more comprehensively study potential vedolizumab-induced alterations in intestinal leucocyte composition. To this end, we used CIBERSORT, an approach that allows for RNA-based approximation of the relative abundance of a wide variety of leucocyte subsets within complex tissues.27 Cell deconvolution using CIBERSORT showed substantial representation of myeloid cells including macrophages, dendritic cells and granulocytes among lamina propria leucocytes (figure 7A). In accordance with flow cytometry-based immunophenotyping, the inferred relative abundance of CD4+ and CD8+ T cells, B cells and plasma cells was not affected by vedolizumab (online supplementary figure S8A–D). Similarly, subsets of CD4+ T cells including resting and activated memory T cells, follicular helper T cells and regulatory T cells (Treg) did not exhibit alterations in relative abundance in response to vedolizumab (online supplementary figure S8E–H). The unaffected Treg signature (online supplementary figure S8H) is in accordance with an unaltered relative abundance of mucosal (online supplementary figure S1D) and peripheral blood (online supplementary table S4) CD25+ T cells by FACS and suggests that vedolizumab treatment does not have a major impact on the abundance of intestinal Treg cells. As such, these data do not support previous findings of α4β7-dependent Treg homing in a humanised mouse model.49 However, in line with the observation of predominant changes in innate immunity on α4β7 targeting, vedolizumab was associated with reduced relative abundance of M1 macrophages and increased abundance of M2 macrophages together leading to a switch from an M1 to an M2-based macrophage profile (figure 7B–D). These alterations were specific to patients who achieved vedolizumab-induced clinical remission and were thus again linked to therapeutic efficacy (figure 7E,F). Moreover, the switch in the M1/M2 ratio was specific to vedolizumab and not observed in patients who received the anti-TNFα antibody infliximab (online supplementary figure S9). Among other myeloid populations, infliximab but not vedolizumab was associated with an increase in the relative abundance of resting dendritic cells, while granulocytes and mast cells were not affected by any of the two treatments (online supplementary figure S10).
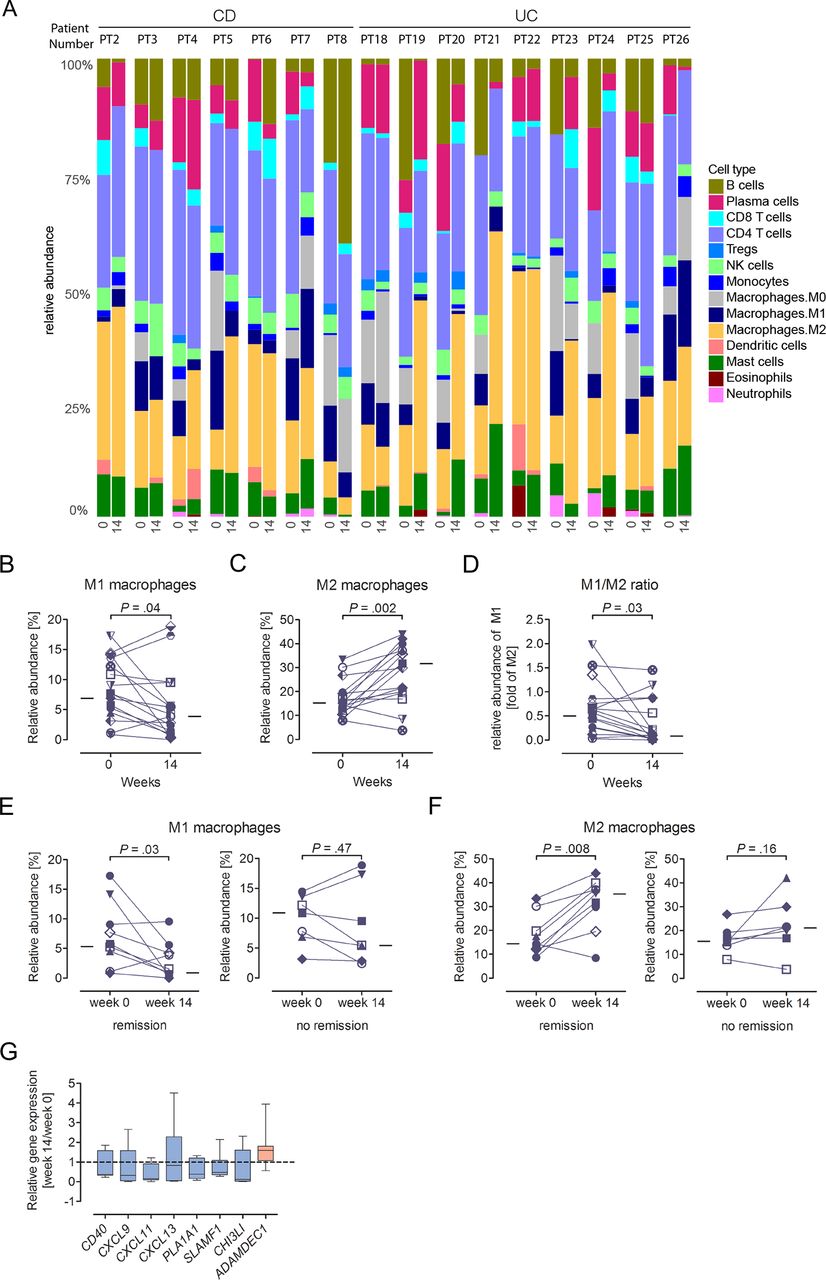
Vedolizumab is associated with alterations in innate immunity. (A–F) Relative abundance of the indicated cell types among intestinal leucocytes (A–C, E–F) and M1/M2 macrophage ratio (D) as determined by CIBERSORT. Analysis before treatment (‘0’) and after 14 weeks of vedolizumab (‘14’) is shown for matched data of individual patients. In B–F, the median of all patients at the respective time point is indicated by a line. (G) Vedolizumab-induced alterations in genes associated with the macrophage signature (CIBERSORT). Median (line), first/third quartiles (boxes) and range are shown and are based on the ratio of individual week 14/week 0 expression of 16 vedolizumab-treated patients. Genes downregulated in expression in response to vedolizumab are indicated in blue, those upregulated in red. CD, Crohn’s disease; UC, ulcerative colitis.
Importantly, several macrophage-associated genes regulated by vedolizumab play critical roles in the regulation of inflammation suggesting that vedolizumab-induced alterations in the M1/M2 macrophage ratio indeed contribute to resolution of intestinal inflammation. As such, macrophage-associated genes downregulated in response to vedolizumab included the costimulatory molecule CD40,50 chemokines (CXCL9, CXCL11, CXCL13), phospholipase A1 member A (PLA1A1), which is increased in expression in CD and contributes to the production of proinflammatory lysophospholipids,51 signalling lymphocytic activation molecule (SLAM/SLAMF1), which contributes to myeloid-derived inflammatory cytokine production,52 and proinflammatory chitinase 3-like-1 (CHI3L1,53) (figure 7G). In contrast, we observed increased expression of ADAMDEC1, a disintegrin and metalloproteinase (ADAM) family member that inhibits intestinal inflammation54 (figure 7G). In conclusion, comprehensive and unbiased analysis of the intestinal transcriptome revealed pronounced vedolizumab-induced alterations in innate immunity that were closely associated with achievement of clinical remission, while treatment-induced changes in adaptive immunity were minor and limited to the Th17 signature.
Discussion
Vedolizumab is approved for the treatment of CD and UC and is believed to elicit its beneficial effects on intestinal inflammation through interference with T cell trafficking.55 56 However, human data to support this mechanism of action are limited. Here, we performed a longitudinal analysis of alterations in mucosal and systemic immunity in response to anti-α4β7 antibody treatment. Surprisingly, we observed only minor effects of vedolizumab on the abundance and activation of intestinal T cells, the colonic TCR repertoire and the intestinal trafficking of labelled leucocytes. In contrast, vedolizumab elicited substantial alterations in innate immunity, which were tightly linked to clinical efficacy of α4β7 targeting.
Previous work in animal models of intestinal inflammation revealed rapid effects of the α4β7 antibody Act-1 on intestinal immune cells, which were not specific to T cells.7 These data were difficult to reconcile with a concept in which α4β7 antibodies solely act through interference with T cell homing to the intestine. Indeed, the authors suggested that alterations in integrin signalling may contribute to the therapeutic efficacy of Act-1.7 In addition, while subsets of CD4+ memory T cells express the highest levels of α4β7 among PBMCs, various other lymphoid and myeloid immune cell populations also express α4β7.57 Effects of α4β7 targeting may therefore extend beyond the T cell compartment. In accordance with this notion, recent work in mice has demonstrated that protective effects on colitis associated with genetic deletion of β7 are preserved and indeed pronounced in the absence of mature T and B cells.13 Schippers et al demonstrated that these protective effects result from interference with colonic recruitment of proinflammatory monocytes, thus serving as a mechanistic explanation for T cell-independent protective effects associated with α4β7 blockade.13 In line with this work, others have recently described a critical role of α4β7 in the regulation of dendritic progenitor cell trafficking to the intestine.12 14 16 Together, these data have demonstrated that inhibition of intestinal inflammation on blockade of α4β7 may not necessarily result from interference with intestinal T cell trafficking but rather from targeting of the innate immune system. Consistent with these findings in animal models, we observed substantial vedolizumab-induced alterations in innate immunity in patients with IBD, including changes in the expression of pattern recognition receptors, chemokines and innate effector molecules. While vedolizumab had little impact on the abundance and phenotype of intestinal T cells, it was associated with pronounced changes in the myeloid compartment and particularly macrophage populations. These effects were specific to α4β7 targeting and not observed in patients who received anti-inflammatory treatment with the TNFα antibody infliximab. Furthermore, the association of this innate immune signature with achievement of clinical remission suggested a causal contribution of vedolizumab-induced reprogramming of innate immunity to the therapeutic efficacy of α4β7 targeting. As such, our data support recent findings in animal models and suggest that the therapeutic efficacy of vedolizumab may predominantly originate from targeting of the innate immune system.
It is important to note that our data do not exclude effects of vedolizumab on lamina propria T cells. We conducted an observational study without predefined primary and secondary endpoints and it is possible that such effects may have not reached statistical significance in our analysis or may selectively affect subgroups of T cells not investigated in this study. Indeed, RNA sequencing of colonic biopsies showed vedolizumab-induced alterations in the Th17 signature, which may indicate targeting of the Th17 subset of lamina propria T cells.57 58 However, flow cytometry, TCR repertoire analysis, RNA sequencing and immunohistochemical staining for T cells consistently demonstrated the absence of major vedolizumab-induced alterations in lamina propria T cell abundance, T cell activation and the TCR repertoire. These results are in line with more recent data in mice demonstrating unimpaired intestinal T cell abundance and activation on antibody-mediated α4β7 blockade or genetic deletion of β7, both under constitutive conditions as well as in the context of dextran sodium sulfate-induced intestinal inflammation.15 Furthermore, our findings are in line with recent work in rhesus macaques, which demonstrated unaltered numbers of α4+ CD4+ T cells in the rectal mucosa after treatment with a simianised anti-α4β7 antibody.11 Together, these data indicate that α4β7 plays a limited role in the regulation of intestinal T cell trafficking in humans or that inhibition of its function can be compensated by other mechanisms. In line with this notion, previous work in mice has suggested that trafficking of CD8+ T cells to Peyer’s patches is more strictly dependent on β7 compared with migration of CD8+ T cells to the lamina propria.59 Moreover, synergistic actions between α4β7 and other adhesion molecules such as L-selectin have been described in the regulation of intestinal T cell trafficking and the promotion of intestinal inflammation and have demonstrated that combined interference with both pathways is associated with considerably increased inhibition of T cell trafficking and inflammation compared with individual blockade of these pathways.60 61
In conclusion, our results suggest significant and previously unrecognised effects of α4β7 integrin targeting on mucosal innate immunity that likely contribute to the therapeutic efficacy of vedolizumab in intestinal inflammation.
Supplemental material
References
Footnotes
SZ, ER, CMD and KA contributed equally.
PCR, AF and SS contributed equally.
Contributors SZ, KA, CMD and ER wrote the manuscript with input from all coauthors. AA, KA, JB, BS, CC, ME, SN, SS, DS and SZ contributed to patient recruitment. UL, MM and MZ performed In-labelling of leucocytes and SPECT. A Strigli conducted immunohistochemical analyses. AA, JB, ME and SZ performed endomicroscopy. CMD, HE, SCK and MFP conducted immunophenotyping. ER and AF performed TCR sequencing. KA, WHP, NH, A Sinha and PR performed RNA sequencing. SZ, AF, PR, DK and SS coordinated the study.
Funding Work was supported by the Deutsche Forschungsgemeinschaft (DFG) (ZE814/4-1 and SCHR 512/14-1), the European Research Council (ERC Starting Grant agreement no. 336528, to SZ), the H2020 SYSCID program under the grant agreement no. 733100, the BMBF as part of the e:Med framework (‘sysINFLAME’, grant 01ZX1306), SysMedIBD EU FP7 under grant agreement no. 305564 and the DFG Excellence Clusters ExC306 ‘Inflammation at Interfaces’ (SS, AF, DK, PR, SS, SZ) and ‘Center for Regenerative Therapies’ (SZ).
Competing interests SZ: consulting fees: Biogen, Ferring, Janssen-Cilag, Takeda; Lecture fees: Abbvie, Falk, Ferring, MSD, Roche, Takeda. KA: grant support: Pfizer. AA: consulting fees: Boston Scientific; lecture fees: Boston Scientific. SS: consulting fees: AbbVie, Boehringer, Merck, Janssen, Pfizer, Takeda; lecture fees: AbbVie, Boehringer, Merck, Janssen, Pfizer, Takeda.
Patient consent Obtained.
Ethics approval The ethics committee of the Christian-Albrechts-Universität zu Kiel approved the study (A 124/14).
Provenance and peer review Not commissioned; externally peer reviewed.