Article Text

Abstract
Objective Cisplatin is a widely used gastric cancer (GC) chemotherapy; however, genetic factors regulating GC responses to cisplatin remain obscure. Identifying genes regulating cisplatin resistance could aid clinicians in tailoring treatments, by distinguishing cisplatin sensitive patients from those who might benefit from alternative platinum therapies, and highlight novel targeted strategies for overcoming cisplatin resistance. Here integrated epigenomics is applied to identify genes associated with GC cisplatin resistance.
Design 20 GC cell lines were subjected to gene expression profiling, DNA methylation profiling and drug response assays. The molecular data were integrated to identify genes highly expressed and unmethylated specifically in cisplatin-resistant lines. Candidate genes were functionally tested by several in vitro and in vivo assays. Clinical impact of candidate genes was also assessed in a cohort of 197 GC patients.
Results Epigenomic analysis identified bone morphogenetic protein 4 (BMP4) as an epigenetically regulated gene highly expressed in cisplatin-resistant lines. Functional assays confirmed that BMP4 is necessary and sufficient for the expression of several prooncogenic traits, likely mediated through stimulation of the epithelial-mesenchymal transition. In primary tumours, BMP4 promoter methylation levels were inversely correlated with BMP4 expression, and patients with high BMP4-expressing tumours exhibited significantly worse prognosis. Therapeutically, targeted genetic inhibition of BMP4 caused significant sensitisation of GC cells to cisplatin. Notably, BMP4-expressing GCs also did not exhibit cross resistance to oxaliplatin.
Conclusions BMP4 epigenetic and expression status may represent promising biomarkers for GC cisplatin resistance. Targeting BMP4 may sensitise GC cells to cisplatin. Oxaliplatin, a clinically acceptable cisplatin alternative, may represent a potential therapeutic option for BMP4-positive GCs.
- Gastric cancer
- cisplatin
- BMP4
- DNA methylation
- carcinogenesis
- gastric pre-cancer
- gastric carcinoma
- gene expression
- gene mutation
Statistics from Altmetric.com
- Gastric cancer
- cisplatin
- BMP4
- DNA methylation
- carcinogenesis
- gastric pre-cancer
- gastric carcinoma
- gene expression
- gene mutation
Significance of this study
What is already known about this subject?
-
Cisplatin (cis-diamminedichloroplatinum(II)) is a widely used chemotherapeutic agent to treat several gastrointestinal cancers, including gastric cancer (GC).
-
Recent studies have shown that combining gene expression with DNA methylation data (epigenomics) can highlight functionally important genes in cancer drug response.
What are the new findings?
-
Bone morphogenetic protein 4 (BMP4) is identified as an epigenetically regulated gene highly expressed in cisplatin-resistant GC cell lines.
-
Experimental assays reveal that BMP4 drives multiple aspects of GC progression.
-
BMP4 is a marker of poor patient prognosis.
-
Targeting BMP4 sensitises GC cells to cisplatin.
-
BMP4-high GCs do not exhibit cross resistance to oxaliplatin.
How might it impact on clinical practice in the foreseeable future?
-
Targeting BMP4 may represent a promising therapeutic strategy for sensitising GC cells to cisplatin.
-
Oxaliplatin, a clinically acceptable cisplatin alternative, may represent a therapeutic option for BMP4-positive GCs.
Introduction
Gastric adenocarcinoma, or gastric cancer (GC), is the second leading cause of global cancer mortality, accounting for 700 000 deaths annually.1 Most patients with GC present with advanced stage disease and for patients with operable cancers combination surgery and chemotherapy regimens are indicated resulting in overall 5-year survival rates of around 30%.1 Among chemotherapies, cisplatin [cis-diamminedichloroplatinum(II)] is a platinum-based DNA-binding drug widely used to treat gastrointestinal cancers. Cisplatin forms intrastrand and interstrand cross links between purines, and these platinum-DNA adducts are recognised by high-mobility group and DNA damage response proteins,2 resulting in double-stranded DNA breaks and impairment of replication and gene expression. Early studies evaluating cisplatin as a single agent in GC reported response rates of about 20%.3 More recently, cisplatin-based regimens such as ECF (epirubicin/cisplatin/fluorouracil) and DCF (docetaxel/cisplatin/fluorouracil) have demonstrated improved response rates (49–56%) and 5-year survival.4 Cisplatin is thus likely to remain a standard-of-care GC treatment for the foreseeable future.
Previous research has shown that different cancers can use a wide variety of mechanisms to elicit cisplatin resistance. These include reducing local drug concentrations (decreased drug import, increased detoxification and increased drug efflux)5 and alterations in the expression of mismatch repair and nucleotide excision repair (NER) proteins.2 In GC, high NER (ERCC1, ERCC2, GSTP1, XRCC1) and DNA-damage protein expression (TP53, GADD45A) have been negatively associated with cisplatin response,6 ,7 while vascular endothelial growth factor (VEGF) positivity may be associated with cisplatin sensitivity.6 Signalling pathways such as nuclear factor κB, c-ABL, c-Jun N-terminal kinase and p73 have also been implicated in cisplatin response.8 However, to date, there are no established approaches for accurately identifying which patients with GC are most likely to respond to cisplatin prior to treatment.
Aberrant patterns of DNA methylation, commonly observed in many human cancers, have been recently proposed as molecular markers for predicting patient prognosis and chemotherapy sensitivity.9–11 For instance, O6-methylguanine-DNA methyltransferase (MGMT) methylation may predict sensitivity to 1,3-bis(2-chloroethyl)-1-nitrosourea (BCNU) in gliomas, and in colorectal cancer WRN (Werner syndrome gene) methylation has been associated with good clinical responses to camptothecin. In GC and oral cancers, CHFR (checkpoint with FHA and RING finger) methylation may predict sensitivity to microtubule inhibitors, while TMS1 and DAPK methylation are associated with GC responses to 5-flourouracil (5-FU) therapy.10 ,12 ,13 Here, we performed an integrated epigenomic analysis aimed at pinpointing critical genes regulating GC cisplatin sensitivity and resistance. By combining genome-wide expression data with epigenetic profiles of >800 cancer-related genes, we found that hypermethylation of bone morphogenetic protein 4 (BMP4) and associated BMP4 gene silencing were strongly correlated with sensitivity to cisplatin.
Materials and methods
GC cell lines
GC cell lines AGS, KATO III and Hs746T were obtained from the American Type Culture Collection (ATCC). FU97, Ist1, MKN1, MKN7, MKN74, MKN28, MKN45, IM95, TMK1 and AZ521 cells were obtained from the Japan Health Science Research Resource Bank. SCH cells were obtained from Yoshiaki Ito (Cancer Sciences Institute of Singapore, Singapore). YCC1, YCC3, YCC7, YCC10, YCC11 and YCC16 cells were obtained from Sun Young Rha (Yonsei Cancer Centre (YCC), South Korea). All cell lines were tested and authenticated by the respective cell line bank (ATCC, Japan Health Science Research Resource Bank) or originating institution (YCC) by DNA fingerprinting and cytogenetics.
Clinical samples
Primary gastric tissues were obtained from the Singhealth Tissue Repository or National University Hospital Singapore Tissue Repository following approval from Institutional Research Ethics Review Committees, and with patient-informed consent. Descriptions of the patient characteristics in this cohort are provided in online supplementary table S1. Patients were categorised into separate disease stages according to the American Joint Committee on Cancer (sixth edition).
Additional experimental procedures are provided in the online supplementary Information.
Results
GC cell lines exhibit differential sensitivities to cisplatin treatment
To explore the in vitro responses of GC cell lines to cisplatin, we treated 20 GC cell lines with increasing concentrations of cisplatin, from 0.1 μM to 1 mM.14 ,15 For each line, we determined the cisplatin GI50, referring to the concentration of cisplatin required to cause 50% growth inhibition at 48 h. We observed striking variations in the levels of cisplatin sensitivity between different lines (figure 1A). From YCC11 cells exhibiting the greatest cisplatin sensitivity (mean GI50=1.5 μM) to AGS cells being the most resistant (mean GI50=126 μM), there was a GI50 difference of approximately 100-fold. Similar results were observed when the drug incubation times were extended from 48 to 72 h (p≤0.001; online supplementary figure S1). These results indicate that distinct GC cell lines can exhibit varying sensitivities to cisplatin in vitro.

(A) Cisplatin effects on proliferation. Cells were treated with 10-fold increasing concentrations of cisplatin for 48 h. At least three independent experiments were conducted per line. Y-axis: |log10GI50|, referring to the negative log 10 of absolute GI50 values in molar concentration (mean from three independent experiments). Blue and red colour bars: cisplatin-sensitive and cisplatin-resistant cell lines; X-axis: standard deviation of |log10GI50| across cell lines. (B) Cisplatin-mediated caspase-3 activation. High content screening images of cell lines treated with cisplatin at the median GI50 concentration (median GI50 concentration across all tested cell lines). Cells were stained for cleaved caspase-3 (pink) and hoeshst (blue) after 48 h of treatment. YCC11, SCH—sensitive lines; AGS, AZ521—resistant lines. White arrowheads indicate cells with active caspase-3. See close-up inset (×25 magnification). (C) Correlation of cisplatin-induced proliferation inhibition with capase-3 activation. (Upper graph) Cisplatin-sensitive (blue bars) and cisplatin-resistant cell line subgroups (red bars) ranked by observed proliferation inhibition. Y-axis: |log10GI50|. (Bottom graph) The same cell line groups (sensitive and resistant) ranked by extent of cisplatin-stimulated caspase-3 activation. In both cases, a significant difference between the cisplatin-sensitive and cisplatin-resistant subgroups was observed. GI50, the concentration of cisplatin required to cause 50% growth inhibition at 48 h.
Cell growth inhibition caused by cisplatin might be due to cell death (apoptosis), cell cycle arrest or senescence. To distinguish between these possibilities, we used high-content screening, a technology allowing biological responses to be measured at the single-cell level, to quantify levels of caspase-3 activation in GC cells after cisplatin. We quantified five distinct morpho-cellular parameters for cisplatin-induced alterations—caspase-3 activation, nuclear size, nuclear condensation, nuclear morphology and nuclear ellipticity. Significantly higher caspase-3 activation levels were observed in lines defined as cisplatin sensitive by their GI50 values (blue lines in figure 1A) compared with cisplatin-resistant lines (red lines, p=0.005; figure 1B,C). Significant changes in nuclear ellipticity were also observed in the top four sensitive lines compared with resistant lines after cisplatin treatment (p=0.031; online supplementary figure S2), which were inversely correlated to caspase-3 activation (R=−0.51, p=0.027). Inhibition proliferation by cisplatin is thus significantly associated with apoptosis induction in GC. However, we did not observe significant differences in baseline proliferation rates between cisplatin sensitive and resistant lines (online supplementary figure S3), consistent with previous findings that absolute cell cycle rate is not a good predictor of cisplatin response.16
Integrative epigenomics identifies BMP4 as a candidate determinant of cisplatin sensitivity
To identify candidate genes associated with cisplatin resistance, we compared gene expression profiles of the top four sensitive and resistant lines. Using linear models for microarray data (LIMMA), a modified t test incorporating the Benjamini Hochberg multiple hypotheses correction technique (see online supplementary methods), we identified 291 genes differently expressed between sensitive and resistant lines (p≤0.01; figure 2A): Genes upregulated in cisplatin-resistant lines included ERCC2 and ERCC5, two components of the NER pathway previously implicated in cisplatin resistance,17 ,18 and PPP1R13L, which has been shown to confer resistance to cisplatin and ultraviolet-induced apoptosis.19 Reciprocally, genes upregulated in the cisplatin-sensitive lines were significantly associated with cellular transport processes (gene ontology (GO): 006810, p=2.13×10⁻⁴).
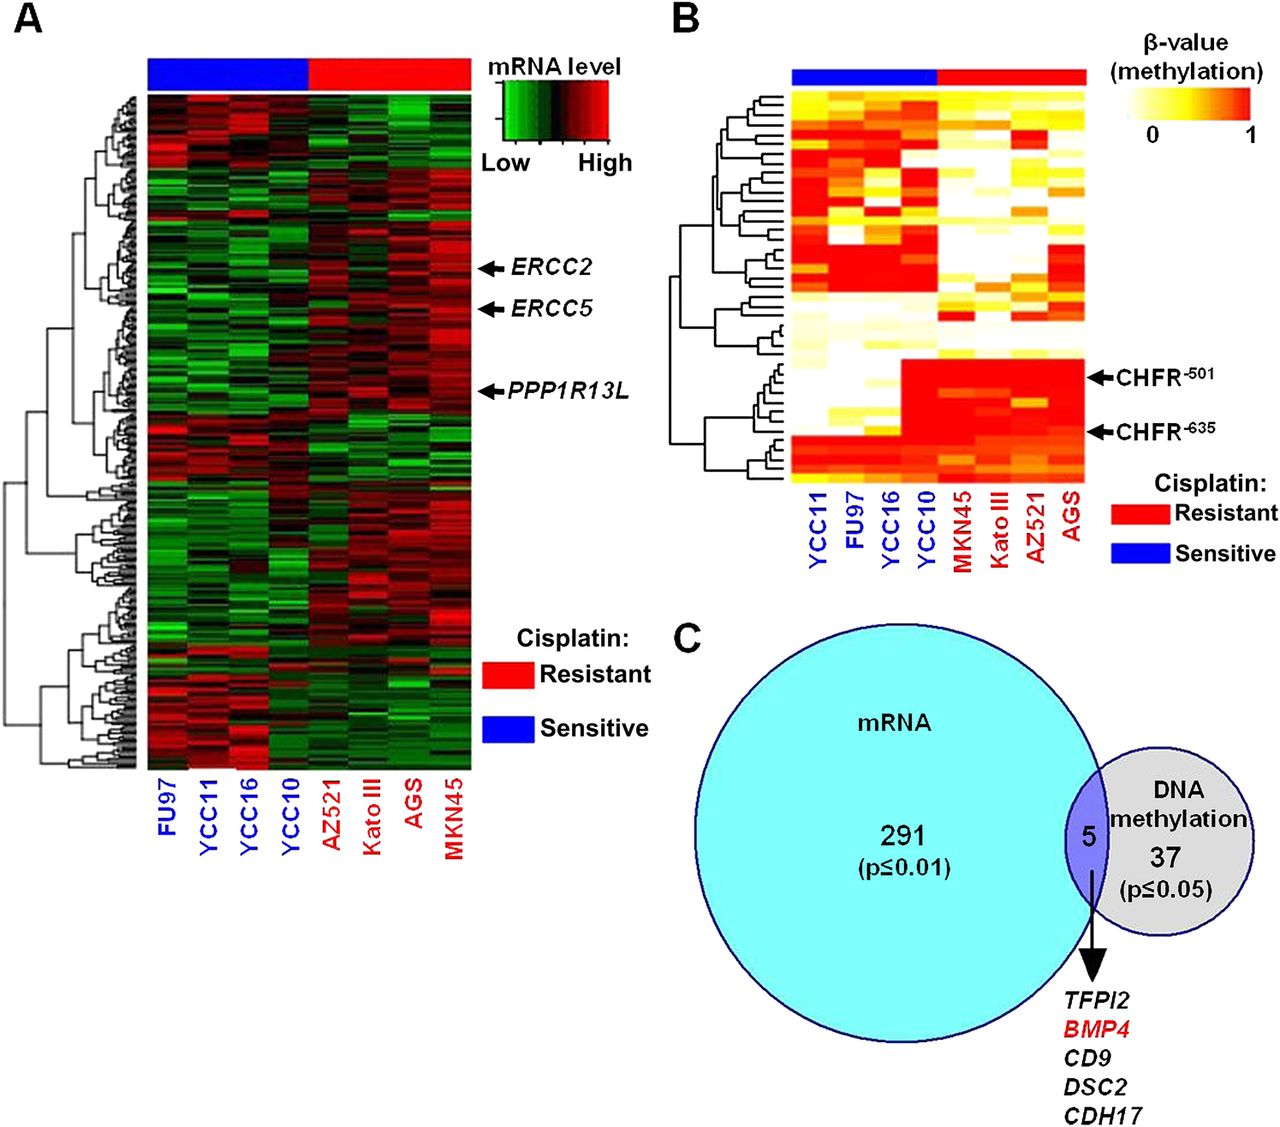
(A) Gene expression heat map representing genes differentially expressed between cisplatin-sensitive (blue columns) and cisplatin-resistant lines (red columns). Individual rows are genes. Arrows indicate genes previously identified to mediate cisplatin resistance (PPP1R13L, ERCC2, ERCC5). (B) DNA methylation heat map representing differentially methylated CpG sites between cisplatin-sensitive (blue columns) and cisplatin-resistant lines (red). Each row represents a distinct CpG probe. Arrows highlight probes associated with the CHFR (checkpoint with FHA and RING finger) gene, previously implicated in chemotherapy response in gastric cancer. (C) Venn diagram of gene overlap between transcriptomic and epigenetic signatures. The blue circle represents differentially expressed genes (291) and grey circles represent differentially methylated genes (37). Five genes are found in the Venn intersect. The bone morphogenetic protein 4 (BMP4) gene is highlighted in red.
The identification of several hundred genes (∼300) exhibiting differential expression patterns between sensitive and resistant lines motivated us to integrate additional molecular criteria to nominate bona fide cisplatin resistance genes. We thus considered the process of DNA methylation.11 Using GoldenGate methylation arrays (Illumina, San Diego, CA, USA), we quantified CpG methylation levels at 1505 CpG sites corresponding to 807 genes across the lines. On the methylation array, CpG probes are named relative to the transcription start site (TSS) of a gene. For example, probe MGMT P281 refers to a CpG probe –281 bp from the MGMT TSS. We observed methylation of several genes previously reported as methylated in GC, including MGMT (YCC10, TMK1, Hs746T), MLH1 (IM95) and APC (all cell lines except AZ521 and Hs746T).20 To validate the GoldenGate platform results, we performed bisulphite sequencing analysis on three genes exhibiting variable cell line methylation—APC (P14), BRCA1 (P835) and S100A2 (P1186). Bisulphite sequencing confirmed that CpG probes with β values >0.2 were consistently associated with increased DNA methylation (online supplementary figure S4). The cell lines were also profiled in duplicate on the GoldenGate methylation platform (experimental replicates). A comparison of the replicate methylation profiles across 1505 CpG loci revealed extremely high correlation and reproducibility (mean R=0.98–0.99) (online supplementary figure S5). Because of this high degree of concordance, individual cell line profiles were used for subsequent analysis.
Using LIMMA, we identified CpG probes differentially methylated between the top four cisplatin sensitive lines (YCC10, YCC16, YCC11, FU97) and the top four resistant lines (AGS, MKN45, AZ521, Kato III). Forty-one CpG probes were differently methylated between the two groups, corresponding to 37 genes (p≤0.05 after multiple hypothesis correction) (figure 2B). Twenty-seven probes (66%) were associated with CpG islands in promoter proximal regions, while the remaining 14 probes were associated with non-CpG island regions. Two CpG probes exhibiting increased methylation in resistant lines were associated with CHFR, a gene previously associated with microtubule inhibitor response in GC.10 We then intersected the companion lists of differentially expressed and differentially methylated genes. We identified five genes that were both differently methylated and differentially expressed between the cisplatin-sensitive and cisplatin-resistant groups (BMP4, CD9, DSC2, CDH17 and TFPI2) (figure 2C and online supplementary table S2).
We decided to focus on one of these genes for further characterisation—BMP4, a member of the bone morphogenetic protein family. BMP4 methylation at CpG sites –199 (BMP4−199 ) and –123 (BMP4−123 ), both lying in CpG islands, were inversely correlated with BMP4 expression in the initial panel of eight sensitive and resistant lines (p=0.003 and 0.01, respectively; online supplementary figure S6A) and also across the 20 cell line panel (p=0.0001 and 0.023, respectively; online supplementary figure S6B). BMP4−199 and BMP4−123 methylation were significantly correlated to one another (p<0.001; online supplementary figure S6C), however BMP4−199 methylation exhibited a stronger correlation with BMP4 gene expression than the BMP4−123 site (see Discussion). BMP4−199 and BMP4−123 methylation were inversely correlated with cisplatin resistance in the GC lines (p<0.05 for both sites). BMP4 expression levels were also positively correlated with cisplatin resistance (p=0.0008; online supplementary figure S7).
BMP4 methylation and transcriptional silencing in cisplatin-sensitive lines
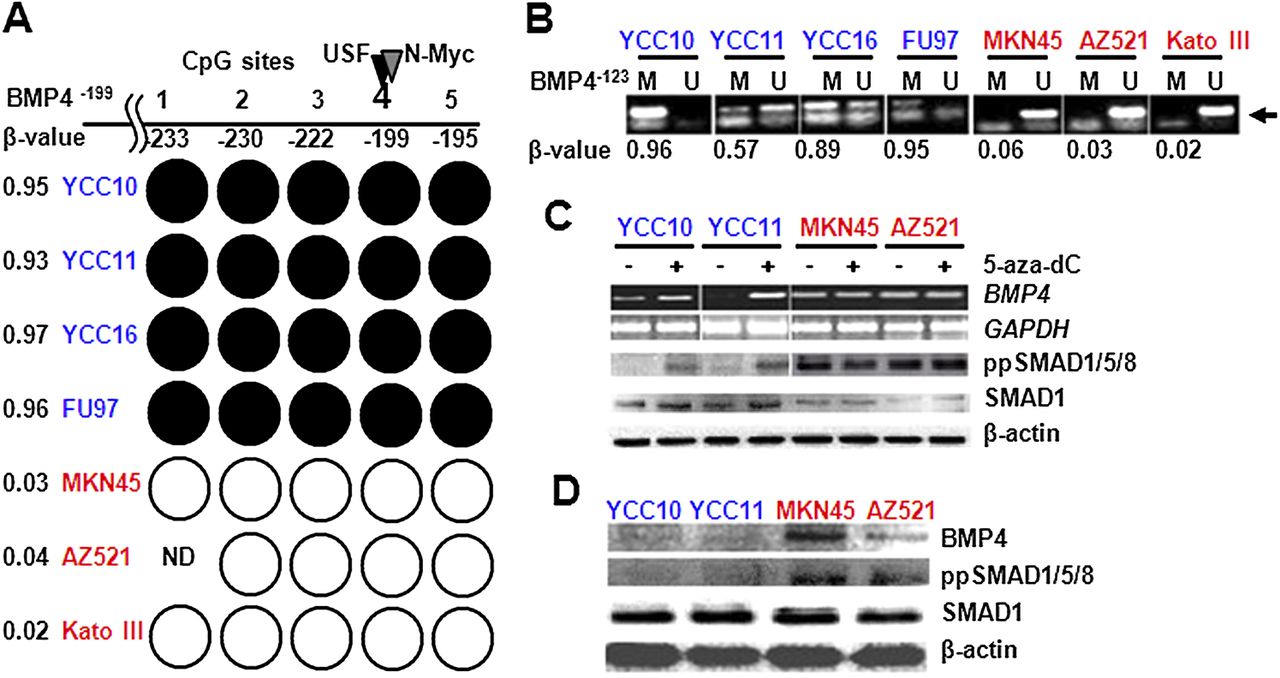
To confirm BMP4 as a differentially methylated gene, we performed targeted methylation analysis of the BMP4 gene promoter. Bisulfite sequencing of the BMP4−199 region confirmed that all five CpG sites within the region were fully methylated in cisplatin-sensitive lines (YCC10, YCC11, YCC16, FU97) but unmethylated in cisplatin-resistant lines (MKN45, AZ521, Kato III; figure 3A, online supplementary figure S8). Similarly, methyl-specific PCR (MS-PCR) analysis of the BMP4−123 confirmed BMP4 methylation in cisplatin-sensitive lines (YCC10, FU97, YCC11, YCC16) but not in cisplatin-resistant lines (MKN45, AZ521, Kato III; figure 3B). Interestingly, AGS cells, which are cisplatin resistant and express high levels of BMP4, exhibited BMP4 promoter methylation. However, subsequent analysis by array-CGH revealed that AGS cells exhibit genomic amplification of the BMP4 gene (online supplementary figure S9), suggesting that BMP4 genomic amplification may override the repressive effects of BMP4 promoter methylation. For these reasons, we excluded AGS cells from subsequent analysis.

(A) Bisulphite sequencing analysis of the bone morphogenetic protein 4 (BMP4)−199 CpG island. Each circle indicates an individual CpG site in the island numbered relative to the transcriptional start site (TSS). Black circles: fully methylated; white circles: fully unmethylated; blue cell lines: cisplatin sensitive; red lines: cisplatin resistant; ND, not done. Position –199 corresponds to the BMP4−199 probe from the GoldenGate DNA methylation array. Black and grey triangles above site –199 correspond to predicted USF and N-myc binding sites. Numbers on the left are the methylation β value taken from the methylation array. (B) Methyl-specific PCR analysis of the BMP4−123 CpG site. Lanes M and U: amplified products using primers recognising methylated or unmethylated sequences, respectively. Blue cell lines: cisplatin sensitive; red lines: cisplatin resistant. Methylation array β values for the BMP4−123 CpG probes are shown in the bottom row and indicated by the arrow. (C) BMP4 expression after treatment with demethylating agents. Top panel: BMP4 expression before and after 5-aza-dC treatment measured by reverse transcriptase PCR in cisplatin-sensitive (blue) and cisplatin-resistant lines (red). Second panel: glyceraldehyde 3-phosphate dehydrogenase (GADPH) was used as a loading control. Third and fourth panel: BMP4 pathway status in cisplatin-sensitive and cisplatin-resistant lines before and after 5-aza-dC treatment measured using ppSMAD1/5/8 and SMAD1 antibodies. Fifth panel: β-actin was used as a protein loading control. (D) BMP4 expression and BMP pathway status. Top panel: BMP4 protein expression in cisplatin-sensitive (blue) and cisplatin-resistant (red) lines. Second and third panels: relative expression of ppSMAD1/5/8 and SMAD1. Bottom panel: β-actin was used as a protein loading control.
To investigate whether BMP4 promoter methylation might regulate BMP4 gene expression, we treated the GC lines with 5-aza-2′-deoxycitidine, a chemical inhibitor of DNA methyltransferases. In cisplatin-sensitive lines YCC10 and YCC11 where the BMP4 promoter is methylated, BMP4 transcripts were upregulated after 5-aza-dC treatment (figure 3C). We also directly assessed the CpG methylation status of the BMP4 promoter in these BMP4-methylated lines before and after 5-azadC treatment, by bisulphite genomic sequencing (online supplementary figure S10). 5-aza-dC effectively removed methylation from the BMP4−199 and BMP4−123 CpG sites in YCC10 and YCC11 cells, with promoter demethylation levels being well correlated with BMP4 expression levels (online supplementary figure S11). Supporting the biological relevance of this BMP4 upregulation, we also observed increased phosphorylation of BMP pathway downstream targets such as SMAD1/5/8 after 5-aza-dC treatment (figure 3C). In contrast, 5-aza-dC treatment did not alter BMP4 expression in the resistant cell lines MKN45 and AZ521 where the BMP4 promoter is unmethylated and BMP4 is already highly expressed (figure 3C and online supplementary figure S11). Moreover, cisplatin-resistant lines (MKN45 and AZ521) also exhibited constitutive activation of BMP signalling as measured by phosphorylated SMAD1/5/8, which was not affected by 5-aza-dC treatment (figure 3D). These results indicate that BMP4 promoter methylation is likely to regulate BMP4 expression, and that baseline high levels of BMP4 expression in cisplatin-resistant lines are sufficient to cause activation of BMP signalling pathway downstream components.
BMP4 expression enhances multiple pro-oncogenic traits in GC cells
BMP4 has been shown to positively regulate proliferation and apoptosis resistance in breast, pancreatic, liver and colon cancers,21–23 but also to inhibit glioblastoma, multiple myeloma and lung cancers,24 ,25 suggesting that the role of BMP4 in tumourigenesis is likely tissue specific. To ask if BMP4 might play a pro-oncogenic or anti-oncogenic role in GC, we genetically manipulated BMP4 expression in different GC cell lines and studied their resultant phenotypes.
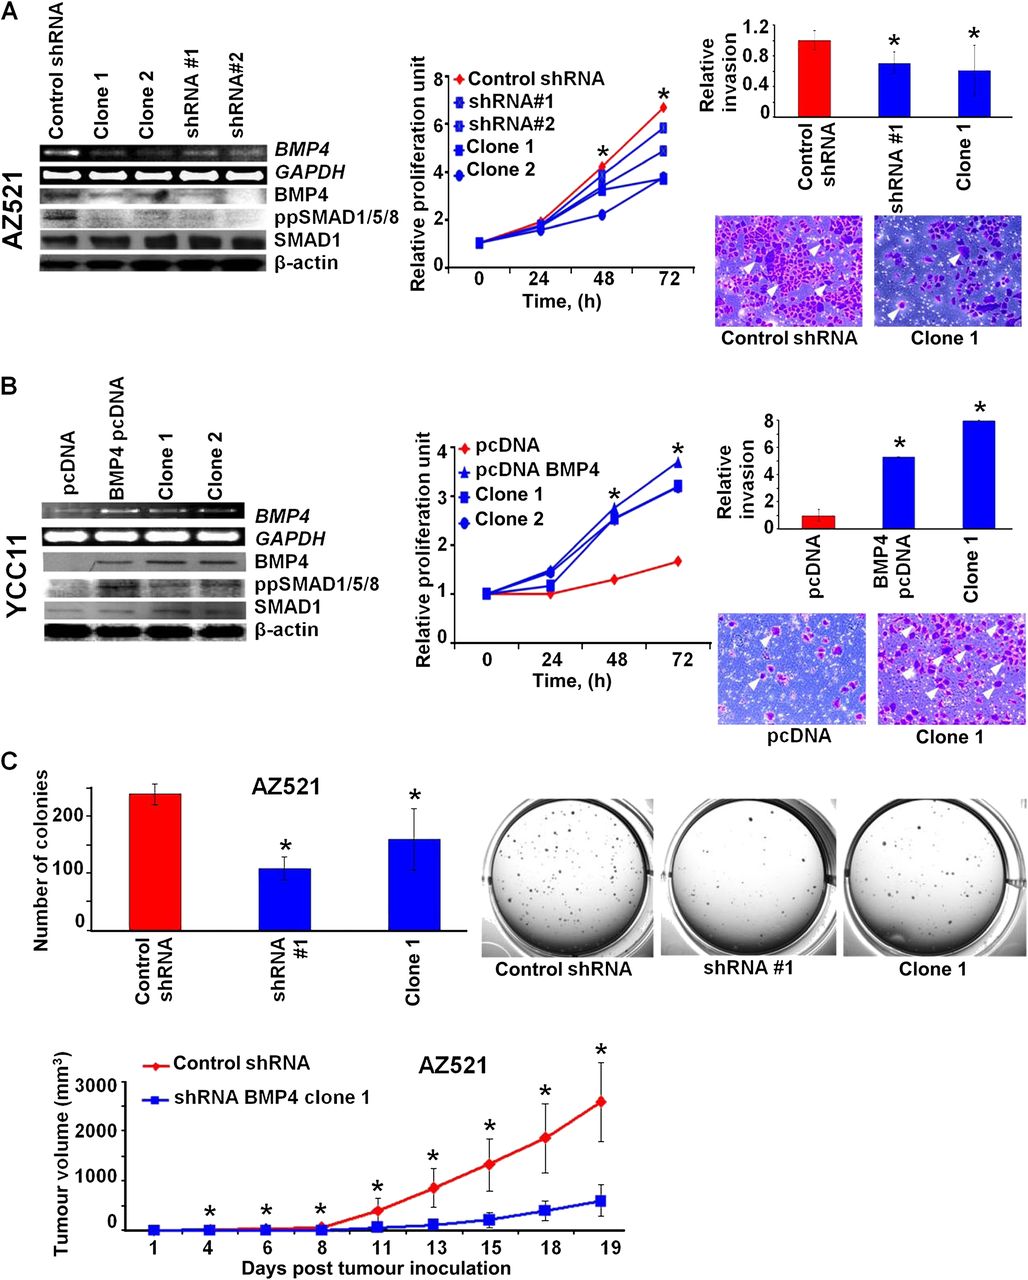
Stable silencing of BMP4 in AZ521 cells (a cisplatin-resistant line) by BMP4 small hairpin RNAs (shRNAs) caused inhibition of BMP4 pathway signalling, indicated by decreased phosphorylation of SMAD1/5/8. Similar results were obtained using an independent non-overlapping BMP4 shRNA, indicating that this phenotype is specific to BMP4 silencing and not an off-target effect (figure 4A, left panel). BMP4-silenced AZ521 cells exhibited a significant inhibition of cellular proliferation (p≤0.01; figure 4A, middle panel), and also reduced cellular migration in a matrigel invasion assay (p<0.05; figure 4A, right panel). In the reciprocal experiment, we stably overexpressed BMP4 in YCC11 cisplatin-sensitive cells. BMP4 overexpressing YCC11 cells exhibited constitutive phosphorylation of SMAD1/5/8 (figure 4B, left panel), and also exhibited significantly higher cell proliferation and invasion rates than parental control cells (figure 4B, middle and right panels; p<0.01 for proliferation and p<0.05 for invasion). This result suggests that BMP4 is likely to play a pro-oncogenic role in GC because BMP4 silencing can suppress cell proliferation/invasion while BMP4 overexpression can enhance these traits.

(A) Bone morphogenetic protein 4 (BMP4) inhibition reduces pro-oncogenic traits. (Left) Short hairpin RNA (shRNA)-mediated silencing of BMP4 in AZ521 cells. shRNA#1 and shRNA#2 are two independent targeting shRNAs, while clone 1 and clone 2 are derivatives from shRNA#1. Silencing of BMP4 and BMP pathway activity was confirmed at the transcriptional and protein level by reverse transcriptase PCR (RT-PCR) and western blotting. (Middle) BMP4-silenced cells show reduced cellular proliferation. Measurements were performed at 0, 24, 48 and 72 h. Data were normalised against T0. At least three independent experiments for each cell line were conducted (*p<0.05). (Right) BMP4-silenced cells show reduced cellular invasion. The graph represents the average of three independent experiments (*p<0.05). Representative photographs of invading cells are presented (indicated by arrowheads). (B) BMP4 overexpression enhances pro-oncogenic traits. (Left) Stable overexpression of BMP4 in YCC11 cells. BMP4 pcDNA (empty vector transfected controls) represents the complete BMP4-transfected pool, while clone 1 and clone 2 are single-cell derivatives. BMP4 expression and BMP pathway activity at the transcriptional and protein level was assessed by RT-PCR and western blotting. (Middle) BMP4 overexpression promotes cellular invasion in YCC11 cells (*p<0.05). (Right) BMP4 overexpression promotes cellular invasion. (C) BMP4 silencing inhibits in vitro and in vivo tumourigenesis. (Top) BMP4-silenced AZ521 cells show reduced soft agar colony formation compared with control cells (*p<0.05). All experiments were performed in triplicate. Representative photos of colony plates are shown. (Bottom) BMP4-silenced AZ521 cells show reduced tumour burden in a murine xenograft model compared with control cells (*p<0.05).
The effects of BMP4 silencing on AZ521 cells, while significant, were subtle, prompting us to conduct further in vitro and in vivo tumourigenesis assays to establish a more dramatic functional role for BMP4. In a soft-agar colony formation assay, BMP4-silenced AZ521 cells exhibited significantly decreased anchorage-independent growth compared with control AZ521 cells (figure 4C, top panel; p<0.05). Similarly, in a murine xenograft flank assays, BMP4-silenced AZ521 cells developed flank tumours in nude mice that were significantly smaller in size (day 20: 600 mm3 vs 2598 mm3, p=0.003) and at a slower rate than parental AZ521 cells (figure 4C, bottom panel). We were unable to test the in vivo effects of BMP4 overexpression as YCC11 cells (parental or expressing BMP4) failed to form tumours in nude mice (data not shown). Taken collectively, these data indicate that BMP4 expression likely enhances multiple pro-oncogenic traits in GC.
BMP4 expression induces a partial epithelial–mesenchymal transition in GC cells
To uncover potential mechanisms underlying the ability of BMP4 to influence these pro-oncogenic traits, we generated and compared gene expression profiles of the BMP4-manipulated lines to parental controls (figure 5A,B). We identified 342 genes differentially expressed between BMP4-silenced and parental cells (false discovery rate (FDR)<10%, twofold change; online supplementary table S3). Using GO analysis, we found that genes downregulated after BMP4 silencing were significantly related to mesenchymal development (FGFR2, FGF9, VEGFA; p<0.01) and transforming growth factor β (TGF-β) signalling (SMAD9, FOXP1, FOXP2, ACVR2A, ACVR2B; p<0.01). Conversely, among 869 genes differentially expressed between BMP4-overexpressing YCC11 cells and their parental counterparts (FDR<10%, twofold change; online supplementary table S3), we observed a significant upregulation of genes related to mesenchymal development following BMP4 overexpression (FGFR2, SOX9, BCL2, HOXA5; p<0.01). BMP4 overexpression also caused a significant downregulation of genes related to apoptosis/cell death (HTATIP2, TUBB2A, RPS27L; p<0.01), and cell adhesion/junction proteins (MPZL3, CTNNAL1, CASK/CAV2, KCNJ15, LIMS1; p<0.01).

(A) Heat maps of gene expression signatures associated with bone morphogenetic protein 4 (BMP4) silencing or BMP4 overexpression. The ‘BMP4 low’ and ‘BMP4 high’ expression signatures were subjected to pathway analysis. Significantly over-represented pathways (gene ontologies) are shown for both signatures. Common pathways are highlighted in red. (B) Cellular morphologies of BMP4-manipulated lines. BMP4-silenced AZ521 cells show enhanced cell clustering compared with control cells, while BMP4-overexpressing YCC11 cells show enhanced cellular dissociation. Cells were visualised over 3 days of culture by phase-contrast microscopy. (C) Gene expression analysis of molecular markers associated with epithelial–mesenchymal transition. Genes were monitored by reverse transcriptase PCR. Glyceraldehyde 3-phosphate dehydrogenase (GADPH) was used as a normalisation control. shRNA, short hairpin RNA; TGF-β, transforming growth factor β.
Epithelial–mesenchymal transition (EMT) is a process activated in many different cancer types to facilitate aggressive invasion and metastasis.26 The finding that mesenchymal genes are reciprocally regulated by BMP4 silencing and overexpression suggests that BMP4 may facilitate EMT in GC. To investigate the role of BMP4 in EMT, we analysed the phenotypic effects of BMP4 expression on cell morphologies and molecular markers of EMT. One defining feature of EMT is the loss of cell junctions, which allows cells to migrate and invade. AZ521 cells, which express high levels of BMP4, normally exhibit poor cell–cell adhesion. Upon BMP4 silencing, AZ521 cells showed increased cell–cell adhesion, increased expression of the epithelial markers DSG2 and KRT18, and downregulation of the mesenchymal markers CDH2 and TLN1 26 (figure 5C, left panel). Conversely, parental YCC11 cells, which express low levels of BMP4, exhibited frequent cell–cell attachment to one another. In contrast, BMP4 overexpressing YCC11 cells exhibited rounded morphologies with a striking degree of cellular dissociation, transciptional downregulation of the epithelial markers DSG2 and DSP and increased expression of the mesenchymal markers SLUG and TLN1 (figure 5C, right panel). Taken collectively, these results support a role for BMP4 in facilitating EMT in GC.
BMP4 expression in primary GC is correlated with BMP4 methylation and poor prognosis
To extend our BMP4 results to the clinical setting, we examined BMP4 expression levels in cohorts of primary GCs and other gastrointestinal tumours. Analysing a previously described cohort of 197 GCs (online supplementary table S1), we found that BMP4 expression was significantly upregulated compared with non-malignant gastric tissues (p=4.53×10⁻⁵; average 2.25-fold elevated; figure 6A). BMP4 was also repeatedly and significantly overexpressed in several other gastrointestinal tumours, including colon, esophageal and pancreatic cancer (online supplementary figure S12). Thus, high BMP4 expression may be a common feature associated with various tumour types in the gastrointestinal tract.

(A) Bone morphogenetic protein 4 (BMP4) expression in primary gastric tumours (200) and matched normal tissues (100). BMP4 is observed to be highly expressed in gastric cancers (GCs) relative to normal gastric tissues (p=4.5×10⁻⁵). (B) Correlation of BMP4 gene expression to BMP4 methylation. Each column represents a group of GCs showing either methylation (pink) or no methylation (blue) of the BMP4−199 CpG site. Tumours exhibiting BMP4−199 methylation are observed to have a lower BMP4 gene expression level relative to tumours exhibiting BMP4−199 non-methylation. (C) Kaplan–Meier plot of overall survival in patients with GC and stratified BMP4 gene expression. Patients were divided into two groups based upon the median BMP4 expression level. A significant survival difference is observed (p=0.016, log-rank test).
To explore the relationships between BMP4 methylation and BMP4 expression in primary GCs, we ranked the 197 primary GCs by their BMP4 mRNA expression levels and selected 20 tumours with low BMP4 expression (below the median BMP4 expression level) and 18 tumours with high BMP4 expression (above the median BMP4 expression level). Besides differences in their BMP4 expression levels, these tumours were otherwise randomly selected from the 197 GCs, and when compared against the non-selected tumours did not exhibit any significant differences in other histopathological variables, such as Lauren's classification, age, gender, stage and grade (online supplementary table S4). Genomic DNAs of these 38 tumours were extracted and assayed for methylation at the BMP4−199 and BMP4−123 sites. Similar to the gastric cell lines, there was a significant correlation between BMP4−199 methylation status and BMP4 mRNA expression across the tumours (p=0.016; figure 6B; online supplementary table S5). Methylation of the BMP4−123 site was also significantly correlated with BMP4−199 methylation (Fisher exact test, p<0.01), and tended to be negatively associated with BMP4 expression, although this association did not achieve statistical significance. These results establish that BMP4 methylation, specifically at the BMP4−199 CpG island, is significantly associated with BMP4 expression in tumours in vivo.
To assess the clinical relevance of BMP4 expression in GC, we investigated if expression levels of BMP4 might be related to patient survival. Based on the median level of BMP4 expression, we stratified all 197 patients with GC into ‘BMP4 high’ and ‘BMP4 low’ groups, and compared the overall survival of these two groups. We found patients with tumours expressing high BMP4 levels exhibited poorer overall survival compared with patients with tumours expressing low BMP4 (p=0.016; figure 6C). No other significant clinical–pathological associations with BMP4 expression were found in patients with GC. In a multivariate analysis in which BMP4 expression levels were considered with tumour stage, the gold standard for survival stratification in GC, BMP4 still retained its prognostic significance (p=0.003; HR=1.533; 95.0% CI 1.158 to 2.030; online supplementary table S6). Gene set enrichment analysis of the ‘BMP4 high’ tumours revealed enrichment of several gene sets related to EMT-associated pathways, including cell adhesion (p=0.002), hedgehog signalling (p<0.001) and TGF-β signalling (p<0.05).26 Interestingly, the ‘BMP4 high’ tumours also exhibited expression of genes related to cisplatin resistance, including NER (p=0.02) and genes upregulated in gastric cell lines with acquired cisplatin resistance.27 These results suggest that BMP4-expressing tumours are associated with poor patient prognosis in GC and molecular features related to cisplatin resistance.
BMP4 inhibition and oxaliplatin as therapeutic opportunities
To explore alternative therapeutic options for BMP4-high GCs, we investigated if manipulating levels of BMP4 activity might prove useful in modulating cisplatin sensitivity and resistance in GC. Treating the BMP4-manipulated cells with increasing doses of cisplatin (figure 7A) we found that, compared with parental AZ521 cells originally defined as cisplatin resistant, BMP4-silenced AZ521 cells exhibited significantly increased cisplatin sensitivity (p<0.01), with a ninefold decrease in absolute GI50 from 15 μM to 1.1–3.24 μM (individual clones 1 and 2). Notably, in these experiments, BMP4 effects on cisplatin sensitivity were distinguished from effects on baseline growth by normalising the treated cells to their untreated cellular counterparts. Similar to the cellular proliferation data, BMP4-silenced AZ521 cells exhibited significantly higher caspase-3 activation levels after cisplatin compared with control cells (figure 7B, left panel). Reciprocally, compared with parental YCC11 cells originally defined as cisplatin sensitive, BMP4 overexpression caused YCC11 cells to exhibit cisplatin resistance, with a 10-fold increase in absolute GI50 from 45 nM to 0.2–0.5 μM (individual clones 1 and 2), and a reduction in active caspase-3 levels in BMP4-overexpressing cells (figure 7B, right panel). Similarly, treating the BMP4-methylated lines YCC10 and YCC11 with 5-aza-dC also induced endogenous BMP4 expression (figure 3D) and significantly increased cisplatin resistance (p<0.05 for YCC10 and YCC11 cells), albeit to less dramatic levels than ectopic BMP4 overexpression (1.3–1.7-fold resistance) (online supplementary figure S13). These results suggest that targeted inhibition of BMP4 signalling may represent a therapeutic option for sensitising GC cells to cisplatin treatment.

(A) Cisplatin-mediated growth inhibition curves for bone morphogenetic protein 4 (BMP4)-silenced and BMP4-overexpressing cells. Cells were treated with 10-fold increasing concentrations of cisplatin. Measurements were taken after 48 h of treatment. (Left) BMP4-silenced AZ521 cells (blue lines) show enhanced cisplatin sensitivity relative to control cells (red). (Right) BMP4-overexpressing YCC11 cells (blue) show increased cisplatin resistance relative to control cells (red). X-axis: cisplatin concentration (μM); Y-axis: % of live cells. Data are normalised against untreated control cells. All experiments were performed at least three times (*p<0.05). (B) Cisplatin-mediated cell death in BMP4-silenced and BMP4-overexpressing cells. Cells were treated with cisplatin (10 μM) and assayed after 48 h. (Left) BMP4-silenced AZ521 cells exhibit significantly higher caspase-3 activation levels relative to control cells. (Right) BMP4-overxpressing YCC11 cells show significantly lower caspase-3 activation levels compared with control cells. All experiments were performed in triplicate (*p<0.05). (C) Cisplatin-resistant lines retain sensitivity to oxaliplatin. Y-axis represents |log10GI50|. Red columns: cisplatin GI50 values; blue columns: oxaliplatin GI50 values. GI50, concentration of cisplatin required to cause 50% growth inhibition at 48 h. shRNA, short hairpin RNA.
Oxaliplatin is an alternative chemotherapy drug commonly used in combination with 5-FU to manage patients with GC28 in place of cisplatin. Intriguingly, although both drugs are platinum-based compounds, oxaliplatin has been shown to exhibit an activity spectrum highly distinct from cisplatin.29 To investigate if cell lines exhibiting resistance to cisplatin might also exhibit cross resistance to oxaplatin, we treated the cisplatin-sensitive and cisplatin-resistant lines with increasing doses of oxaliplatin. Strikingly, the cisplatin-resistant lines remained sensitive to oxaliplatin, exhibiting oxaliplatin GI50 values very similar to the cisplatin-sensitive lines (p<0.01; figure 7C). Further supporting that BMP4 does not impart oxaliplatin resistance, no significant differences in oxaliplatin sensitivity were observed between parental and BMP4-manipulated lines (online supplementary figure S14). These results raise the possibility that patients with high BMP4-expressing tumours, while being resistant to cisplatin, may remain amenable to oxaliplatin treatment.
Discussion
Despite being a mainstay of anticancer therapy for more than 40 years, there is still no established method for predicting cisplatin sensitivity in any tumour type. As such, most patients for whom cisplatin is indicated are still being treated with a uniform ‘one-size-fits-all’ strategy, resulting in markedly diverse clinical outcomes. Initial attempts to identify genetic determinants of cisplatin sensitivity focused on candidate genes related to mechanisms of cisplatin action, such as the DNA repair (NER pathway: ERCC1, ERCC4, GSTP1) and DNA damage pathways (bcl-2, RAD50 6). More recently, genome-wide approaches have also been used to study the genetics of cisplatin response, ranging from genome-wide small interfering (siRNA) screening,30 chemogenomic profiling of cancer cell lines31 and correlating expression profiles of primary tumours to observed clinical responses.32 However, further research is clearly required to fully understand the molecular basis of cisplatin response and resistance in tumours.
In GC, previous studies exploring cisplatin resistance have primarily relied solely on transcriptomic information. For example, a study combining microarray analysis of GC samples with ex vivo cell proliferation assays identified metallothionein-IG and HB-EGF as candidate cisplatin-resistance-related genes, and also rediscovered glutathione-S-transferase and cyclooxygenase-2 as resistance markers.33 Similarly, Nakamura et al 34 identified survivin as a gene negatively associated with the survival of patients on cisplatin-based chemotherapy, and showed that survivin overexpression protected cells from cisplatin-induced apoptosis. However, our study is the first to combine genome-scale patterns of DNA methylation and a gene expression network to identify cisplatin regulators in GC. Our integration of high-dimensionality genome-wide expression data with epigenetic profiles (>800 genes) also distinguishes our work from previous cisplatin sensitivity studies in other tumour types focused on single candidate genes,10 DNA methylation patterns alone without gene expression,11 and studies in which methylated genes regulating cisplatin sensitivity were identified by pharmacological unmasking.35
By combining the epigenetic and transcriptional profiles of cisplatin-sensitive and cisplatin-resistant lines, we identified five genes (BMP4, CD9, TFPI2, DSC2, CDH17) exhibiting an inverse correlation between CpG island methylation and gene expression. The admittedly small number of genes identified could be due to different reasons, including technical limitations in the GoldenGate methylation platform design (only 807 genes), which interrogates only a small number of CpG sites. Nevertheless, despite these limitations, this is the first time that many of these genes have been reported to be methylated in GC, although notably BMP4 and CD9 have been previously reported to be methylated in renal cancer and myeloma, respectively.36 ,37 Moreover, while this study focuses on BMP4, it is possible that several of the other genes may also have relevance to GC. For example, CDH17 has been recently identified as a promising prognostic marker for early stage GC associated with the intestinal subtype of GC.38 Moreover, a recent paper by Kohmo et al 39 has also shown CD9 to be involved in chemoresistance towards cisplatin and etoposide in small cell lung cancer.
Our discovery of BMP4 as a gene highly expressed in cisplatin-resistant cancers is consistent with another study using next-generation sequencing demonstrating that BMP4 is upregulated in cisplatin-resistant ovarian cancer cell lines and primary tumours.40 Although this other study used very few samples and lacked functional validation, it suggests that the role of BMP4 in eliciting cisplatin resistance may not be solely restricted to GC. The correlation between BMP4 promoter methylation and BMP4 expression levels was observed in GC cell lines and primary tumours. Interestingly, the BMP4−199 probe showed a better correlation with BMP4 expression than the BMP4−123 probe, despite the latter being more proximal to the BMP4 TSS. This could be due to several reasons. A transcription factor binding site analysis of the BMP4 promoter region identified two potential binding sites for USF and N-myc at the BMP4−199 site and no binding sites at BMP4−123 (TFSEARCH V.1.3), which may explain the stronger effects of BMP−199 methylation on BMP4 expression. Moreover, we also identified two short interspersed element (SINE) repeat elements 1 kb upstream from the BMP4 TSS, which can function as nucleation centres for de novo methylation—the closer proximity of BMP4−199 to these SINE repeats may also contribute to this site being more strongly associated with transcriptional control.41
An important question raised by our cell line data is whether primary tumours expressing high BMP4 levels also exhibit clinical resistance to cisplatin. In the current study, our primary GCs were obtained from patients who either did not receive additional adjuvant chemotherapy after surgery or were treated only with 5-FU adjuvant chemoradiation. As such, our current data do not allow us to directly evaluate the clinical relationship between BMP4 expression and cisplatin resistance. However, two lines of evidence suggest that GCs expressing high BMP4 levels are likely cisplatin resistant. First, in our series of 197 GCs, genes expressed in ‘BMP4-high’ tumours were significantly associated with multiple molecular pathways associated with cisplatin resistance, including EMT, NER and genes identified as upregulated in gastric cell lines with acquired cisplatin resistance from an entirely independent study.27 Second, most patients with GC are currently managed with a flouropyrimidine/platinum combination. In an external analysis of 22 GCs exhibiting clinical resistance to 5-FU/cisplatin,42 we found that two resistant GCs already exhibited very high baseline levels of BMP4 expression, and of the remaining 20 GCs, 16 exhibited significantly increased BMP4 expression levels after developing 5-FU/cisplatin resistance (p=0.01, paired Wilcoxon test; online supplementary figure S15). These findings support the notion that BMP4-high tumours are likely cisplatin resistant. To directly address this question, we are currently performing a prospective collection of GC tissues from patients treated with S-1/cisplatin or S-1/oxaliplatin (S-1 is a 5-FU prodrug) as part of an ongoing clinical trial (NCT01100801, http://clinicaltrialsfeeds.org). An analysis of the genomic profiles of these samples upon completion of the trial should allow us to correlate BMP4 expression levels to cisplatin and oxaliplatin responses, respectively.
BMP4 encodes a secreted protein belonging to the TGF-β superfamily. BMP4 binds to BMP type I/II receptors, resulting in activation of a signalling cascade culminating in phosphorylation of SMAD1/5/8 and the regulation of gene expression. Previously, TGF-β signalling has been commonly regarded as a tumour suppressor pathway, whose inactivation is required for cancer development. For example, inactivating mutations and epigenetic silencing of TGFBRII is frequently observed in GC, consistent with a tumour-suppressive role, along with inactivating mutations in BMPR1A and SMAD4.43 However, emerging evidence is now suggesting a more complex picture—in certain tumour types enhanced TGF-β signalling may actually enhance the development and progression of human malignancies through the initiation of EMT. For example, elevated BMP2 expression has been recently reported to be associated with metastatic disease in GC, and may induce tumour cells to undergo EMT-mediated invasion through phosphatidylinositol 3 kinase/Akt signalling.44 A role for BMP4 in EMT has been reported for ovarian and pancreatic cancers,45 ,46 and BMP4 may also be involved in the development of intestinal metaplasias of the oesophagus and stomach.47 However, our study is the first to confirm that BMP4 expression is significantly unregulated in primary GCs and associated with poor patient prognosis. Our functional studies suggest that this may be due to BMP4 inducing a partial EMT resulting in cisplatin resistance and stimulation of various oncogenic traits.
Our study is also notable for identifying potential alternative strategies for treating patients with BMP4-high expressing cancers. These could include therapeutic targeting of BMP signalling to restore cisplatin sensitivity. Because pharmaceutical compounds targeting the TGF-β pathway are available, it is possible that pharmacological inhibition of TGF-β/BMP signalling may represent a novel approach to re-sensitise cisplatin-resistant tumours to cytotoxic therapies. Alternatively, such patients might be managed with oxaliplatin rather than cisplatin. This last point is readily translatable into the clinic because cisplatin and oxaliplatin are accepted standard-of-care platinum-based agents in GC treatment. In conclusion, our study identifies a novel role for BMP4 in the development and progression of GC, highlighting the complex part played by TGF-β in gastrointestinal malignancies.
References
Supplementary materials
Supplementary Data
This web only file has been produced by the BMJ Publishing Group from an electronic file supplied by the author(s) and has not been edited for content.
Files in this Data Supplement:
- Download Supplementary Data (PDF) - Manuscript file of format pdf
Footnotes
Funding This work was supported by grant NMRC TCR/001/2007, a Duke-NUS core grant, and a CSIS core grant (PT). We acknowledge the assistance of the Van Andel Research Institute animal facility. Microarray profiling was performed at the Duke-NUS Genome Biology Facility.
Competing interests None.
Patient consent Obtained.
Ethics approval Ethics approval was approved by the Institutional Research Ethics Review Committee.
Provenance and peer review Not commissioned; externally peer reviewed.
Data sharing statement The methylation data have been uploaded onto the Gene Expression Omnibus under accession number GSE29499.