Article Text

Abstract
BACKGROUND AND AIMS Laser induced fluorescence (LIF) from colonic mucosa was measured in vivo with and without δ aminolevulinic acid (ALA) in an attempt to differentiate between neoplasia and non-neoplasia in real time during colonoscopy.
METHODS Spectra from 32 adenomas, 68 normal sites, and 14 hyperplastic polyps in 41 patients were obtained with a point monitoring system. Twenty one of the patients had been given a low dose of ALA as a photosensitiser before the examination. Light of 337, 405, or 436 nm wavelength was used as excitation. Stepwise multivariate linear regression analysis was performed.
RESULTS With 337 nm excitation, 100% sensitivity and 96% specificity was obtained between normal mucosa and adenomas. Seventy seven per cent of the hyperplastic polyps were classified as non-neoplastic. When exciting with 405 and 436 nm, the possibility of distinguishing different types of tissue was considerably better in the ALA patients than in the non-ALA patients.
CONCLUSIONS The in vivo point measurements imply that a good discrimination between normal tissue and adenomatous polyps can be obtained using the LIF technique. Excitation at 337 nm and at 405 nm or 436 nm using ALA gives good results. LIF also shows potential for distinguishing adenomatous from hyperplastic polyps. The number of detection wavelengths could be reduced if chosen properly.
- fluorescence
- diagnostics
- adenoma
- colon
- laser
Abbreviations
- ALA
- δ aminolevulinic acid
- LIF
- laser induced fluorescence
- MVLR
- multivariate linear regression
- PpIX
- protoporphyrin IX
Statistics from Altmetric.com
Improved possibilities of differentiating between neoplastic and non-neoplastic mucosal lesions of the gastrointestinal tract in real time during endoscopy would be valuable. All neoplastic mucosal lesions, for example, adenomas, are believed to harbour a certain malignant potential, and a certain percentage of them will develop into a carcinoma if left untreated. However, the risk for each individual adenoma cannot be predicted and therefore all adenomas should be removed. On the contrary non-neoplastic mucosal lesions do not require treatment at all, and as removal increases the cost and adds a certain morbidity to the endoscopic procedure, it should be avoided. At present, the decision whether a lesion should be removed or not is made by the endoscopist based on visual impression. The discrimination between neoplasia and non-neoplasia is, however, often difficult even for the most experienced endoscopist. Such uncertainty leads undoubtedly to unnecessary endoscopic resections. The final diagnosis of all resected tissues is made by histopathological examination and is not available during the endoscopic procedure.
The development of a complementary diagnostic tool providing the endoscopist with an immediate result that helps in the differentiation between different tissue types is therefore of high priority. The promising results published in the field of laser induced fluorescence (LIF) measurements during colonoscopy1-3 are of great interest and certainly urge for further development of this technique. Cost considerations aside, the LIF approach has obvious potential attractions, particularly with the additional possibility of enhancing the results with fluorescing agents.
One aim of this study was to evaluate the potential of LIF as a tool to discriminate different degrees of dysplasia in the colon. The autofluorescence emitted from biological tissue following ultraviolet irradiation is due to endogenous fluorophores, such as tryptophan, collagen, elastin, NADH, FAD, and others. To enhance the tumour demarcation a tumour seeking exogenous fluorophore is often used. Another purpose of this study was to compare the discrimination obtained using δ aminolevulinic acid (ALA) induced protoporphyrin IX (PpIX) as a tumour marker with the discrimination obtained using only the autofluorescence. ALA is a natural precursor to haem. After oral ingestion of ALA, part of it is absorbed and metabolised within the gastrointestinal tract.4 Due to a feedback function in the final step of the haem cycle, the administration of an excessive amount of ALA results in an accumulation of PpIX in the tissue. A higher amount of PpIX is accumulated in tumour tissue compared with normal tissue, possibly because of a difference in the content of enzymes regulating the haem cycle in the cell.5-9 The characteristic dual peaked porphyrin fluorescence at approximately 635 and 700 nm can be used as a diagnostic tool as shown in previous papers.4 ,10 ALA can be given orally, intravenously, and topically.4 ,7 ,11-14 It has been shown that adding ALA, even in a low dose (below 15 mg/kg body weight), increases tumour demarcation in oral and laryngeal mucosa.10
To the best of our knowledge, no data utilising ALA induced PpIX fluorescence as a marker for human colonic atypia have been published. A paper by von Rueden and colleagues15 reports on detection of colon carcinomas in a rat model using fluorescence from dihaematoporphyrin ethers (DHE). In a paper by Schomackeret al,1 337 nm excitation was used for an in vivo tissue autofluorescence study, and the results were analysed using a multivariate linear regression (MVLR) analysis method. The discrimination between adenomas and hyperplastic polyps in that study was accurate in 86% of the cases, which was the same as that achieved by the pathologist on the biopsy specimens taken. The gold standard was based on the majority classification of three pathologists.
In a paper by Kapadia et al,16325 nm light from a helium-cadmium laser was used to excite endoscopically resected colonic tissue samples. The resulting autofluorescence spectra were evaluated using MVLR scores based on six wavelengths. All 34 normal specimens, all 16 adenomatous polyps, and 15 of 16 hyperplastic polyps were accurately classified. However, as that study was performed in vitro, the results are not directly comparable to in vivo results. It has for instance been shown that the tissue trauma at resection causes an increase in haemoglobin absorption, and that the NADH fluorescence decreases drastically after resection of the tissue.17 Another report states that the shape of fluorescence spectra from nude mice does not change during the first few hours after sacrifice,18 but in that study the spectra were measured in situ, and there was no tissue trauma.
Several groups have worked at finding evaluation algorithms for their spectra.1 ,16 ,17 ,19 ,20 MVLR analysis, where the fluorescence intensity is analysed at many wavelengths and then multiplied by weighting factors, is frequently used. This purely empirical method may provide good diagnostic criteria. However, it yields limited understanding of what is causing the differences.
Materials and methods
Two hundred patients scheduled for colonoscopy were offered LIF colonoscopy. Patients submitted for colonoscopy were randomly selected for the study.
A total of 57 patients (31 men and 26 women) was examined with LIF colonoscopy. The indications for colonoscopy were: previous colorectal adenoma (n=14), previous colorectal carcinoma (n=6), abdominal pain (n=7), change in bowel habit (n=3), blood in the stools (n=5), ulcerative colitis (n=12), Crohn’s disease (n=2), familial polyposis (n=2), and others (n=6). The 16 patients with inflammatory bowel disease or polyposis were excluded, to avoid errors due to inhomogeneities in the material. These patients will be dealt with in a separate study. The remaining 41 patients (20 men and 21 women), in whom abnormalities, mainly polypoid lesions in the colorectal mucosa, were revealed at colonoscopy, were included in this study. The age range was 29–90 years, median age 68 years.
The colonoscopies were performed with CF-V10L and CF-V200 Fujinon Superimage video colonoscopes by three different endoscopists.
ALA powder was dissolved in fresh orange juice and given by mouth to 21 of the 41 patients, at a dose of 5 mg/kg body weight, about two to three hours prior to investigation. It has been shown in a small number of patients that lower doses of ALA lead to earlier fluorescence maxima,4 and an approximate delay of two to three hours between ALA administration and LIF examination seemed reasonable.
Spectra from 32 adenomas, 68 normal sites, and 14 hyperplastic polyps in the 41 patients were obtained with a point monitoring system. After LIF examination all lesions were biopsied for histopathological examination. At each investigated site fluorescence was induced with three different excitation wavelengths: 337, 405, and 436 nm. The 337 and 436 nm excitation wavelengths are close to wavelengths found to give maximum differences between normal and adenomatous tissue according to previous studies.21 ,22 As we also wanted to investigate the possibilities of enhancing the demarcation by using ALA induced PpIX, and this is most efficiently excited at 405 nm, we also used this excitation wavelength. Some tissue spots were not measured with all excitation wavelengths. One reason is that in a few cases there were difficulties in placing the fibre tip onto the correct tissue spot, due to bowel movements during the short time required to change excitation wavelength. All spectra where there was any doubt about the accuracy of the measurement have been excluded from the study. Another reason is that for a few patients the colonoscopy was painful and had to be interrupted before the LIF measurements were finished.
Figure 1 shows the experimental set up. The light sources used for excitation were a nitrogen laser (Laser Science VSL-337 ND) and a nitrogen pumped dye laser (Laser Science DLM-220) using stilbene 1 as a dye. The nitrogen laser emitted light at 337 nm and the dye laser at 405 or 436 nm. The excitation light was guided to the examined tissue through a 600 μm optical fibre that was inserted through the biopsy channel of the colonoscope and held in light contact with the tissue. The pulse energy out of the fibre was approximately 20 μJ at 337 nm and 1–2 μJ at 405 or 436 nm. The same fibre collected the fluorescence light, which was coupled out from the excitation path through a beam splitter. The fluorescence light was then focused onto the entrance slit of a polychromator (Acton SP-275). In front of the slit, cut off filters were placed to suppress scattered laser light. The filters used were Schott GG375, GG435, and GG455 for 337, 405, and 436 nm excitation, respectively. On the output a time gated, image intensified CCD detector was placed, either a Peltier cooled two dimensional CCD array (Spectroscopy Instruments ICCD-576) or a linear diode array (Princeton Instruments TRY-512/L). The spectra were obtained by adding the fluorescence from 30 laser pulses, with a total accumulation time of three seconds. To check the alignment and detection efficiency of the system, fluorescence measurements on a cuvette containing a known concentration of rhodamine 6G were regularly made. Background spectra were obtained in the lumen of the colon of each patient, with the endoscopic illumination on. These spectra were subtracted from the fluorescence spectra to correct for detector dark current, fluorescence from the optical fibre, and other sources of error. The entire detection system was calibrated to a uniform spectral response using a tungsten lamp, and wavelength calibration was made using a mercury discharge lamp.

Experimental set up for in vivo LIF recording.
DATA ANALYSIS
In order to prepare for MVLR analysis, each spectrum was spectrally corrected and normalised to a total fluorescence intensity of 1. The influence of, for example, geometry, laser intensity, and detection efficiency was thus eliminated. Whenever multiple spectra with the same excitation wavelength were obtained from the same spot, these have been averaged. The spectra were divided into five groups depending on whether the patient had been given ALA or not, and depending on the excitation wavelength. At 337 nm excitation, no distinction was made between ALA and non-ALA patients, as the PpIX absorption at this wavelength is very low.
The biopsy specimens were divided into three histological groups: normal mucosa, hyperplastic polyp, and adenoma (with low or high grade dysplasia). Polyp size ranged from 1 to 40 mm (median 4 mm). Measurements were also made on a large number of normal sites where no biopsy specimens were taken, but where diagnosis was made by visual inspection.
The histopathological classification of epithelial lesions was made according to the following criteria. In flat hyperplastic polyps the sides of the crypts of Lieberkühn had a crenated, saw tooth configuration due to scalloped epithelial infoldings. The cells in the infoldings were cylindrical with or without apical mucin vacuoles alternating with large goblet cells. The regular nuclei were small, and located at the base of the cells. The degree of dysplasia in the tubular, tubulovillous, and villous adenomas was defined as low grade dysplasia (LGD) when dysplastic cells were present in the deeper half of the epithelium and as high grade dysplasia (HGD) when dysplastic cells were found in the superficial half of the epithelium in at least three tubules or crypts, the normal configuration of the crypts of Lieberkühn being retained.
To correlate the shape of the fluorescence spectra with the histopathology, the integrated intensities in several wavelength intervals of interest between 391 and 690 nm were calculated and analysed using stepwise MVLR. A statistical software package (STATISTICA, StatSoft, Inc., Tulsa, Oklahoma, USA) was used to perform the analysis. MVLR is based on the assumption that the histopathology of a tissue can be predicted by a fluorescence score formed as: score = C0 + C1*I(λ1) + C2 * I(λ2) + . . . + Cn * I(λn)
where Ck are constants and I(λk) are the integrated fluorescence intensities in a specified wavelength interval centred at λk. The wavelength intervals were 15 nm wide, centred around the following wavelengths: 395, 409, 440, 498, 543, 560, 572, 590, 602, 631, and 661 nm (at 337 nm excitation). These wavelengths were chosen for easy comparison with previous studies.1 ,16 ,23
Half of the spectra from normal mucosa and half of the spectra from adenomas were used as a training set to choose the constants Ck so that ideally a normal tissue would get the score +1 and an adenoma would get the score −1. The independent intensities I(λk) were individually added to or deleted from the model in each step of the regression, depending on whether they reached the specified significance threshold or not. By raising this significance threshold, the number of wavelengths that was included in the model could be reduced.
The derived formula was used on the second half of the spectra (the validation set), as well as on the spectra from hyperplasia, to see how well these could be classified.
Results
Figure 2 shows typical fluorescence spectra following excitation at 337, 405, and 436 nm. At 337 nm excitation (fig 2A) the peak of highest fluorescence intensity is at 390 nm in the normal spectrum and close to 460 nm in the adenoma spectrum. At 405 nm excitation in an ALA patient (fig 2C), an adenoma shows an increased porphyrin fluorescence at 635 nm as well as a somewhat reduced autofluorescence compared with normal mucosa, the latter probably caused by increased haemoglobin absorption of the excitation light. Note that all the spectra in fig 2have been normalised to an integrated intensity of 1, as this is the way the spectra are prepared for analysis.

Typical in vivo spectra from normal and adenomatous colon tissue. The spectra are normalised to a total intensity of 1. Error bars represent standard deviations. (A) 337 nm excitation, both ALA and non-ALA patients; (B) 405 nm excitation, non-ALA patients; (C) 405 nm excitation, ALA patients; (D) 436 nm excitation, non-ALA patients; (E) 436 nm excitation, ALA patients.
Figure 3A shows the MVLR results from spectra recorded at 337 nm excitation. As mentioned above, all patients were grouped together for this wavelength, independently of whether they had been given ALA or not. The training set consisted of spectra from 29 normal spots and 14 adenomas. Twenty six of the 27 normal spectra in the validation set, which ideally would have a score of +1, have a score higher than zero, and all of the 13 adenomas, which would have a score of −1, show a score lower than zero. A threshold at zero between neoplasia and non-neoplasia would thus give us a sensitivity of 100% and a specificity of 96% for the adenomatous specimens (table 1). Furthermore, 10 of the 13 hyperplastic polyps (77%) would be classified as non-neoplastic.
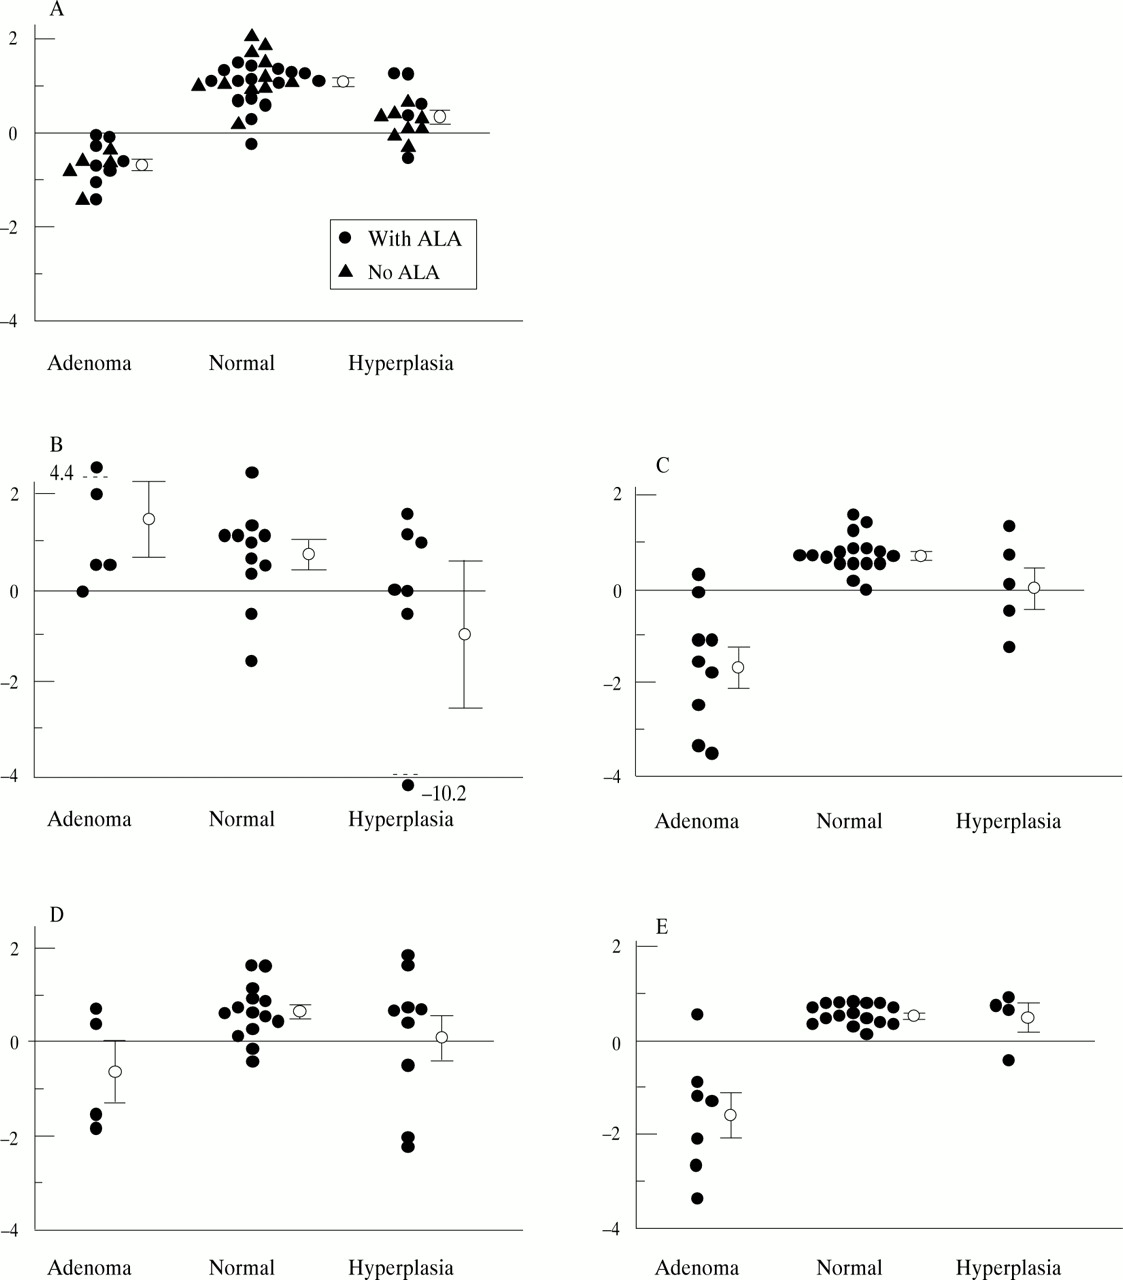
Fluorescence score derived using stepwise MVLR analysis. The circles with error bars represent mean scores with standard errors. (A) 337 nm excitation—evaluation at 409, 440, 498, 572, and 661 nm; (B) 405 nm excitation, non-ALA patients—evaluation at 498, 543, 560, 590, 602, and 661 nm; (C) 405 nm excitation, ALA patients—evaluation at 498, 543, 560, 572, 602, and 661 nm; (D) 436 nm excitation, non-ALA patients—evaluation at 498, 543, 560, 572, 590, and 602 nm; (E) 436 nm excitation, ALA patients—evaluation at 498 and 661 nm.
Results of laser induced fluorescence
Figure 3B–E shows MVLR results for 405 and 436 nm excitation, with and without ALA. Table 1 lists the sensitivities, specificities, and positive and negative predictive values. Note that all values are based on the assumption that the threshold between neoplasia and non-neoplasia is at a LIF score of zero. The possibilities of distinguishing different tissue types when exciting at 405 and 436 nm in patients with no ALA are less good. Only one of five and two of four adenomas, respectively, were correctly classified. The overlap between the groups is substantial (fig 3B,D). The results are considerably better in the ALA patients (fig 3C,E). At 405 nm excitation, eight of nine adenomas and 16 of 17 normal spectra were correctly classified, giving a sensitivity of 89% and a specificity of 94%. At 436 nm excitation, six of seven adenomas (sensitivity 86%) and 16 of 16 normal spectra (specificity 100%) were correctly classified in the ALA patients. However, due to the low number of hyperplasias in this group we cannot draw any firm conclusions on how well we can distinguish adenomatous from hyperplastic polyps.
An unpaired, one sided Student’s t test was used to compare the LIF scores of the normal and adenomatous spectra (table 1). The hypothesis that the average LIF score of adenomatous tissue was lower than that of normal tissue at 337 nm excitation was found to be true below the 0.001 level of significance. This level of significance is described by the p value of thet test. At 405 nm with ALA, p<0.001. At 436 nm excitation with ALA, p<0.01. A Student’st test was also used to compare adenomas with hyperplastic polyps. The p values are in this case <0.001, <0.01, and <0.01 for 337 nm, 405 nm with ALA, and 436 nm with ALA, respectively. Note that the model is optimised for discrimination between adenoma and normal tissue. If the number of hyperplastic polyps had been higher, these could have been included in the training set, and the p values might be lower.
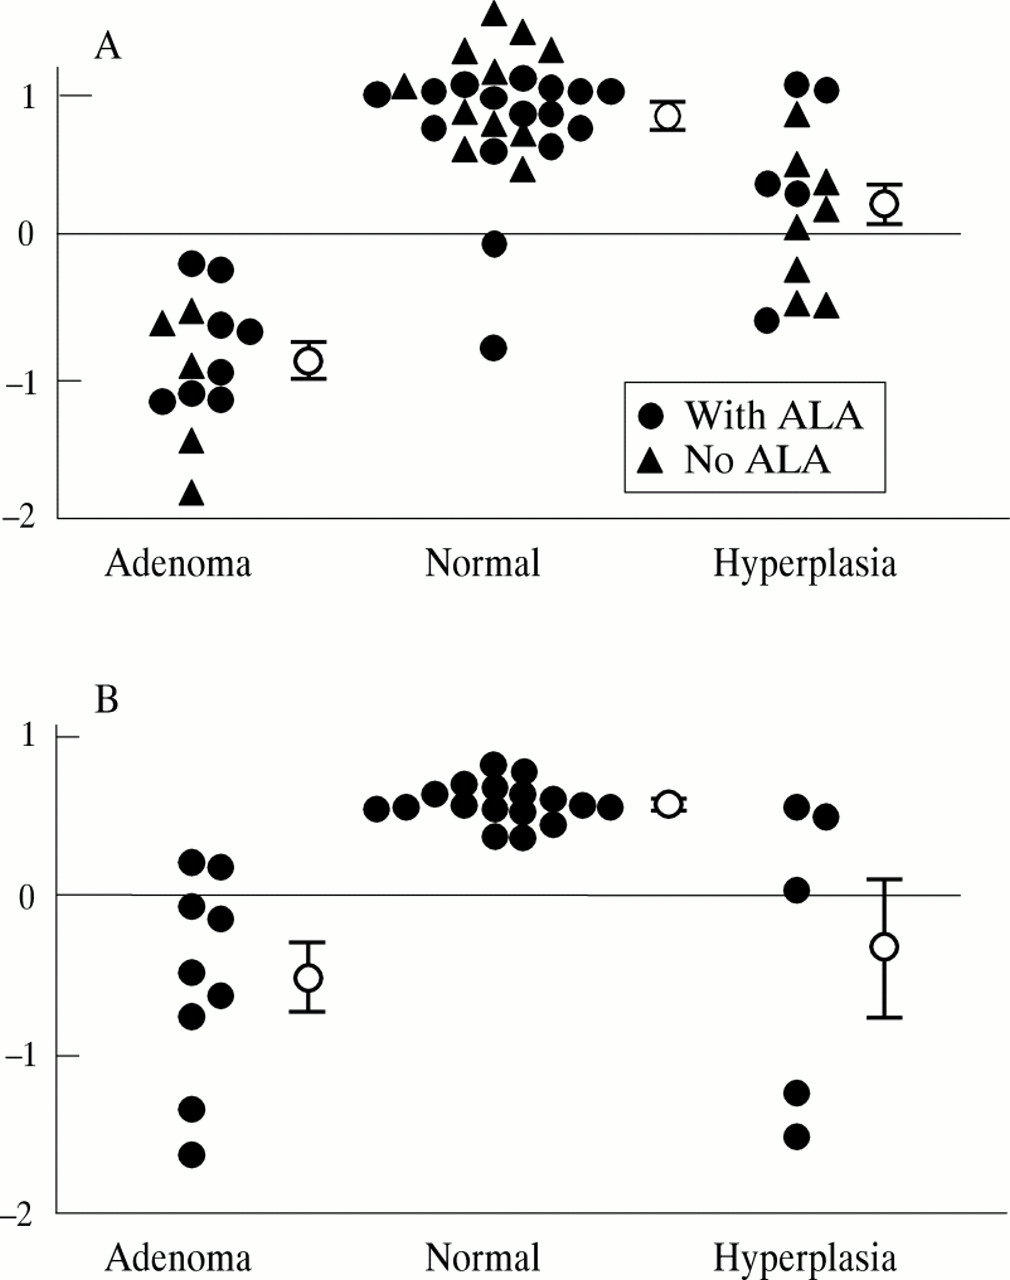
The number of wavelengths included in the regression model is five (409, 440, 498, 572, and 661 nm) in the case of 337 nm excitation, six (498, 543, 560, 590, 602, and 661 nm) for 405 nm excitation without ALA, six (498, 543, 560, 572, 602, and 661 nm) for 405 nm with ALA, six (498, 543, 560, 572, 590, and 602 nm) for 436 nm without ALA, and two (498 and 661 nm) for 436 nm with ALA. It might be desirable to use a model based on fewer fluorescence wavelengths, to simplify the instrumentation and make the method more statistically robust. The results for 337 nm excitation and 405 nm with ALA when using just two wavelengths, shown in fig 4, are similar to those obtained with many detection wavelengths. At 337 nm excitation with evaluation at 409 and 543 nm, 25 of 27 normal points and 13 of 13 adenomatous polyps were correctly classified. At 405 nm excitation with ALA, evaluation at 498 and 661 nm, 17 of 17 normal points and seven of nine adenomas were correctly classified. An unpaired Student’st test gave p<0.001 when comparing normal points with adenomas in both cases. When comparing hyperplastic polyps with adenomas, p values were <0.001 at 337 nm excitation and <0.01 at 405 nm excitation. Thus, it would be possible to find simpler criteria and to apply a system using fewer detection wavelengths to distinguish between these tissue types.
MVLR results using two evaluation wavelengths. The circles with error bars represent mean scores with standard errors. (A) 337 nm excitation, evaluation at 409 and 543 nm; (B) 405 nm excitation, ALA patients, evaluation at 498 and 661 nm.
Discussion
During colonoscopy there are several situations where a reliable differential diagnosis between neoplastic and non-neoplastic mucosa is difficult to make by visual examination: endoscopic assessment of the mucosa after previous endoscopic polypectomy with respect to residual adenomatous tissue at the polypectomy site; differentiation of inflammatory polyps associated with inflammatory bowel diseases, which frequently are impossible to distinguish from adenomas; determination of which polyps are clinically relevant for removal and which can be left unresected, in cases where multiple polyps are found; and increasing the efficacy of biopsy sampling for histopathology by guiding the endoscopist to tissue areas harbouring atypical cells.
Previous papers have suggested the use of LIF for non-invasive identification of adenomatous tissue in the colon,1 ,2 ,16 ,17 ,22 thus reducing the time, cost, and complication risk associated with the endoscopic examination. Our in vivo point measurements imply that good discrimination between normal tissue and adenomatous polyps can be obtained with this technique.
The described results reflect how well LIF measurements compare with histopathology from biopsied sites. This means that the sensitivity and specificity obtained is for LIF classification, rather than detection, of lesions.
LIF with 337 nm excitation gives a sensitivity of 100% and a specificity of 96% using stepwise MVLR analysis. Excitation with 405 or 436 nm gives a poor result without ALA, but these wavelengths are good alternatives in ALA patients. With ALA, 436 nm excitation gives a sensitivity of 86% and a specificity of 100%. The analysis was repeated for 337 nm excitation and 405 nm excitation with ALA, this time with just two wavelengths included in the evaluation. The conclusion from this new analysis was that the number of detection wavelengths could be reduced if chosen properly, without seriously affecting the results. Our autofluorescence results are in good agreement with previous ex vivo colon fluorescence studies,1 ,2 ,16 while to our knowledge no other studies of ALA induced fluorescence have been performed on human colonic tissue.
A Student’s t test comparing adenomas to hyperplastic polyps gave p values of <0.001 for 337 nm, and <0.01 for 405 nm with ALA, using either few or many detection wavelengths. The low number of hyperplastic polyps in this study makes it difficult to optimise the system for discrimination between hyperplastic and adenomatous polyps, although this might be of greater interest than the discrimination between normal mucosa and adenomas. However, the results are promising even without this optimisation, and future work addressing this question is planned.
It is interesting to note that when performing the stepwise regression analysis for 405 nm with ALA, the most significant wavelengths are 498 and 661 nm. One would expect that 631 nm, which is close to one of the PpIX fluorescence peaks, would be more significant than 661 nm at the edge of the same peak. It has been shown that photobleaching of PpIX results in a new fluorescence peak at 670 nm.24 However, the light fluence rate at 405 nm excitation was about 20 mJ/cm2 and it has been reported25that the bleaching fluence of PpIX in vivo is 17 J/cm2. The bleaching fluence corresponds to the fluence required to reduce the concentration to 1/e = 0.37 of the initial value. Thus, no photobleaching can be expected in this case. The autofluorescence at 661 nm is much lower than at 631 nm. Thus, a possible explanation for the choice of wavelength might be that the intensity at 661 nm is less dependent on the autofluorescence than at 631 nm.
The dysplasias in the colorectal mucosa usually range from a few cell layers’ thickness to less than a millimetre. With the excitation wavelengths used, the probed tissue depth ranges from approximately 200 μm at 337 nm excitation to 500 μm at 436 nm, matching the extent of the lesions well.
This study suggests that there is no apparent advantage in using ALA as the autofluorescence results with 337 nm are promising. However, in cases such as fluorescence imaging, when there are technical reasons for choosing a higher excitation wavelength, ALA greatly enhances the demarcation of diseased tissue in the colorectal area.
ALA has several advantages compared with other fluorescent markers. It is an endogenous substance that occurs naturally in humans and its selective uptake in tumours is high. The risk of skin photosensitisation is virtually non-existent at a dose below 10–15 mg/kg body weight. In addition, ALA can be given orally a few hours before the examination. However, the use of porphyrin based markers is complicated by the presence of endogenous porphyrins in the bowel mucosal secretion and in the faeces. Endogenous porphyrins exhibit an identical fluorescence pattern to that of ALA induced porphyrins. In some patients, the fibre had to be cleansed of mucus between the measurements. This clearly indicates the importance of a thorough bowel preparation before the examination.
Many studies have examined the possible fluorophores responsible for the tissue fluorescence. Another, perhaps equally important, aspect is the measurement geometry and the influence of tissue optical properties. For instance, Cothren and colleagues2 used a fibreoptic probe with one delivery fibre and nine collection fibres. The transport of the excitation light in the tissue and the observed fluorescence will be longer in this case than if a single fibre is used. The signal will be a combination of surface and subsurface emission and the influence of tissue optical properties such as blood absorption will be stronger. The same is true for different measurement geometries using a single fibre. If the fibre is held just above the tissue, it will collect light from a larger area, and thus the average light transport in the tissue will be longer, resulting in the larger influence of tissue optics than if the fibre tip is held in light contact with the tissue. This has to be considered before applying results obtained in a point monitoring geometry to imaging or measurements with different types of fibreoptic probes.
The most important goal of a reliable LIF assisted endoscopy in the future may well be the indication of subtle neoplastic mucosal areas that are invisible at conventional endoscopy. A point monitoring system based on a simple light source and using few diagnostic wavelengths might be interesting as it is relatively cheap to implement and easy to use.
Acknowledgments
The project was supported financially by Xillix Technologies Corporation, the Swedish Cancer Foundation, the Swedish Research Council for Engineering Sciences, and the Karolinska Institute. The assistance of the staff at the endoscopy section is gratefully acknowledged.
Abbreviations
- ALA
- δ aminolevulinic acid
- LIF
- laser induced fluorescence
- MVLR
- multivariate linear regression
- PpIX
- protoporphyrin IX