Article Text

Abstract
BACKGROUND Helicobacter pylori, the main cause of chronic gastritis, is a class I gastric carcinogen. Chronic gastritis progresses to cancer through atrophy, metaplasia, and dysplasia. Precancerous phenotypic expression is generally associated with acquired genomic instability.
AIM To evaluate the effect of H pylori infection and its eradication on gastric histology, cell proliferation, DNA status, and oncogene expression.
METHODS/SUBJECTS Morphometric and immunohistochemical techniques were used to examine gastric mucosal biopsy specimens from eight controls, 10 patients withH pylori negative chronic gastritis, 53 withH pylori positive chronic gastritis, and 11 with gastric cancer.
RESULTS All patients with chronic gastritis were in a hyperproliferative state related to mucosal inflammation, regardless of H pyloriinfection. Atrophy was present in three of 10 patients withH pylori negative chronic gastritis and in 26 of 53 with H pylori positive chronic gastritis, associated in 18 with intestinal metaplasia. DNA content was abnormal in only 11 patients with atrophy and H pylori infection; eight of these also had c-Myc expression, associated in six cases with p53 expression. Fifty three patients withH pylori positive chronic gastritis were monitored for 12 months after antibiotic treatment: three dropped out; infection was eradicated in 45, in whom cell proliferation decreased in parallel with the reduction in gastritis activity; atrophy previously detected in 21/45 disappeared in five, regressed from moderate to mild in nine, and remained unchanged in seven; complete metaplasia disappeared in 4/14, and markers of genomic instability disappeared where previously present. In the five patients in whomH pylori persisted, atrophy, metaplasia, dysplasia, and markers of genomic instability remained unchanged.
CONCLUSIONS ChronicH pylori infection seems to be responsible for genomic instability in a subset of cases of H pylori positive chronic atrophic gastritis; eradication ofH pylori infection can reverse inflammation and the related atrophy, metaplasia, and genomic instability.
- H pylori infection
- atrophic gastritis
- genomic instability
- eradication therapy
Abbreviations
- PCNA
- proliferating cell nuclear antigen
- AgNOR
- nucleolar organiser region
Statistics from Altmetric.com
Helicobacter pylori, the main cause of chronic gastric disorders, has been defined as a class I gastric carcinogen.1 However, only a minority ofH pylori positive patients with chronic gastritis develop gastric cancer, and the link betweenH pylori and gastric carcinoma is unclear.2
Gastric carcinogenesis is a multistep process progressing from chronic gastritis through glandular atrophy, metaplasia, and dysplasia.3-6 Atrophic gastritis and intestinal metaplasia may be the long term consequences of H pylori infection,7 ,8 but it is debatable whether or not bacterial eradication reverses these lesions.9-12Acquired genomic instability, which is typical of the phenotypic expression of precancerous lesions, generally precedes neoplastic clonal expansion.13 ,14
Chronic H pylori infection damages gastric barrier function15 ,16 and stimulates gastric cell proliferation,3 ,17-22 which leads to mucosal repair,22 ,23 but which can also induce cellular DNA damage.3 ,17-22 ,24 ,25 The most frequent epiphenomenon of DNA alteration is activation of oncogenes and/or mutation of oncosuppressor genes.26-29 The role of these genes has been studied in colon carcinogenesis30-34 and, to a lesser extent, in gastric carcinogenesis,34-39 but their interrelation with H pylori infection has yet to be defined. The aim of our study was to detect the relation between H pylori infection and gastric carcinogenesis evaluated as the appearance of genomic instability and the associated phenotypic expression. To this aim we investigated gastric histology, cell proliferation, DNA content, and bcl-2, p53, and c-Myc expression in patients with chronic gastritis with and withoutH pylori infection and afterH pylori eradication therapy.
Materials and methods
SUBJECTS
The study population consisted of 82 subjects (52 men and 30 women, age range 24–75 years). They were consecutively recruited from 1 January 1995 to 30 June 1995 from a population of 680 subjects referred to our department for dyspepsia according to the following entry criteria: no antisecretory or antibiotic drugs in the previous two months; no anticoagulant drugs in the last week; no severe associated diseases (liver, kidney, cardiovascular, etc). They were subdivided into four groups according to histological features andH pylori status: eight H pylori negative controls affected by functional dyspepsia with normal gastric histology; 10 patients with H pylori negative chronic gastritis (nCG); 53 patients withH pylori positive chronic gastritis (pCG); and 11 patients with gastric cancer (three early and eight invasive, of which five were intestinal and three diffuse types). The pCG patients were also examined 12 months after eradication therapy (15 days of treatment with omeprazole 20 mg twice a day, clarithromycin 500 mg twice a day, and tinidazole 500 mg twice a day). H pylori status was evaluated by histology and the13C-urea breath test as described in the Maastricht consensus report.40 The presence of CagA protein, a marker of H pylori virulence,41 was investigated only in 25/53 of pCG patients. Informed consent was obtained from all subjects.
At study entry and at one year after eradication therapy, at least nine gastric biopsy specimens were taken during upper endoscopy in the body, angulus, and antrum of each subject (three from each site). For cancer patients, gastric samples were obtained from the surgical specimen. The specimens were immediately fixed in 10% neutral buffered formalin, embedded in paraffin wax, and routinely processed. Histological, immunohistochemical, morphometric, and DNA ploidy evaluations were performed on all biopsy samples independently by two pathologists. After the independent reviews, each case was evaluated jointly and disagreements were resolved by consensus.
HISTOPATHOLOGICAL DIAGNOSIS
Haematoxylin and eosin stains were used for the histopathological diagnosis; the modified Giemsa stain was used for H pylori identification. Presence of H pylori, degree of inflammatory reaction and glandular atrophy, intestinal metaplasia, and cellular dysplasia were diagnosed and classified according to the updated Sydney system42 in each biopsy sample. The diagnosis of atrophy, defined as loss of glandular tissue, was based on agreement between the pathologists on at least two samples for each site investigated.
IMMUNOHISTOCHEMISTRY
For each case, 4 μm thick serial sections were cut from paraffin wax blocks, mounted on acid-cleaned glass slides, and heated at 55°C for 60 minutes. Slides were dewaxed and rehydrated, then the endogenous peroxidase activity was inhibited by incubation with 3% H2O2 in methanol (20 minutes at room temperature). To reduce non-specific background staining, slides were incubated with 5% goat serum (15 minutes at room temperature). To enhance immunostaining, sections were treated with an antigen retrieval solution (10 mM citric acid monohydrate, pH 6.0, adjusted with 2 M NaOH) and heated three times in a microwave oven at high power for five minutes. Finally, slides were incubated with the appropriate primary antisera in a moist chamber overnight at 4°C. The monoclonal primary antibodies used were: anti-proliferating cell nuclear antigen (anti-PCNA, PC10; DBA, Milan, Italy; dilution 1:500); anti-bcl-2 protein (Dako, Milan, Italy; dilution 1:400); anti-c-Myc protein (Oncogene Science, San Diego, California, USA; c-Myc p62, dilution 1:50); anti-p53 protein (NCL-CM1, YLEM, Rome, Italy; dilution 1:150).
Immunohistochemical staining reactions for each of the antibodies tested were compared within corresponding areas of the tissue sections from the consecutive slides. The avidin-biotin-peroxidase complex procedure (ABC standard; Vector Laboratories, Burlingame, California, USA) was then performed as described by Hsu et al.43 Peroxidase activity was detected with diaminobenzidine as substrate. Finally, sections were weakly counterstained with Harris’s haematoxylin and coverslipped with a synthetic mounting medium.
Negative controls with normal human serum replacing specific primary antibodies were included in each run. Positive controls were a case of colon adenocarcinoma for p53 protein, a normal lymph node for c-Myc and PCNA, and a case of a low grade follicular lymphoma for bcl-2 protein. Sections were considered positively stained only in cases of unequivocal nuclear staining for p53, c-Myc, and PCNA, and cytoplasmic staining for bcl-2.
The degree of immunopositivity was evaluated semiquantitatively. A total of 300 cells was counted in random fields from representative areas of the lesions, and the immunoreactive cells were roughly assessed and expressed as percentages. The scoring system for all the antibodies tested was: 0–5% (negative); 5–25% (low positivity); 25–50% (moderate positivity); >50% (high positivity).
STAINING AND COUNTING OF NUCLEOLAR ORGANISER REGIONS (AgNORS)
For each case, a 4 μm section was dewaxed in xylene and rehydrated through graded ethanol to deionised distilled water. AgNOR staining was performed as described by Egan et al.44 The final working solution was obtained by dissolving gelatin in 1% aqueous formic acid at a concentration of 2%, and mixing it with a 60% aqueous silver nitrate solution (1:2, v/v). This silver colloid solution was applied to the sections (60 minutes at room temperature, shielded from daylight). The sections were then washed with deionised distilled water, and counterstained with Mayer’s haematoxylin, dehydrated, and mounted with a synthetic medium. The usual controls were performed as described by Crocker and Nar.45
MORPHOMETRIC ANALYSIS
A Leica Quantimet 500C-Image analyser and processing system was used for morphometric analysis. Images were recorded by a JVC TK-1280E videocamera, connected to a Leitz Orthoplan light microscope. A QWIN V01.00 software package elaborated the data. Within the selected fields, a final number of 200 consecutive nuclei of cells from each case were measured with a × 40 lens. Image acquisition and colour detection were performed in “RGB” (an option that allows the selection of red, green, and blue). Artefacts and image overlapping were corrected in Binary Edit. The AgNOR number for each nuclear area, the area of nucleus and each AgNOR, and the total area of AgNOR were calculated automatically, as were AgNOR length, breadth, perimeter, roundness, and the aspect ratio of each nucleus.46 ,47 The perimeter was rectified using a correction factor of 1.064. Values are expressed in μm.
DNA PLOIDY
The Feulgen (sulphuric acid-fucsin) technique was used for nuclear DNA staining of a section from each case, deparaffinised in xylene and rehydrated through decreasing concentrations of ethanol. Cellular DNA was quantified using a microprocessor-controlled image analysis system (Leica-Quantimet 500C analyser, a Sony Ccd camera, and a Leitz Orthoplan microscope). Leica-QWIN V0200A software was used to analyse the data. At least 200 cells from each patient were examined in non-consecutive random fields of representative areas of the lesions. The following indexes were determined for each measurement: normal diploid DNA content (2c); 2c deviation index (2cDI), defined as the variance in DNA content of single cells around the normal diploid (2c) DNA peak; 5c exceeding events (5cEE), defined as the percentage of cells with DNA content higher than 5c; DNA malignancy grade (DNA-MG), a logarithmic transformation of the 2cDI value to produce a continuous scale ranging from 0 to 3.0 DNA content.48 The methodology described here has been fully validated in gastric biopsy samples.49
ANTI-CagA SERUM
The H pylori strain CCUG 17874 (CagA+) was denatured in Laemmli buffer50 at 100°C for five minutes and electrophoresed in a 10% polyacrylamide gel with sodium dodecyl sulphate. Proteins were transferred to nitrocellulose sheets which were saturated with 3% defatted milk in phosphate buffered saline and 0.1% Triton X (Blotto). Strips were cut out, and serum samples were assayed at a dilution of 1:200 in Blotto. After overnight incubation at room temperature, strips were washed with Blotto, and then incubated with anti-human IgG conjugated with peroxidase at room temperature for 90 minutes. After washing, the reaction was visualised by addition of the substrate (H2O2 in a solution of 0.3% 4-chloro-I-naphthol in 0.05 M Tris/HCl buffer, pH 6.8). An anti-CagA antibody raised in rabbit against a recombinant CagA fragment served as a positive control.
STATISTICAL ANALYSIS
We set the power to 0.8, with type I error = 0.05 and control to case ratio 1:1. The aim was to detect a minimal difference of 30% between nCG and pCG groups. Data were analysed with the SPSS package for Windows. The categorical variables (H pylori infection, cell infiltration, atrophy, intestinal metaplasia, dysplasia, DNA ploidy, p53, and c-Myc) were analysed using the χ2 test or Fisher’s exact test. Correlation between these variables was assessed using the Spearman correlation coefficient. The non-parametric Mann-Whitney U test was used to compare the DNA values (2c, 2cDI, 5cEE, and MG), AgNOR area, and PCNA expression in gastric crypt sections of patients with functional dyspepsia and gastritis with and without H pylori infection. The Wilcoxon matched pair test was used to evaluate PCNA expression in gastric crypt sections of patients with gastritis with H pylori infection before and after eradication therapy.
The analysis of the “before” and “after” data in theH pylori positive group given eradication treatment was evaluated with the McNemar test.
Results
Table 1 shows the clinical, histological, and immunohistochemical variables of the population studied. Mean age increased in rank order from normal controls to patients with chronic gastritis and to those with gastric cancer; male sex was prevalent in H pylori related disease and gastric cancer. A gastric and/or duodenal erosive/ulcerative disease was detected in 30% of nCG cases and 55% of pCG cases. The inflammatory infiltrate consisted of neutrophils in pCG patients and mainly lymphomonocytes in nCG. Gastric atrophy was mild in 30% of nCG subjects and was generally restricted to the antrum. Atrophy was detected in 49% (26/53) of pCG patients; it was mild and restricted to the antrum in five patients, and moderate, extending to the angulus, in 21 patients. Complete intestinal metaplasia, associated with atrophy, was found in 1/10 nCG and 16/53 pCG patients (restricted to the antrum in 10 of the latter). Incomplete metaplasia with atrophy was found in antral biopsy specimens from only 2/53 pCG patients. These two patients also had an abnormal DNA content and p53 and c-Myc overexpression. Gastric dysplasia, detected in the antrum of 3/53 pCG patients (one mild and two moderate), was associated with intestinal metaplasia (one complete and one incomplete), c-Myc and/or p53 overexpression in two cases, and abnormal DNA content in all three. Figure 1 gives the histological and immunohistochemical features and DNA content in pCG patients.
Frequency of clinical, histological and immunohistochemical variables in the population studied

Distribution of histological and immunohistochemical features and DNA content in 53 H pylori positive patients with chronic gastritis. *16 complete and two incomplete.
Cell proliferation, assessed by evaluation of PCNA expression (figs 2and 3) and AgNOR silver staining, number, and morphometric variables, was increased (table 2 and fig 4) with respect to healthy controls in patients with gastritis regardless of H pylori infection, and associated with the inflammation. AgNOR expression was higher (about 3- to 5-fold) in patients with gastric cancer than in the other groups (table 2). PCNA expression was 2-fold higher in the lower basal portion of the gland in pCG patients with intestinal metaplasia compared with pCG patients without intestinal metaplasia (fig 2).

Immunohistochemical expression of proliferating cell nuclear antigen (PCNA) in gastric crypt sections (as indicated on the figure; a mean of five well oriented crypts for each patient) of patients with functional dyspepsia, H pylori negative chronic gastritis, or H pylori positive chronic gastritis, with or without complete intestinal metaplasia (IM), before and after H pylori eradication. LI, labelling index, expressed as percentage of PCNA positive nuclei; C, controls with functional dyspepsia; nCG, H pylori negative chronic gastritis; pCG IM−, H pylori positive chronic gastritis without intestinal metaplasia; pCG IM+, H pylori positive chronic gastritis with complete intestinal metaplasia; IM−, chronic gastritis without intestinal metaplasia after H pylori eradication; IM+, chronic gastritis with intestinal metaplasia after H pylori eradication. †Three patients dropped out; intestinal metaplasia disappeared in four subjects.

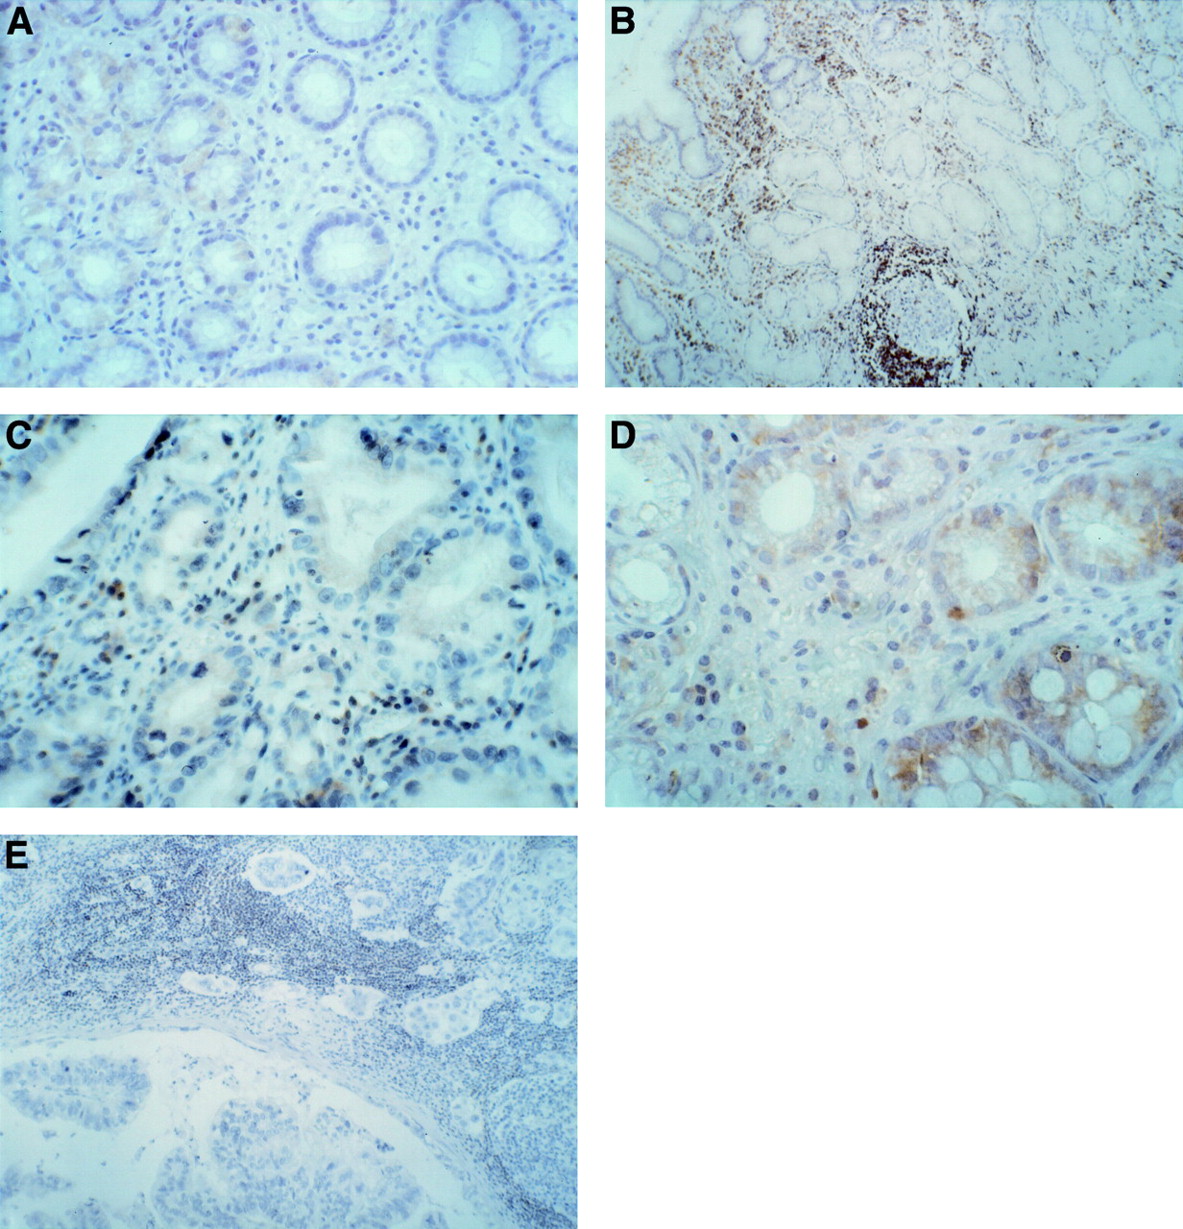
Proliferating cell nuclear antigen (PCNA) immunostaining of the gastric mucosa. (A) H pylori negative chronic gastritis with expression of PCNA in the nuclei of the cells of the glandular neck; (B) H pylori positive chronic gastritis; (C) H pylori positive chronic gastritis with intestinal metaplasia; (D) H pylori positive chronic gastritis after successful eradication treatment; (E) invasive gastric cancer showing high levels of PCNA positivity. Note the low labelling index of PCNA in the adjacent normal mucosa. Original magnifications: A, × 250; B, × 150; C × 400; D, × 250; E, × 150.
Nucleolar organiser region (AgNOR) counts (number and area) in gastric crypt sections of patients with gastritis with and without Helicobacter pylori infection and gastric cancer

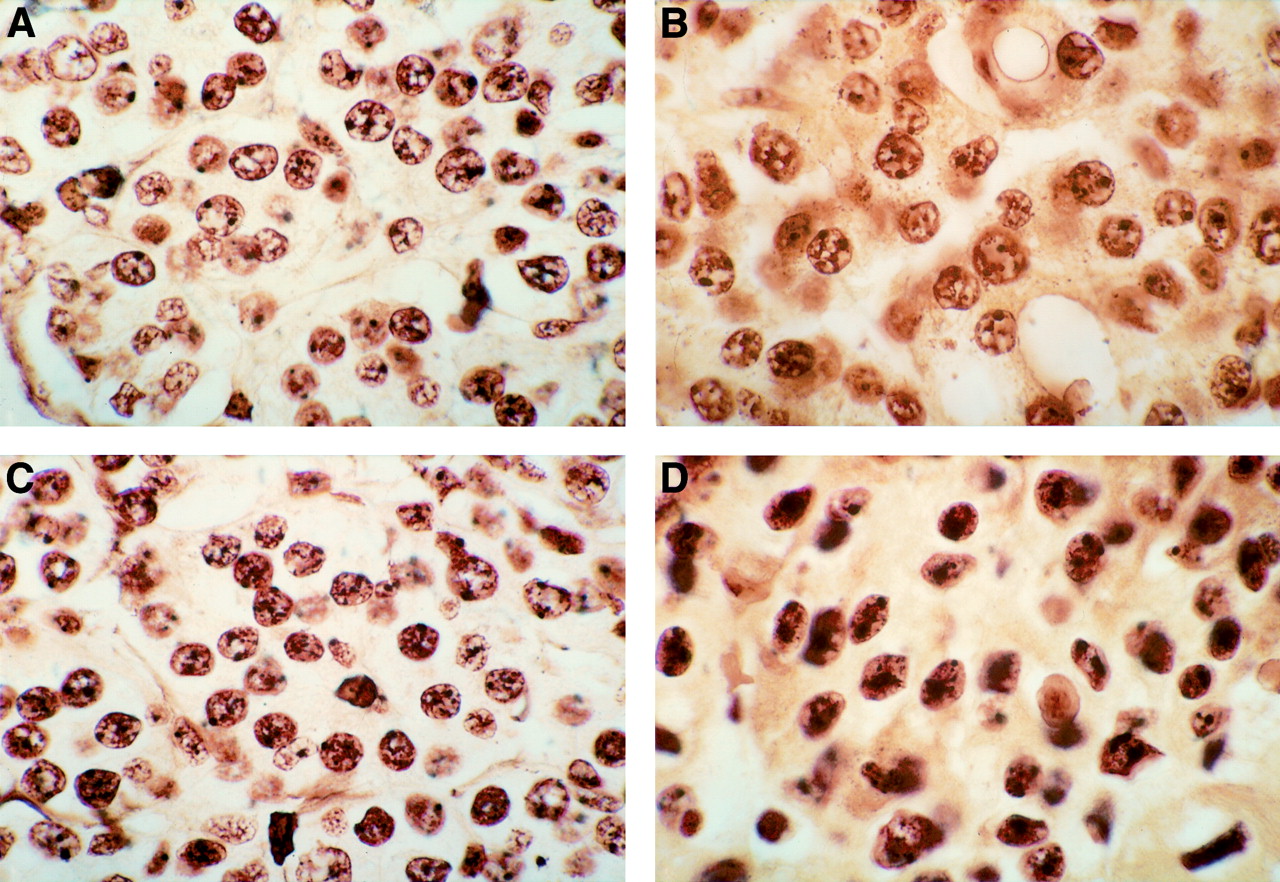
Silver stained nucleolar organiser regions (AgNORs) in gastric mucosa. (A) H pylori negative chronic gastritis: small to medium-sized AgNORs in the nuclei. (B) H pylori positive chronic gastritis: medium-sized irregular AgNORs in the nuclei. (C) H pylori positive chronic gastritis, after eradication treatment. (D) Gastric cancer: large, irregular and sometimes unusually shaped AgNORs in neoplastic cells. Original magnification: A, B, C and D, × 1000, oil immersion.
Expression of bcl-2 was preserved in controls and the gastritis groups, regardless of H pylori infection, intestinal metaplasia, and dysplasia (fig 5A−D). In gastric cancer, bcl-2 was expressed at very low levels in three early cancers and was not detectable in the remaining eight invasive cancers (fig 5E).
bcl-2 protein expression. (A) H pylori negative chronic gastritis: moderate bcl-2 expression. (B) H pylori positive chronic gastritis. (C) H pylori positive chronic gastritis with dysplasia: low bcl-2 expression. (D) H pylori positive chronic gastritis: moderate expression of bcl-2 protein in areas of intestinal metaplasia. (E) Nodal metastasis from gastric cancer: negative for bcl-2 protein in gastric cancer cells. Original magnifications: A, × 250; B, × 250; C, × 400; D, × 250; E, × 100.
Image analysis of DNA content showed aneuploidy in 11/53 pCG patients, confined to biopsy specimens in which atrophy was present, and in all gastric cancer patients (fig 6). The DNA values (DNA indexes, 2cDI, 5cEE, and MG) were higher in gastric cancer than in pCG with aneuploidy (table 3). There were no significant differences in DNA values between the remaining groups (nCG with euploidy versus pCG with euploidy; table3) or with regard to sex and age of patients (data not shown). Aneuploidy was significantly associated with atrophy (11/11) and expression of p53 (6/11) and c-Myc (8/11) oncoproteins (fig 1 and table4).

Representative DNA ploidy patterns in Feulgen stained sections of gastric mucosa. (A) H pylori positive chronic gastritis with moderate dysplasia: mild degree of aneuploidy. (B) H pylori positive chronic gastritis not responsive to eradication therapy without dysplasia: mild degree of aneuploidy. (C) Aneuploid pattern in gastric cancer (image analysis Quantimet 500C).
Gastric mucosa DNA ploidy variables in patients with gastritis and gastric cancer
Spearman correlation coefficient (p<0.0001) of the main parameters analysed in the H pylori positive chronic gastritis group
The expression of c-Myc was low to moderate in 8/53 pCG patients (fig7A, B); all these patients also had an abnormal DNA content, and two had glandular dysplasia (fig 1). A moderate to strong c-Myc positivity was detected in 4/11 gastric cancers (fig 7C), while c-Myc was undetectable in control subjects and nCG patients.

c-Myc expression. (A) H pylori positive chronic gastritis: low to moderate positivity for c-Myc expression. (B) H pylori positive chronic gastritis with intestinal metaplasia: moderate degree of positivity for c-Myc protein. (C) Gastric cancer: positivity for neoplastic cells for c-Myc protein. Original magnifications: A, × 400; B × 400; C × 100.
Finally, p53 was overexpressed in 63% (7/11) of gastric cancers (fig8C) and in 15% (8/53) of pCG (fig 8A, B); six of the latter also had abnormal DNA content and gastric metaplasia (fig 1). No control subject nor nCG patient showed p53 expression.
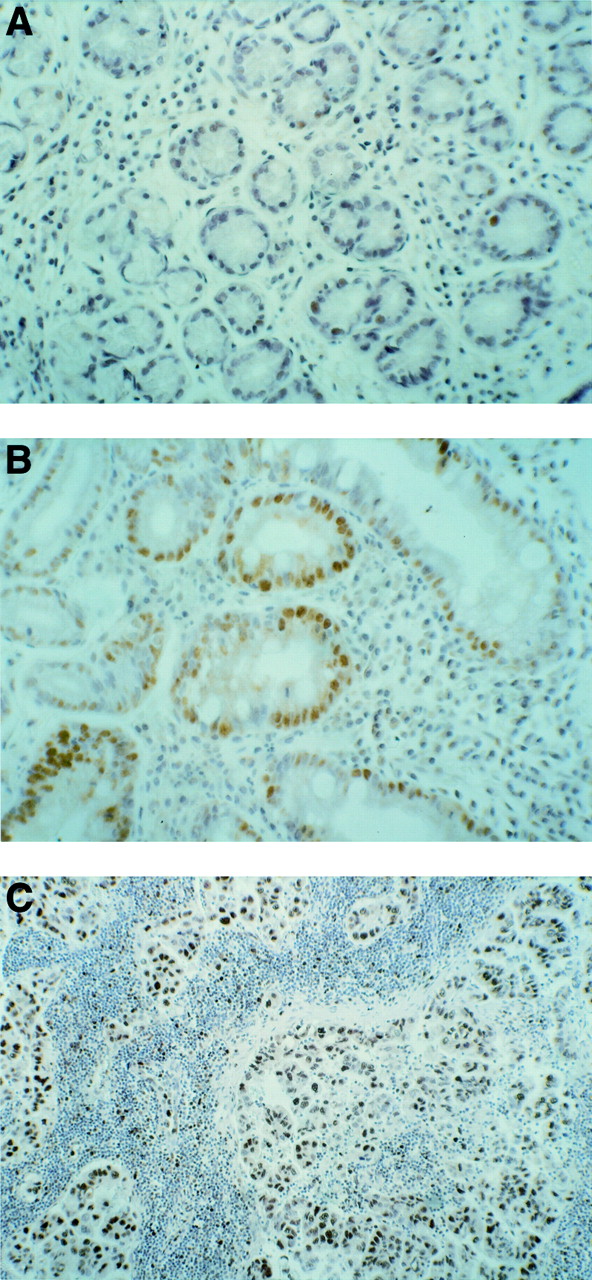
p53 protein expression. (A) H pylori positive chronic gastritis: sparse low positivity for p53 protein. (B) H pylori positive chronic gastritis with intestinal metaplasia: positivity for p53 protein in areas of intestinal metaplasia. (C) Gastric cancer: high positivity for p53 protein. Original magnifications: A, × 250; B, × 250; C, × 100.
The frequency of DNA aneuploidy, and p53 and c-Myc expression in relation to histological findings shows that aneuploidy and p53 and c-Myc expression were invariably associated with atrophy and were more pronounced in patients with intestinal metaplasia (fig 1).
The H pylori CagA status, investigated in 25/53 patients, was positive in 22 and negative in three. Atrophy was present in 54% of the CagA positive patients, intestinal metaplasia in 36%, dysplasia in 4%, DNA aneuploidy in 22%, and c-Myc and p53 expression in 22% and 18% respectively. However, the small number of subjects with CagA negative H pyloriprevented statistical evaluation.
One year after antibiotic treatment, the study protocol was repeated in the 53 pCG patients (table 5). Three patients dropped out.H pylori was eradicated in 90% of patients (45/50), in whom cell proliferation, PCNA expression (fig 3E) and AgNOR staining (fig 4C) decreased in parallel with the reduction in inflammatory infiltrate, whereas no significant difference was detected in patients with intestinal metaplasia (fig 2). The intensity of neutrophil infiltration was directly related to the rate of mucosal cell proliferation in the patients who were responsive toH pylori eradication treatment (p<0.02). Atrophy disappeared completely in five patients (all with mild atrophy restricted to the antrum); it regressed from moderate to mild only in the antrum in nine and remained unchanged in seven. Complete metaplasia associated with atrophy disappeared in four of 14 patients. Finally, DNA aneuploidy and p53 and c-Myc expression, previously detected in eight, six, and five of the 45 patients respectively, disappeared.
Histological and genomic parameters in 53 H pylori positive patients with chronic gastritis before and after eradication therapy
In the five subjects in whom H pyloriinfection persisted after eradication therapy, atrophy, metaplasia, dysplasia, and markers of genomic instability remained unchanged.
Discussion
Concurrent or previous H pyloriinfection is associated with a 2.7- to 12-fold risk of gastric cancer.2 Carcinogenesis invariably starts with cell hyperproliferation.2 ,3 ,51 ,52 The relation betweenH pylori infection, gastric mucosal damage, and the cell proliferation rate is a matter of debate.H pylori urease activity and leucocyte infiltration have a mitogenic effect,3 ,19 ,53-55 but gastric cell hyperproliferation also occurs independently ofH pylori infection.56 ,57 In our study, the gastric epithelial proliferative rate, evaluated using PCNA and AgNOR analyses, was increased in gastric cancer and chronic gastritis, regardless of H pylori infection (figs 2-4 and table 2). Therefore mucosal cell hyperproliferation appears to be a constant finding of chronic gastric damage whatever the aetiology, but it is related to inflammatory infiltrates which were prevalently lympho−monocytic in nCG and made up of polymorphonuclear leucocytes in pCG (table 1). Mucosal hyperproliferation is linked to apoptosis, and there is mounting evidence that H pylori induces apoptosis.58 ,59 The bcl-2 proto-oncogen is involved in controlling apoptosis and is related to the initial phase of cancer.60 ,61 The expression of the bcl-2 gene was unaltered in our patients with chronic gastritis, regardless of H pylori infection, which supports the idea that H pylori induced apoptosis occurs through a mechanism that is independent of bcl-2 gene expression.62 bcl-2 gene expression was also preserved in our patients with early gastric cancer, but was undetectable in advanced cancer. This finding contrasts with reports of bcl-2 overexpression in intestinal type gastric cancer.37 ,38 It is conceivable that the discrepancy is related to differences in populations studied and in the type, staging, and grading of cancer.
A chronic hyperproliferative state may also favour cellular DNA damage.3 ,17-22 ,24 ,25 We detected a relation between chronic hyperproliferation and cellular DNA damage only inH pylori positive patients with active gastritis. Therefore the cytotoxic effect of H pylori infection and the related polymorphonuclear leucocyte infiltration may play important roles in the development and progression of mucosal damage. Aberrant DNA is a prognostic indicator for cancer49 ,63-65 and seems to be independent of other clinical pathological factors.66 We detected aneuploidy in all our cancer patients, but we also identified a novel subset of pCG patients with aneuploidy (11/53) (table 3). Aneuploidy was significantly associated with c-Myc and/or p53 expression (fig 1 and table 4), which are the most widely used markers of genomic instability.
The c-Myc oncogene is implicated in the transformation and progression of mutated cells.67-69 In this study it was expressed in 36% of gastric cancer (4/11) and 15% of pCG (8/53) patients. This is a novel finding because the expression of c-Myc has not previously been investigated in chronic gastritis or in relation toH pylori status. c-Myc expression is more frequent in gastric adenocarcinoma than in adenoma and has also been proposed as an aid to differentiate between the two conditions.39 Half of the patients with c-Myc expression and aneuploidy had p53 overexpression, which was also detected in 63% of gastric cancer patients. The mutation of the p53 gene, which we found in 15% of pCG patients, is a common occurrence in colorectal carcinoma where it is related to a poor prognosis and distant metastasis.30-32 It has been reported in gastric cancer34 ,35 and precancerous gastric lesions36 but never in relation to H pylori infection.
Interestingly, aneuploidy and c-Myc and p53 expression were not detected in the absence of H pyloricontamination or in patients with H pyloriinfection but without gastric atrophy. Therefore, in our population, the appearance of genomic instability required the presence of both gastric atrophy and chronic H pyloriinfection (fig 1).
Several studies have shown that patients with preneoplastic and neoplastic gastric epithelial lesions are more likely to be infected by CagA positive strains70-74 which possess a genomic insertion called “cag pathogenicity island” which includes genes involved in virulence.41 Infection by CagA positiveH pylori strains increases the risk of developing atrophy and intestinal metaplasia possibly because of the enhanced inflammatory potential shown by these strains.70-73 Although investigated only in about 50% of pCG patients, the high prevalence of positivity for CagA (23 of 25 subjects studied) may help to explain the high incidence of atrophy (49%) and intestinal metaplasia (34%) observed in our patients. Furthermore, the enhanced prevalence of DNA aneuploidy and p53 and c-Myc expression in our patients is in agreement with the observation of an increased cancer risk in individuals infected by CagA positiveH pylori strains compared with individuals infected by Cag negative H pyloristrains74 and, more in general, in individuals who live in areas with a high rate of CagA positive H pylori strains.70 Unfortunately, we were not able to verify this hypothesis directly because of the small number of CagA negative patients in this study.
The effects of H pylori eradication on atrophy and related intestinal metaplasia are controversial and there is no consensus among gastrointestinal pathologists as to the identification and grading of these lesions. In a recent study, no changes in intestinal metaplasia and atrophy were detected afterH pylori eradication irrespective ofH pylori CagA status.9 In contrast, we found that H pylori eradication may be followed, one year after treatment, by the disappearance of complete metaplasia and/or reduction of atrophy (table 5), when both are present in the antrum. Other groups have reported similar results.11 ,12 The patchy nature of the lesions and the subjective nature of the interpretation may account for these controversial findings.75 ,76 However, according to a recent stringent definition of atrophy, “true irreversible” atrophy is differentiated from “apparent” atrophy which is reversed by removal of inflammation.77 Our finding of disappearance or regression of atrophy, mainly from the antrum, afterH pylori eradication suggests that inflammatory infiltration plays a role in this controversial histological finding, even though we cannot rule out the involvement of other factors such as age, sex, diet, genetic makeup of the host, nature of the lesions, biopsy sampling, H pylori strains, and environmental toxic factors. Long term studies and a larger number of stratified patients in relation to age of infection are needed to establish definitely the reversibility ofH pylori related lesions and the predictive value of genetic markers for H pylorieradication.
Our data confirm the significant link between such precancerous features as incomplete metaplasia and dysplasia and genomic instability. However, we found genomic instability in four cases not showing these morphological aspects (fig 1). It is noteworthy that in Barrett’s oesophagus, p53 overexpression precedes dysplasia in patients followed for about three years.78 ,79
In conclusion, chronic H pylori infection seems to be responsible for genomic instability in a subset of cases ofH pylori positive chronic atrophic gastritis and also in the absence of notorious precancerous lesions like metaplasia and dysplasia; eradication of H pylori infection can reverse inflammation and related atrophy, metaplasia, and genomic instability. Finally, we suggest that pCG patients with atrophy should receive eradication treatment forH pylori, while pCG patients withH pylori infection who do not respond to antibiotic treatment should be examined for markers of genomic instability and closely monitored.
Acknowledgments
We would like to thank Rosa Napolano and Antonella Coppeto for help and assistance with endoscopy and biopsy specimens and we are indebted to Jean Gilder for editing and revising the text. Preliminary data from this study were presented at the American Gastroenterological Association Meeting held on 10–16 May, 1997. This research was supported by a grant from MURST (40 and 60%) Rome, Italy.
Abbreviations
- PCNA
- proliferating cell nuclear antigen
- AgNOR
- nucleolar organiser region
References
Supplementary materials
- The authors of Nardone et al (Gut 1999;44:789-99) have conceded an error. Figure 3(B) is an inverted image of figure 3(A) at a different magnification. The correct figure is published below. The authors regret any confusion this may have caused (figure (F1) ).
