Article Text

Abstract
BACKGROUND Inflammatory bowel disease (IBD) is characterised by chronic intestinal inflammation and increased epithelial permeability. Both tumour necrosis factor α (TNF-α) and interferon γ (IFN-γ) have been implicated in IBD.
AIMS To understand better the effects of these cytokines on epithelial cell function.
METHODS T84 cells were cultured with IFN-γ and TNF-α and changes in transepithelial resistance (TER), fluorescein isothiocyanate (FITC) dextran flux, short circuit current (I sc), cystic fibrosis transmembrane conductance regulator (CFTR) protein levels, cell morphology, TNF receptor gene expression, and apoptosis were assayed.
RESULTS Relative to controls, significant changes (p<0.05) occurred in cells incubated with IFN-γ for two days: TER was decreased to 20 (6.2)%, FITC–dextran flux was increased by 109 (19)-fold, cAMP and Ca dependentI sc were decreased to 51 (6.4)% and 24 (2.2)%, respectively, and CFTR levels were decreased to 47 (11)%. Cell morphology was altered but cell death was not induced. TNF receptor mRNA levels were increased. When added with IFN-γ, TNF-α accelerated IFN-γ dependent changes. Relative to controls, significant changes occurred after one day of culture with IFN-γ plus TNF-α: TER was decreased to 27 (3.5)%, FITC–dextran flux was increased by 185 (45)-fold, and cAMP and Ca dependentI sc were decreased to 66 (12)% and 35 (6.8)%, respectively. TNF-α also enhanced IFN-γ dependent changes in cell morphology but did not induce cell death.
CONCLUSION IFN-γ alters T84 cell epithelial properties and TNF-α can enhance these effects, perhaps due to IFN-γ dependent increases in TNF receptor gene expression. Overall, these studies suggest that in IBD, TNF-α may have synergistic effects on IFN-γ mediated alterations of epithelial cell function.
- TNF receptor expression
- inflammatory bowel disease
- ion secretion
- transepithelial resistance;cystic fibrosis transmembrane conductance regulator
- apoptosis
Abbreviations used in this paper
- CFTR
- cystic fibrosis transmembrane conductance regulator
- FITC
- fluorescein isothiocyanate
- Isc
- short circuit current
- IBD
- inflammatory bowel disease
- IFN-γ
- interferon γ
- IL
- interleukin
- LDH
- lactate dehydrogenase
- TER
- transepithelial resistance
- TNF-α
- tumour necrosis factor α
- TNFR
- TNF receptor
Statistics from Altmetric.com
- TNF receptor expression
- inflammatory bowel disease
- ion secretion
- transepithelial resistance;cystic fibrosis transmembrane conductance regulator
- apoptosis
Inflammatory bowel disease (IBD) is characterised by chronic inflammation of the colon and small intestine. While the inciting stimulus for this process has not been identified, increasing evidence now exists for the role of inflammatory cytokines in the perpetuation of mucosal inflammation. For example, interferon γ (IFN-γ) secreting cells and mucosal IFN-γ mRNA levels are increased in Crohn’s disease.1 ,2 The number of cells expressing tumour necrosis factor α (TNF-α) mRNA and those secreting TNF-α is increased in IBD mucosa.3 ,4 Recent clinical trials with anti-TNF-α antibodies indicate that TNF-α plays an important role in the diseased state.5 ,6
Active inflammation can disrupt the barrier formed by the intestinal epithelium and may result in enhanced mucosal permeability to bacteria and/or bacterial products. These changes in barrier function may be due to the effect of cytokines on epithelial cells. When cultured with cytokines, epithelial cell lines can be used as an in vitro system for studying inflammatory processes. T84 cells, a colonic epithelial cell line, form monolayers with a high transepithelial resistance (TER) and exhibit both cAMP and Ca dependent short circuit currents (I sc) that are due to chloride secretion.7 ,8 Exposure to IFN-γ decreases T84 cell monolayer barrier functions,9 ,10 while the overall cytoskeletal structure seems to be maintained.10 Agonist dependent I sc is also decreased by culturing these cells with IFN-γ. IFN-γ alters the levels of two proteins involved in ion transport, the cystic fibrosis transmembrane conductance regulator (CFTR), and the Na,K,2Cl cotransporter.11 ,12
The effects of TNF-α on T84 cell properties are less well characterised. TNF-α has no effect on TER10 ,13 ,14; however, TNF-α increases the secretion or gene expression of several cytokines including interleukin 8 (IL-8) and TNF-α.15 ,16 The effects of TNF-α on several properties of IFN-γ treated cells have been examined. TNF-α and IFN-γ have synergistic effects on IL-8 secretion by T84 cells and induce high levels of VCAM-1 and ICAM-1 in other epithelial cell lines.15 ,17 ,18 In the colonic cell line, HT-29, TNF-α, and IFN-γ cause a synergistic inhibition of cell growth.19 The effects of TNF-α on other epithelial properties of IFN-γ treated cells have not been extensively studied, although a synergistic effect of TNF-α and IFN-γ on TER has recently been observed.20
In the present study, we utilised T84 cells to study the synergistic effects of IFN-γ and TNF-α on epithelial cell function. Our results suggest that TNF-α may have a synergistic effect on IFN-γ dependent alterations in intestinal barrier properties and ion secretion. These effects of IFN-γ and TNF-α may play a significant role in the pathophysiology of IBD.
Materials and methods
CELL CULTURE
T84 cells (ATCC, Rockville, Maryland, USA) were cultured as previously described.8 Cells, at passages between 52 and 76, were cultured at 37°C with 5% CO2 in a 1:1 mixture of Dulbecco’s modified Eagle medium:nutrient mixture F12 (containing 2.5 mM l-glutamine, 15 mM HEPES) supplemented with 10% heat inactivated fetal calf serum, 50 U/ml penicillin, 50 μg/ml streptomycin, and 50 μg/ml gentamycin (Life Technologies, Gaithersburg, Maryland, USA). For all studies, cells were seeded on human placental collagen coated (Sigma, St Louis, Missouri, USA), polycarbonate membranes (Costar, Cambridge, Massachusetts, USA) at 106 cells per cm2 and maintained until they had attained a TER greater than 1000 ohm·cm2 (usually 7–14 days). TER was measured with an epithelial voltohmmeter (EVOM; World Precision Instruments, Sarasota, Florida, USA). Based on the results of previous studies, T84 cells were treated with 100 ng/ml IFN-γ (1000 U/ml) and 1 ng/ml TNF-α (110 U/ml; R&D Systems, Minneapolis, Minnesota, USA).11 ,15 Except when noted, cytokines were present at these concentrations in both the apical and basolateral media. Stock solutions of cytokines contained 1 mg/ml bovine serum albumin (BSA). In all cases, BSA (1 μg/ml) was used as a control. An EVOM was used to monitor TER during cytokine treatments.
PARACELLULAR PERMEABILITY
Transepithelial flux of 10 kDa fluorescein isothiocyanate (FITC) dextran was assayed as previously described.21 Confluent T84 cell monolayers in transwells were incubated at 37°C with 5% CO2 in CO2 buffered Ringers (containing 145 mM Na, 125 mM Cl, 25 mM HCO3, 5 mM K, 2 mM H2PO4, 1 mM Mg, 1 mM SO4, 1 mM Ca, and 10 mM glucose, pH 7.4). FITC–dextran (1 mg/ml; Molecular Probes, Inc., Eugene, Oregon, USA) was present in the apical media. At one hour intervals for up to four hours, 100 μl samples were removed from the basolateral media, replaced with fresh media, and assayed fluorometrically. Rates were calculated by linear regression.
SHORT CIRCUIT CURRENT
Short circuit current was assayed by voltage clamping as previously described.8 Confluent T84 cell monolayers were mounted in modified Ussing chambers (Corning Costar, Cambridge, Massachusetts, USA), bathed with CO2 buffered Ringers, gassed with 95% O2-5% CO2, and maintained at 37°C. After a sustained baselineI sc was obtained, cells were stimulated with the basolateral addition of 5 μM forskolin. When stable responses were obtained, transient increases inI sc were observed on the addition of 100 μM carbachol. All values for forskolin stimulatedI sc reflect sustained currents while those for forskolin plus carbachol reflect peak values.I sc was measured and analysed with a VCC MC6 Voltage Current Clamp and software (Physiologic Instruments, San Diego, California, USA).
IMMUNOPRECIPITATION
CFTR protein was immunoprecipitated from T84 cells as previously described.8 ,22 After lysis with 4°C RIPA buffer (50 mM Tris, 100 mM NaCl, 50 mM NaF, 0.1 mM Na orthovanadate, 1% Triton X-100, 1% Na deoxycholate, 5 mM EDTA, 0.1 mM EGTA, 0.1% sodium dodecyl sulphate (SDS), 5 mM Na pyrophosphate, 0.1 mM phenylmethylsulfonyl fluoride (PMSF), and 0.1 mg/ml aprotinin at pH 7.5), CFTR was immunoprecipitated with anti-CFTR (C terminal) antibody (Genzyme Diagnostics, Cambridge, Massachusetts, USA) and PANSORBIN cells (Calbiochem, La Jolla, California, USA), phosphorylated with protein kinase A (Sigma, St Louis, Missouri) and γ32P-ATP (DuPont NEN, Wilmington, Delaware, USA), and resolved by SDS-PAGE (SDS polyacrylamide gel electrophoresis). Phosphorylated proteins were visualised by autoradiography, bands containing CFTR were excised, and32P was quantitated with scintillation counting.
HAEMATOXYLIN AND EOSIN STAINING
T84 cells were fixed in STF fixative (Streck Laboratories, Inc., Omaha, Nebraska, USA), processed, cleared in Histoclear Reagent (National Diagnostics, Inc., Manville, New Jersey, USA), embedded in paraffin wax, and cut into 5 μm sections. After haematoxylin and eosin staining, the monolayers were examined on a Leitz Fluovert FS microscope (Leica, Deerfield, Illinois, USA) with an Apo40UV lens (Olympus, Melville, New York, USA). The morphology of sections was evaluated by two blinded observers. Monolayers were scored from 1 to 3, with 1 requiring columnar cells with large, uniformly shaped, basolaterally located nuclei and 3 requiring non-columnar cells with randomly oriented nuclei which varied in size.
CYTOTOXICITY ASSAY
Lactate dehydrogenase (LDH) activity was assayed as previously described.23 After 48 hours of culture, 100 μl of apical media was placed in a 96 well enzyme linked immunosorbent assay (ELISA) plate (Corning Costar, Cambridge, Massachusetts, USA) with 100 μl of lactic acid dehydrogenase substrate mixture (5.4 × 10⁻²M l-(+)-lactate, 6.6 × 10⁻⁴ M 2-p-iodophenyl-3-p-nitrophenyl tetrazolium chloride, 2.8 × 10⁻⁴ M phenazine methosulphate, and 1.3 × 10⁻³ M NAD in 0.2 M Tris buffer, pH 8.2). Cells remaining on the filter were lysed with 1% Triton X-100, diluted with 1% Triton X-100, and assayed as for media. The absorbance at 490 nm was measured in an EL 340 Bio Kinetics microplate reader (Bio-tek Instruments, Inc., Winooski, Vermont, USA) every five minutes for 30 minutes. LDH activity in the supernatant was calculated from the change in absorbance with time by linear regression and expressed as percentage of the total LDH activity.
APOPTOSIS ASSAY
DNA laddering was assayed as previously described with minor modifications.24 ,25 Briefly, T84 monolayers were lysed by addition of hypotonic lysing buffer (10 mM Tris, 1 mM EDTA, pH 7.5) directly to the filters. Lysates were centrifuged at 16 000g for 10 minutes; supernatant was collected and precipitated for three days in 0.5 M NaCl and 50% isopropanol at −20°C. After centrifugation, the DNA pellets were air dried and resuspended in 10 mM Tris, 1 mM EDTA. DNA was analysed on 1.25% agarose gels in Tris-borate-EDTA buffer using 5× loading buffer containing 15 mM EDTA, 2% SDS, 50% glycerol, and 0.5% bromophenol blue. Gels were stained with ethidium bromide and visualised with an Eagle Eye (Stratagene, La Jolla, California, USA).
REVERSE TRANSCRIPTASE POLYMERASE CHAIN REACTION (RT-PCR)
Total RNA was isolated from T84 cells with an RNeasy Mini kit (Qiagen, Santa Clarita, California, USA). RNA was denatured at 75°C for three minutes and reverse transcribed for one hour at 42°C with an oligo d(T)15 primer (Promega, Madison, Wisconsin, USA) and Avian Myeloblastosis Virus reverse transcriptase (Promega). Amplification of cDNA was performed on a Perkin-Elmer 9600 PCR machine with AmpliTaq (Perkin-Elmer, Foster City, California) in 1× reaction buffer (0.17 mg/ml BSA, 16.6 mM (NH4)2SO4, 10 mM β-mercaptoethanol, 6.7 mM MgCl2, 6.8 μM EDTA, 16.6 mM Tris pH 8.8), with 250 mM each of dCTP, dATP, dTTP, and dGTP, and 5% dimethylsulphoxide (DMSO).26 All primers (Integrated DNA Technologies, Inc., Coralville, Iowa, USA) were chosen so that the amplified sequences spanned at least one intron. TNF receptor primers were designed from published gene sequences.27-29 TNF receptor p55 (TNFRp55) primers were 5′-CCCGAGTCTCAACCCTCAACTG -3′ and 5′-TCCACCTGACCCATTTCCTT TC-3′. TNF receptor p75 (TNFRp75) primers were 5′-CGCCCAGGTGGCATTTACAC-3′ and 5′-CACGTCTGATGTTTCAGTTCCT GG-3′. The size of the RT-PCR products are as predicted from the nucleotide sequences (476 bp for TNFRp55 and 406 bp for TNFRp75). To confirm the identity of the amplified sequences, sample RT-PCR products were cloned and sequenced. Glyceraldehyde 3-phosphate dehydrogenase (GAPDH) primers (5′-GGTCGGTGTGAACGGATTTG-3′ and 5′-GAGATGATGACCCTTTTGGC-3′) have been previously published.30 TNFRp55 sequences were coamplified with GAPDH sequences using 0.5 μM TNFRp55 primers and 0.1 μM GAPDH primers. The samples were initially held at 94°C for 2.5 minutes; then cycled through 94°C for 0.5 minutes, 55°C for 0.5 minutes, 72°C for 1.5 minutes, for 21 cycles; and then held at 72°C for 5.5 minutes. TNFRp75 sequences were coamplified with GAPDH sequences using 0.5 μM TNFRp75 primers and 0.025 μM GAPDH primers. The PCR conditions were the same as described above except 25 cycles were performed. The PCR reactions were analysed with agarose gel electrophoresis, visualised as in the apoptosis assay, and quantified with NIH Image software (Wayne Rasband, NIH, Bethesda, Maryland, USA).
STATISTICAL ANALYSIS
One way and repeated measures analysis of variance (ANOVA) were used to determine whether differences were present between multiple groups where dependent variables were measured on the interval scale (TER, flux, I sc, CFTR). The Tamhane adjustment, a posthoc test which accounts for unequal variances, was used for pairwise analysis. The Kruskal-Wallis test was used for the dependent variable measured as ranks (haematoxylin and eosin staining). Pairwise analysis of the haematoxylin and eosin staining was performed using the Mann-Whitney test with the Bonferroni correction for multiple comparisons. In all analyses, differences were considered to be statistically significant at p<0.05.
Results
CYTOKINE DEPENDENT LOSS OF BARRIER FUNCTION
To determine whether IFN-γ and TNF-α have direct effects on the barrier function of intestinal epithelial cells, we examined the effects of culturing T84 cells in the presence of these cytokines. Time courses were established for cytokine dependent changes by measuring TER at six hour intervals for 48 hours (fig 1). In the absence of added cytokine, or in the presence of TNF-α, the TER did not decrease. When monolayers were cultured in the presence of IFN-γ, there was no significant reduction in TER during the first 18 hours, but after 48 hours, the TER was significantly decreased compared with control. When monolayers were cultured with IFN-γ plus TNF-α, TER was significantly less than that of control or IFN-γ treated cells within 18 hours. After two days, the TER of IFN-γ plus TNF-α treated monolayers was not significantly different from those treated with IFN-γ alone. Thus, while TNF-α alone had no effect on TER, changes in TER occurred sooner in the presence of IFN-γ plus TNF-α than IFN-γ alone.

Time dependence of cytokine induced changes in transepithelial resistance (TER). Confluent T84 monolayers on permeable supports were cultured in the presence of vehicle (n=4), TNF-α (n=4), IFN-γ (n=6), or IFN-γ + TNF-α (n=7). TER is expressed relative to the initial TER of each monolayer. Average initial TER was 2200 (100) ohms·cm2. Data are means from two representative experiments. Error bars indicate SEM. *TER was significantly less than that for control (p<0.05).
To determine whether the effects of IFN-γ and IFN-γ plus TNF-α on TER occur with less cytokine, T84 monolayers were cultured with several concentrations of IFN-γ with and without TNF-α. After 24 hours of incubation with 0.01, 0.1, 1, 10, or 100 ng/ml of IFN-γ, there was no change in TER compared with control monolayers (fig 2). However, after 24 hours of incubation with 1, 10, or 100 ng/ml IFN-γ plus TNF-α, there were significant decreases in TER. After 48 hours of incubation with 1, 10, or 100 ng/ml IFN-γ, the TER was significantly decreased. The TER after incubation with IFN-γ and IFN-γ plus TNF-α at any given concentration of IFN-γ was not significantly different after 48 hours. Thus, changes in TER occurred sooner with 1, 10, or 100 ng/ml IFN-γ plus TNF-α than with the corresponding concentration of IFN-γ alone.
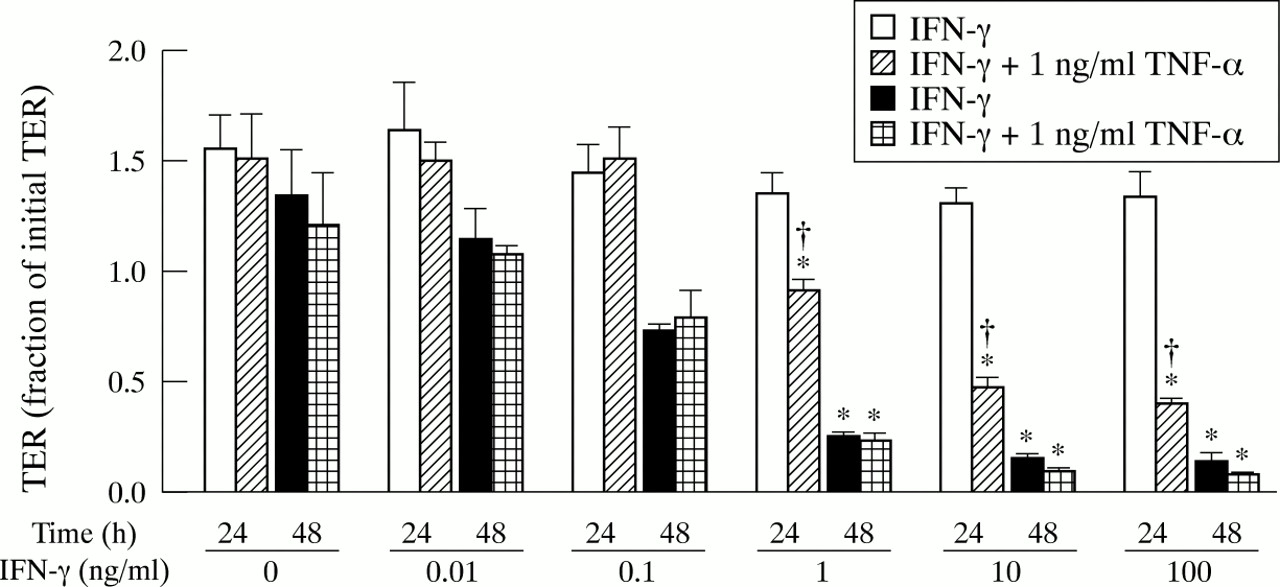
Dose response relation for interferon (IFN) γ dependent changes in transepithelial resistance (TER). TER is expressed relative to the initial TER at t=0 for each monolayer. Average initial TER was 1700 (100) ohms/cm2. Data are means from two experiments. Error bars are SEM. For all conditions, n=5. Where indicated, TER was significantly less than for control (*) of the same time point or IFN-γ treated (†) monolayers of the same time point and same IFN-γ concentration (p<0.05).
To determine the site of cytokine action, monolayers were cultured in the presence of apical or basolateral cytokine and TER was measured after 24 and 48 hours (table 1). Significant differences in TER required the presence of basolateral cytokine and were unaffected by the presence of apical cytokine. The TER was not decreased in the presence of TNF-α in the apical and basolateral media or in the presence of IFN-γ in the apical media. After 24 and 48 hours, the TER of monolayers were the same with IFN-γ in the basolateral media (without TNF-α) as those with IFN-γ in the basolateral media plus TNF-α in the apical media. These TER were significantly different from control at 48 hours but not at 24 hours. The TER of monolayers after 24 and 48 hours were the same with IFN-γ plus TNF-α in the basolateral media as those with IFN-γ plus TNF-α in both the apical and basolateral media. These TER were significantly different from control.
Transepithelial resistance (TER) in the presence of apical and/or basolateral cytokine
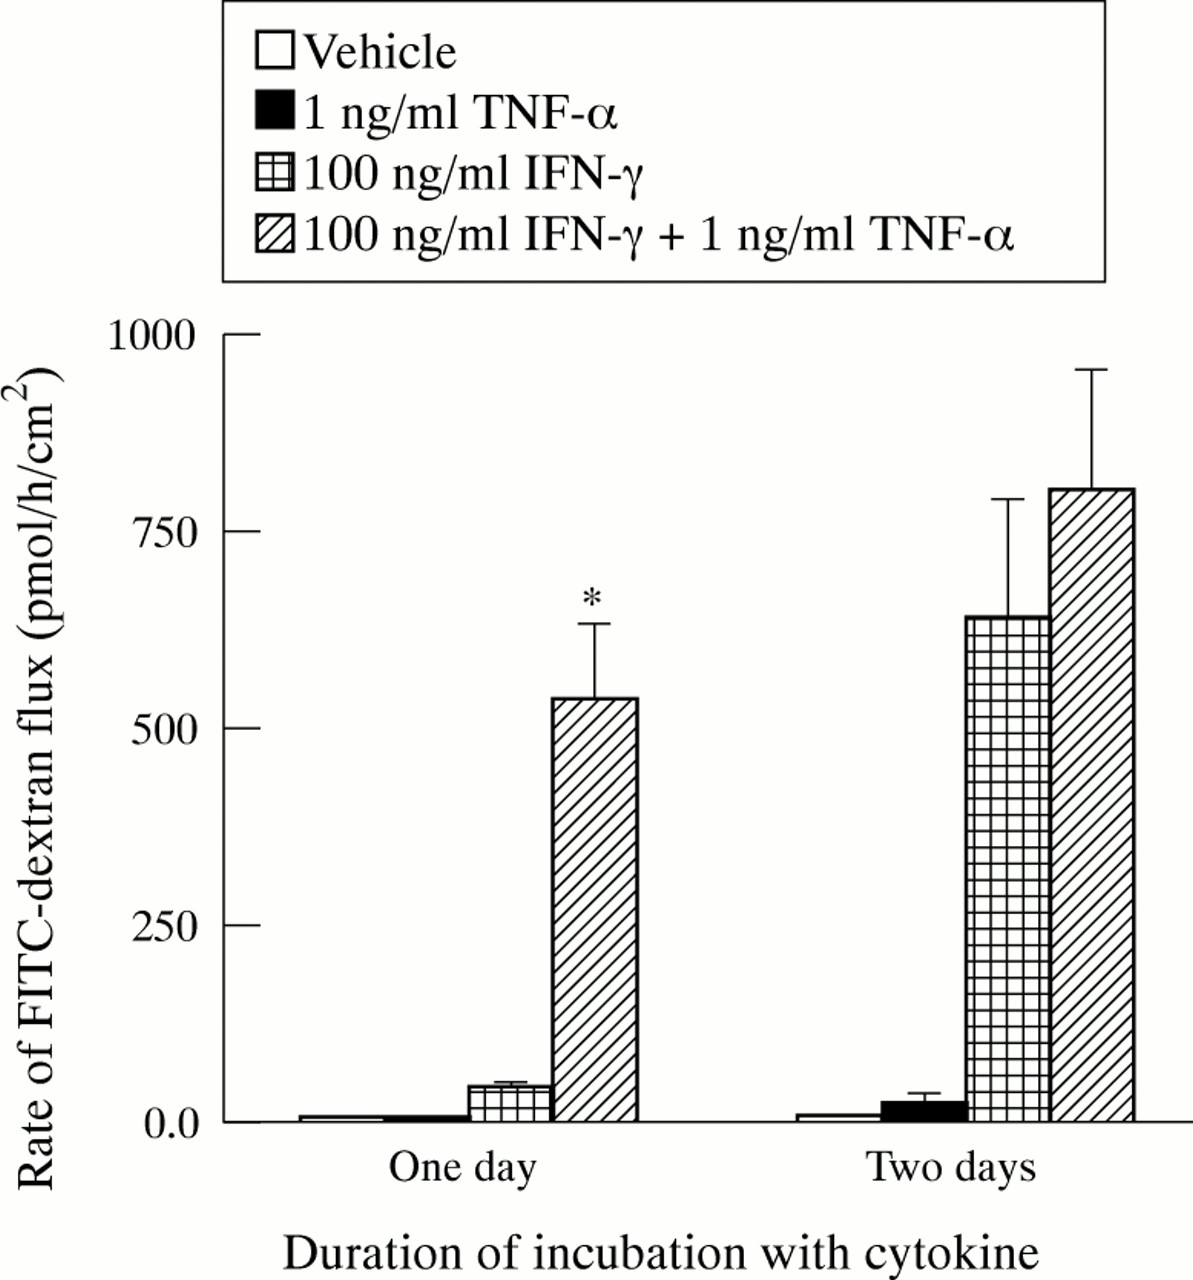
To determine whether cytokines also change the barrier function of T84 monolayers for large molecules, the rate of transepithelial flux of 10 kDa FITC–dextran was measured. The rate of flux across filters without cells was more than 1000-fold greater than the rate across control T84 monolayers. One way ANOVA results indicated differences in FITC–dextran flux after one and two days of treatment with cytokines. For monolayers cultured with TNF-α for one or two days, the rates of FITC–dextran flux were not significantly different from control rates (fig 3). For monolayers cultured with IFN-γ, the rate of FITC–dextran flux was significantly increased over control after one day. Treatment with IFN-γ plus TNF-α increased FITC–dextran flux signifcantly. After one day, the IFN-γ plus TNF-α dependent flux was significantly greater than the IFN-γ dependent flux. After two days, there was no difference in these values.

Cytokine dependent changes in transepithelial flux of fluorescein isothiocyanate (FITC) dextran. Flux rate was measured in two experiments after one day of culture with cytokines and two experiments after two days of culture with cytokines. All values are means (SEM). For one day, n=4, 3, 5, 5 for control, tumour necrosis factor (TNF) α, IFN-γ, and IFN-γ + TNF-α, respectively. For two days, n=4 for all conditions. Flux rates across control monolayers were 3.4 (0.4) pmoles/h/cm2 after one day of culture with cytokines and 5.8 (0.6) pmoles/h/cm2 after two days of culture with cytokines. Where indicated (*), flux rate was significantly greater than that for IFN-γ treated monolayers incubated for the same length of time (p<0.05).
EFFECTS OF IFN-γ AND TNF-α ON CHLORIDE SECRETION
To determine the effects of TNF-α and IFN-γ on chloride secretion, agonist dependent I scwas measured. In all cases, currents were shown to be due to chloride secretion by inhibition with 100 μM bumetamide (data not shown). As shown in fig 4A, the forskolin dependentI sc values of monolayers treated with cytokines for one day were not significantly different from those of control monolayers. After two days in the presence of IFN-γ, the forskolin dependent I sc was reduced significantly. After incubation for two days with IFN-γ plus TNF-α, the forskolin dependentI sc was significantly less than that obtained for control or after incubation with IFN-γ for two days.

Cytokine dependent inhibition of agonist induced Isc. (A) Isc was stimulated with forskolin (Fsk). Sustained currents for control monolayers were 58 (4) μA/cm2 and 55 (69) μA/cm2 after one and two days of culture, respectively. (B) Isc was stimulated with forskolin plus carbachol. Peak currents for control monolayers were 332 (22) μA/cm2 and 232 (44) μA/cm2 after one and two days of culture, respectively. All values are expressed relative to control values obtained in the same experiment and are means (SEM). For one day, n=4, 2, 4, 4 for control, tumour necrosis factor (TNF) α, interferon (IFN) γ, and IFN-γ + TNF-α, respectively. For two days, n=11, 6, 12, 3 for control, TNF-α, IFN-γ, and IFN-γ + TNF-α, respectively. Where indicated, relative Isc was significantly less than for control (*) or IFN-γ treated (†) monolayers incubated with cytokine for the same length of time (p<0.05).
The effects of incubating T84 cells with TNF-α and IFN-γ on theI sc induced by 5 μM forskolin plus 100 μM carbachol were also investigated (fig 4B). For cells treated with TNF-α, there was no statistically significant difference in peak values of forskolin plus carbachol dependentI sc compared with control at one or two days. After two days of incubation with IFN-γ, theI sc induced by forskolin plus carbachol was reduced. When monolayers were incubated with IFN-γ plus TNF-α, the forskolin plus carbachol inducedI sc was reduced compared with that of controls. While TNF-α did not cause a significant decrease in forskolin plus carbachol dependentI sc, it accelerated the loss ofI sc due to culture with IFN-γ.
In T84 cells, both forskolin and forskolin plus carbachol dependentI sc require activation of the CFTR chloride channel.8 To determine whether IFN-γ decreased I sc by reducing the level of CFTR protein, cells were cultured for one or two days with TNF-α, IFN-γ, or IFN-γ plus TNF-α. CFTR was immunoprecipitated and quantified (fig 5). For control lysates, the relation between CFTR and lysate protein was linear (data not shown). After treatment with TNF-α for one and two days, the CFTR protein levels were not different from control. One and two day treatments with IFN-γ significantly decreased the levels of CFTR protein. The values for monolayers that had been treated with IFN-γ plus TNF-α were not different from those treated with IFN-γ for one or two days.

Cytokine dependent inhibition of cystic fibrosis transmembrane conductance regulator (CFTR) protein levels. All values are means (SEM) relative to control. Data are from three experiments for one day of incubation with cytokine and four experiments for two days of incubation with cytokine. For one day, n=4, 6, 6, 9 for control, tumour necrosis factor (TNF) α, interferon (IFN) γ, and IFN-γ + TNF-α, respectively. For two days, n=7, 7, 8, 8 for control, TNF-α, IFN-γ, and IFN-γ + TNF-α, respectively. Where indicated (*), protein level was significantly less than values for control incubated for the same length of time (p<0.05).
CYTOKINE DEPENDENT CHANGES IN T84 CELL MORPHOLOGY
As shown above, cytokine treatment has significant effects on several T84 cell functions. The effects of two day cytokine treatment on cell morphology were assessed in haematoxylin and eosin stained monolayers (fig 6). In control monolayers, cells were closely packed and columnar. The nuclei were basolaterally located and uniform in size and shape. Monolayers treated with TNF-α were indistinguishable from control monolayers. Monolayers treated with IFN-γ had regions that were similar to normal monolayers but other regions were characterised by less ordered cells. In these regions, cells were less uniform in height and the nuclei were less uniform in shape. Monolayers treated with IFN-γ plus TNF-α were dramatically different. Although these monolayers seemed to be intact and confluent, they consistently lacked columnar cells. The nuclei were randomly oriented and varied in size and shape. Two monolayers for each culture condition were stained and five fields from each monolayer were evaluated and scored on a scale of 1 to 3. Median values (with first and third quartile values in parentheses) for control, TNF-α, IFN-γ, and IFN-γ plus TNF-α treated monolayers, respectively, were 2 (1,2), 2 (1,2), 2 (2,2), and 3 (3,3). IFN-γ plus TNF-α treated monolayers were significantly different from all other conditions.

Cytokine dependent changes in T84 cell morphology. Representative haematoxylin and eosin stained T84 cell monolayers that had been cultured for two days with vehicle (A), tumour necrosis factor (TNF) α (1 ng/ml) (B), interferon (IFN) γ (100 ng/ml) (C), or TNF-α (1 ng/ml) + IFN-γ (100 ng/ml) (D). Bar is 10 μm.
IFN-γ AND TNF-α DO NOT INDUCE CELL DEATH
Because fragmented nuclei were observed in the haematoxylin and eosin staining and TNF-α causes apoptosis in some systems,25 ,31 it was important to determine whether cell death was being induced in T84 monolayers by IFN-γ and TNF-α. Lactate dehydrogenase (LDH) activity was assayed in the apical media of T84 monolayers after 48 hours of culture. The percentage of total LDH activity in the apical media was 1.78 (0.38)% for control, 1.84 (0.36)% for TNF-α, 1.84 (0.28)% for IFN-γ, and 1.81 (0.35)% for IFN-γ plus TNF-α treated monolayers. These data are from two experiments and are expressed as means (SEM). For all conditions, n=6. There was no difference in amount of LDH released during incubation of T84 monolayers under these conditions. In addition, no DNA laddering was observed after one or two days of treatment with vehicle, TNF-α, IFN-γ, or IFN-γ plus TNF-α (data not shown). Thus, the morphological differences are not due to apoptosis.
EFFECTS OF TNF-α AND IFN-γ ON TNF RECEPTOR GENE EXPRESSION
As TNF-α alone has no effect on the parameters examined but TNF-α enhanced IFN-γ dependent effects, cytokine dependent effects on TNF receptor gene expression were analysed by RT-PCR. Expression of both TNFRp55 and TNFRp75 was investigated by coamplifying cDNA using TNF receptor and GAPDH specific primers (fig 7). In control experiments, the amount of GAPDH PCR product was correlated with the amount of cDNA (data not shown). RT-PCR products for TNFRp55 were detected in control monolayers and in monolayers treated with TNF-α for two days. However, treatment of T84 cells with IFN-γ or IFN-γ plus TNF-α for two days increased the level of TNFRp55 mRNA. RT-PCR products for TNFRp75 were not detected in control or TNF-α treated monolayers but were detected in IFN-γ and IFN-γ plus TNF-α treated monolayers. The RT-PCR results shown in fig 7 are representative of a total of 40 RNA samples for TNFRp55 and 28 RNA samples for TNFRp75. Smaller increases of TNFRp55 and TNFRp75 mRNA were observed in T84 cells treated with IFN-γ or IFN-γ plus TNF-α for 24 hours (data not shown). These results indicate that IFN-γ treatment of T84 monolayers increases the amount of mRNA for both TNFRp55 and TNFRp75.

Cytokine induced increases in TNFRp55 and p75 mRNA levels. RT-PCR was performed on T84 cell monolayers that had been cultured for two days with vehicle (lane 1), tumour necrosis factor (TNF) α (1 ng/ml) (lane 2), interferon (IFN) γ (100 ng/ml) (lane 3), or TNF-α (1 ng/ml) + IFN-γ (100 ng/ml) (lane 4). Ethidium bromide stained gels of TNFRp55 sequences coamplified with GAPDH sequences (A) and TNFRp75 sequences coamplified with GAPDH sequences (B) are shown. Gels are representative of three experiments for TNFRp55 and two experiments for TNFRp75. The labelled molecular weight markers (lane M) are 501/489, 404, and 331 bp.
Discussion
Altered intercellular communication between epithelial cells and intestinal immune cells, mediated in large part by cytokines, has been suggested to play a major role in the pathophysiology of IBD. Several observations support the potential involvement of IFN-γ in IBD. These include increases of IFN-γ secreting cells and mucosal IFN-γ mRNA.1 ,2 TNF-α also seems to be involved in the pathophysiology of IBD. Increased numbers of TNF-α secreting cells have been observed in the mucosa of patients with IBD3 ,4and recent studies, showing that anti-TNF-α antibodies produce remission, clearly indicate a role for TNF-α in the pathophysiology of IBD.5 ,6 This role may involve an enhanced responsiveness of intestinal epithelial cells to TNF-α which is caused by alterations in the concentration of other cytokines such as IFN-γ. This study addresses two questions: do IFN-γ and TNF-α have direct effects on epithelial cell function; and do they act synergistically?
Our studies confirm that IFN-γ has a direct effect on T84 cell function. Several T84 cell properties are altered by exposure to IFN-γ. These include barrier properties, such as TER and the paracellular flux of macromolecules; cell morphology; both cAMP and Ca dependent I sc; the concentration of CFTR protein; and TNF receptor gene expression.9 ,10 ,12 ,13 ,20 ,21 Significant changes in most properties were only seen when cells were cultured for two days in the presence of IFN-γ: the two exceptions were CFTR levels that declined during the first 24 hours but not thereafter, and TNF receptor gene expression that was enhanced after one day. These differences in response to IFN-γ may suggest that IFN-γ dependent changes are mediated by multiple signal pathways or that an initial alteration in protein synthesis must precede the changes inI sc and barrier function.
In contrast to IFN-γ, several previous reports have observed little effect of TNF-α on T84 cell properties.10 ,13 ,14 This was confirmed in our study. However, our data show that TNF-α had a synergistic effect on IFN-γ dependent changes in TER, paracellular flux, and agonist dependent I sc. When incubated with IFN-γ for two days, TNF-α also had a significant effect on cell morphology. These findings suggest that IFN-γ causes intestinal epithelial cells to become more responsive to TNF-α. However, the fact that TNF-α did not enhance IFN-γ induced changes in CFTR protein levels shows that not all IFN-γ dependent effects are mediated by a mechanism that is potentiated by TNF-α.
How might TNF-α exert a synergistic effect with IFN-γ but have little effect on its own? One possible mechanism would be for IFN-γ to induce the synthesis of TNF receptors. Two TNF-α receptors, p55 and p75, have been identified. They contain unrelated intracellular domains and are differentially regulated in several systems. Each receptor can mediate signal transduction, but they can also act cooperatively.32 IFN-γ increases TNF receptor expression in several cell lines.19 ,33 ,34 Our data and those of others20 suggest that the synergistic effects of TNF-α are due, at least in part, to IFN-γ dependent increases in the expression of one or both TNF receptors. Alternatively, when expressed at the basal level, TNF receptor may transduce a TNF-α dependent signal that has no observable effect on its own but is synergistic with an IFN-γ dependent signal.
Because TNF-α can induce apoptosis, some of the observed effects of IFN-γ and TNF-α may have been due to cell death. In HT-29 cells, IFN-γ plus TNF-α induces apoptosis, as measured by DNA fragmentation and a greater than 60% increase in the release of LDH.25 ,35 ,36 In the present study, the LDH activity present in the media after T84 monolayers were treated with IFN-γ plus TNF-α for two days was less than 2% of the total LDH activity and no cytokine treatment caused LDH activity in the media to be different from control. In addition, no DNA laddering was observed after cytokine treatment. These results indicate that the effects of these cytokines observed in the present study are not due to cell death. The differences in the effects of IFN-γ plus TNF-α on HT-29 cells and T84 cells may be due to the use of 2–5-fold less IFN-γ and 4–20-fold more TNF-α in the studies on HT-29 cells.
Our results showed that IFN-γ, but not TNF-α, reduced agonist dependent I sc. The IFN-γ dependent effects on cAMP dependentI sc only became significant after exposure to IFN-γ for two days; greater decreases were observed when both TNF-α and IFN-γ were present. In T84 cells, agonist dependent chloride secretion requires activation of an apical chloride channel, CFTR. Thus, CFTR protein levels were examined in an attempt to determine the mechanism by which these IFN-γ dependent decreases in agonist dependent Isc occur. Two groups have reported conflicting results on the effect of IFN-γ treatment on CFTR protein levels. One group reported no change, and the other observed a decrease in CFTR protein levels of T84 cells treated with IFN-γ.11 ,12 Neither group examined the effects of IFN-γ plus TNF-α. In the present study, CFTR protein concentrations decreased to approximately 40% of control when cells were treated with IFN-γ or IFN-γ plus TNF-α. However, decreases in CFTR protein were not paralleled by changes inI sc. This suggests that IFN-γ may inhibit agonist dependentI sc by several mechanisms, one of which is a decrease in the level of CFTR protein. A second mechanism may be the previously observed decrease in apical Na,K,2Cl cotransporter levels.11
This work shows that IFN-γ, and IFN-γ plus TNF-α, can alter T84 cell barrier properties. These changes were paralleled by changes in cell morphology. Alteration in cell morphology included loss of a uniform columnar shape of cells and fewer basolateral nuclei. These changes were enhanced in IFN-γ plus TNF-α treated monolayers to such a degree that the T84 cells took on a squamous appearance. The observed changes in barrier properties may be due to the resulting decrease in lateral intercellular space or to changes in the structure of tight junctions. Studies are underway to identify structural differences in junctions and alterations in the synthesis or post-translational modification of junctional proteins.
Our data show that T84 cells provide an in vitro model for study of the cytokine dependent alterations in epithelial barrier function and cell morphology that are seen in IBD. The synergistic effects of IFN-γ and TNF-α suggest an explanation for the role of TNF-α in IBD that would not require large increases in TNF-α. These synergistic effects also provide a possible explanation for the efficacy of anti-TNF-α antibody treatment for Crohn’s disease. This in vitro model should prove useful for the elucidation of other cytokine mediated mechanisms that alter epithelial function in IBD.
Acknowledgments
We thank Carol Barone for assistance with the histological studies, Saskala Raman, Marji Hiestand, Michele Burget, and Danielle Castango for technical support, Karin Yurko-Mauro for critical review of the manuscript, and Joe Glutting for assistance with the statistical analyses. This work was supported by grants from the Nemours Foundation (RP, WWR) and the Cystic Fibrosis Foundation (WWR).
Abbreviations used in this paper
- CFTR
- cystic fibrosis transmembrane conductance regulator
- FITC
- fluorescein isothiocyanate
- Isc
- short circuit current
- IBD
- inflammatory bowel disease
- IFN-γ
- interferon γ
- IL
- interleukin
- LDH
- lactate dehydrogenase
- TER
- transepithelial resistance
- TNF-α
- tumour necrosis factor α
- TNFR
- TNF receptor