Article Text

Abstract
BACKGROUND It is not known whethercagA+ Helicobacter pylori in duodenal ulcer (DU) have enhanced virulence compared with non-DU cagA+ H pylori.
AIMS To investigate the relation between presentation, H pylori density, interleukin 1β (IL-1β) and IL-8 production, andcagA status.
METHODS Fifty DU and 50 gastritis patients with cagA+ H pylori and 11 with cagA− infections were studied. Bacterial density and cytokine production were assessed using the same biopsies. Cytokine production was also measured from supernatants of medium following coculture of H pylori with MKN-45 cells.
RESULTS There was no relation between H pylori density andcagA status. There was a dose dependent relation between mucosal cytokine levels and density ofcagA+ H pylori. H pylori density increased to a threshold, followed by a rapid increase in cytokines and then a plateau. IL-1β and IL-8 levels in the antrum were greater in DU than in gastritis; in the corpus the cytokine level/H pylori differed irrespective of similar H pylori densities. However, cytokine production was similar in vitro, independent of presentation or biopsy site, suggesting that host factors are critical determinants of the inflammatory response. Mucosal IL-8 and IL-1β levels were low withcagA− andcagA+, cagE− H pylori infections.
CONCLUSIONS The increase in antral IL-1β and IL-8 production and inflammation in DU is related to increased numbers of bacteria and not to an increase in cytokine production per cagA+ isolate. There was no evidence of enhanced virulence of H pylorifrom DU compared with cagA+ non-DUH pylori.
- duodenal ulcer
- Helicobacter pylori
- interleukin 1β
- interleukin 8
- cagA
Abbreviations used in this paper
- DU
- duodenal ulcer
- IL
- interleukin
- MNC
- mononuclear cell
- PCR
- polymerase chain reaction
- PMN
- polymorphonuclear cell
Statistics from Altmetric.com
Attempts to identify virulent strains ofHelicobacter pylori, which are more likely to result in clinically important outcomes, have focused on two groups of potential bacterial virulence factors, thecag pathogenicity island (for whichcagA is a marker) and the vacuolating cytotoxin, VacA. The cagA gene is located in the most downstream portion of the cagpathogenicity island, a 40 Kb DNA region, containing open reading frames that code for a putative H pylorisecretion system.1 Although the mechanism is unknown, infection with strains that possess the cagpathogenicity island are associated with greater production of interleukin 8 (IL-8) than infection with strains without the island.1 The CagA protein itself is not directly responsible for IL-8 production as inactivation of thecagA gene does not eliminate the ability of isolates containing the pathogenicity island to stimulate IL-8 in vitro.1-3
It was recently reported that the density of infection withcagA positive H pylori(cagA+,vacA s1 type strains) was greater than withcagA negative strains (cagA−, vacA s2 strains).4 This suggests that the level of inflammation associated with cagA+ H pylori may be related to, or possibly the result of, an increase inH pylori density. This notion is also consistent with our previous observation that mucosal IL-1β and IL-8 production was closely related to H pyloridensity based on histology.5 ,6 We previously reported that production of IL-8 and IL-1β in the antral mucosa was greater in patients with cagA+ H pylori compared with those withcagA− H pylori;IL-8 production was closely related to IL-1β production in the antrum.5 We also reported that IL-8 production in the antral mucosa was greater in DU patients withcagA+ H pyloricompared with cagA+ infections in patients with non-ulcer dyspepsia.5
This study was designed to explore further the relation betweenH pylori density, IL-1β and IL-8 secretion in the antrum and corpus, and the presentation of H pylori infection (DU or non-DU gastritis). The relation betweenH pylori density and IL-1β and IL-8 production in gastric mucosa was investigated using the same biopsy specimens for quantitative culture and measurement of cytokine production. In addition, the ability of H pylori from DU and non-DU gastritis patients to produce IL-1β and IL-8 in vitro was compared using gastric cancer cell line MKN-45 in order to address the question of possible enhanced virulence among DU strains.
Methods
POPULATION
Fifty DU patients infected with cagA+H pylori (27 men, 23 women; mean age 52.7 years) and 50 age and sex matched cagA+H pylori infected patients without endoscopic evidence of DU (27 men, 23 women; mean age 53 years) were studied. All gastritis patients had histological gastritis without gastric or duodenal ulcer, gastric cancer, or oesophageal disease. In addition, 11 individuals with cagA−H pylori infection were studied (one DU and 10 gastritis; seven men, four women; mean age 53.5 years). Controls consisted of 50 age and sex matched asymptomatic volunteers who were negative for H pylori infection by the combination of negative culture, histology, and serology (27 men, 23 women; mean age 52.8 years).
Patients were excluded if they had received non-steroidal anti-inflammatory drugs, proton pump inhibitors, or antibiotics within the previous three months, as were those who had received recent blood transfusions or had undergone gastric surgery. Sixteen (32%) DU patients, 20 (33%) gastritis patients, and 15 (30%) volunteers were smokers. Informed consent was obtained from all patients and the protocol was approved by the ethics committee of Kyoto Prefectural University of Medicine. Forty four patients were included in our previous studies of inflammatory mediators in H pylori infection.5 All were Japanese.
The presence of H pylori was determined by culture of the biopsy specimens and the cagAstatus was evaluated by polymerase chain reaction (PCR), as described previously.5-7 In cases where strains werecagA gene negative by PCR,cagA status was confirmed as negative for CagA protein by immunoblotting, as described previously.8
Three biopsy specimens were taken, using the Olympus biopsy forceps FB-24KR, from the greater curve of the antrum (pyloric gland area) and corpus (fundic gland area). One specimen was used for quantitative culture and measurement of cytokines, while the other two specimens were used for histology. For the quantitative culture and measurement of cytokines, all cases in the antrum and 81 cases in the corpus were analysed from which 35 cases in each cagA+ DU and gastritis (sex and age matched) were randomly selected; all 11cagA− cases were also analysed.
QUANTITATIVE CULTURE OF H PYLORI
Biopsy specimens were immediately placed in 1.5 ml of phosphate buffered saline (PBS; pH 7.4), and homogenised using a tissue homogeniser (Kontes, Vineland, New Jersey); serial tenfold dilutions in 1.0 ml of PBS were performed within 10 minutes. Ten μl aliquots were spread on Skirrow agar medium containing horse blood (8%), vancomycin (10 μg/ml), polymyxin B (2.5 U/ml), and trimethoprim (5 μg/ml), and incubated at 37°C under microaerophilic conditions for up to five days. The organisms were identified as H pylori by Gram staining, colony morphology, and positive oxidase, catalase, and urease reactions. Viable counts were recorded and expressed as colony forming units (cfu) per mg of biopsy protein. In tenfold dilutions, the counts were found to vary within 13%. Multiple colonies were collected together and all stock cultures were maintained at −80°C in Brucella broth (Difco, Detroit, Michigan, USA) supplemented with 20% glycerol (Sigma Chem Co., St Louis, Missouri, USA). The passage number of the H pylori used in this study averaged three. Genomic DNA was extracted using the QIAamp Tissue kit (QIAGEN Inc., Santa Clarita, California, USA) according to the manufacturer's instructions.
POLYMERASE CHAIN REACTION
cagA status andvacA genotype were evaluated by PCR, as described previously.5-7 9-11 Furthermore, the primers 5′-TGCTGATACGATTAG AGA-3′ (CAGEF) and 5′-TAGTCCCTTAGT GATGAT-3′ (CAGER), and 5′-GCCATGTT AACACCCCCTAG-3′ (CAGGF) and 5′-TTA ATGCGCTAGAATAGTGC-3′ (CAGGR) were used to amplify thecagE and the cagGgene, respectively.1 ,12 PCR was performed using a DNA Engine (MJ Research Inc., Watertown, Massachusetts, USA) for 35 cycles, consisting of one minute at 95°C, one minute at 50°C, and one minute at 72°C. The final cycle included a seven minute extension step to ensure full extension of the PCR product.
GASTRIC HISTOLOGY
Two biopsy specimens, from within 5 mm of sites used for culture were embedded in paraffin wax, stained with haematoxylin and eosin and Giemsa stains, and examined by one histologist blinded to the patient's clinical diagnosis or the characteristics of theH pylori strain. The following features were evaluated on each slide: H pylori density, and degree of mononuclear cell (MNC) and polymorphonuclear leucocyte (PMN) infiltration. All variables were graded using the visual analogue scale graded from 0 (absent/normal) to 5 (maximal intensity), as described by El-Zimaity et al.13 The H pyloridensity was scored based on the average density on the surface and the foveolar epithelium. If areas with widely different scores were present on the same specimen, an average based on the general evaluation of the biopsy was used. Only areas without metaplasia were evaluated for the presence of H pylori.
IL-1β AND IL-8 PROTEIN MEASUREMENT IN BIOPSY SPECIMENS (IN VIVO CYTOKINE PROTEIN)
For IL-1β and IL-8 production from the biopsy specimens, the same specimen was studied as had been used for quantitative culture ofH pylori. Aliquots of homogenate supernatants in PBS (pH 7.4), obtained by centrifugation (10 000g for 10 minutes) after sampling for culture, were stored at −80°C until use. Total protein in biopsy homogenate supernatants was assayed by a modified Lowry method; IL-8 protein was measured by ELISA using commercially available assay kits (Research and Diagnostic Systems, Minneapolis, Minnesota, USA) according to the manufacturer's instructions. In our laboratory, the ELISA sensitivities of IL-1β and IL-8 were approximately 10.5 pg/ml and 10 pg/ml, respectively. The mucosal levels of cytokines were expressed as pg/mg biopsy protein.
IL-1β AND IL-8 PROTEIN MEASUREMENT FROM GASTRIC CANCER CELL LINE (IN VITRO CYTOKINE PROTEIN)
The human gastric cancer cell line MKN-45 was obtained from the Japanese Cancer Research Resources Bank. MKN-45 cells were routinely maintained in RPMI 1640 supplemented with 10% heat inactivated foetal calf serum and 40 μg/ml gentamicin. MKN-45 cells were plated into 24 well plates at a density of 1 × 10⁵/ml and cultured for two days to confluence (about 5 × 10⁵/ml). Each well was washed twice with antibiotic free tissue culture medium. MultipleH pylori colonies were collected together and all stock cultures were maintained at −80°C in Brucella broth (Difco, Detroit, Michigan) supplemented with 20% glycerol (Sigma). Stock frozen H pylori (pooled isolates from multiple colonies) was cultured in brain-heart infusion broth containing 5% horse serum with a gyratory shaker at 220 rpm for 24–48 hours, representing growth phases.
H pylori were harvested in PBS and suspended to yield a concentration of 5 × 10⁷ cfu/ml in antibiotic free tissue culture medium, and added to the cultured cells immediately (bacterium to cell ratio 100:1). Epithelial cells were cultured with bacteria preparations for 24 hours at 37°C in a 95% air and 5% CO2 humidified incubator. At the end of culture, supernatant fluids were aspirated and frozen at −80°C until assayed; cell viability was determined by trypan blue exclusion. No differences in epithelial cell viability in experimental and control culture without H pylori were evident. IL-1β and IL-8 in the supernatant were assayed in duplicate by ELISA (R&D Quantikine, R&D Systems Inc., Minneapolis, Minnesota, USA) and median concentrations were expressed as pg/ml.cagA gene/CagA protein positive strain, 88–23 (60190) and cagA gene/CagA protein negative strains 88–22 (Tx30) and 93–68 (kindly provided by Professor M J Blaser) were used as positive and negative controls for IL-8 production.
DATA ANALYSIS
The major groups were cagA+ DU,cagA+ gastritis, andcagA− gastritis. In the results and discussion the gastritis cases are designated as “gastritis”. In general the data were not normally distributed and comparisons were made using the Mann-Whitney rank sum test. Spearman's rank test order correlation was used to test for relations between independent variables. A p value of less than 0.05 was accepted as significant.
Results
H PYLORI GENOTYPE
All H pylori isolates studied werevacA genotype s1-m1. The majority ofcagA+ cases were alsocagE and cagGpositive; two gastritis cases (JK47A, B and JK72A, B) werecagE and cagGnegative. All cagA negative strains were also cagE andcagG negative. There were no inconsistencies in cagA status between isolates from the antrum and corpus (antrum cagA positive and corpus cagA negative).
INFECTION DENSITY AND PRESENTATION
H pylori density was similar when assessed by histological grading or by quantitative culture both in the antrum and corpus (r=0.89, p<0.0001 andr=0.74, p<0.0001, respectively).
H pylori density was not directly related tocagA status. In the antrum and corpus the H pylori density in gastritis cases was similar in cagA+ andcagA− patients (antrum: 5.1 (0.6) versus 5.2 (1.9) × 105 cfu/mg protein, p=0.65; corpus: 5.7 (1.1) versus 5.0 (2.4) × 105 cfu/mg protein, p=0.22, respectively; fig 1).

Helicobacter pylori density in antrum and corpus. The end of the bars indicates the 25th and 75th percentiles. The 50th percentile (median) is indicated with a solid line in the box; the broken line indicates mean value. The 10th and 90th percentiles are indicated with error bars. DU, duodenal ulcer.
In the antrum the average H pylori density in cagA+ DU patients was significantly greater than in cagA+ gastritis patients (14.4 (3.3) versus 5.1 (0.6) × 105 cfu/mg protein, p<0.05). In contrast, in the corpus H pylori density was significantly higher incagA+ gastritis patients compared withcagA+ DU patients (5.7 (1) versus 4.3 (1) × 105 cfu/mg protein, p<0.05; fig 1).
The density of H pylori in bothcagA+ DU andcagA+ gastritis was significantly correlated with antral cellular infiltration with MNC (r=0.83 and 0.67 for gastritis and DU, respectively) and PMN (r=0.80 and 0.79 for gastritis and DU, respectively; fig 2). In contrast, in the corpus the correlation between cagA+H pylori density and cellular infiltration with MNC or PMN was not significant (r=0.2 or less for both gastritis and DU; fig 2).
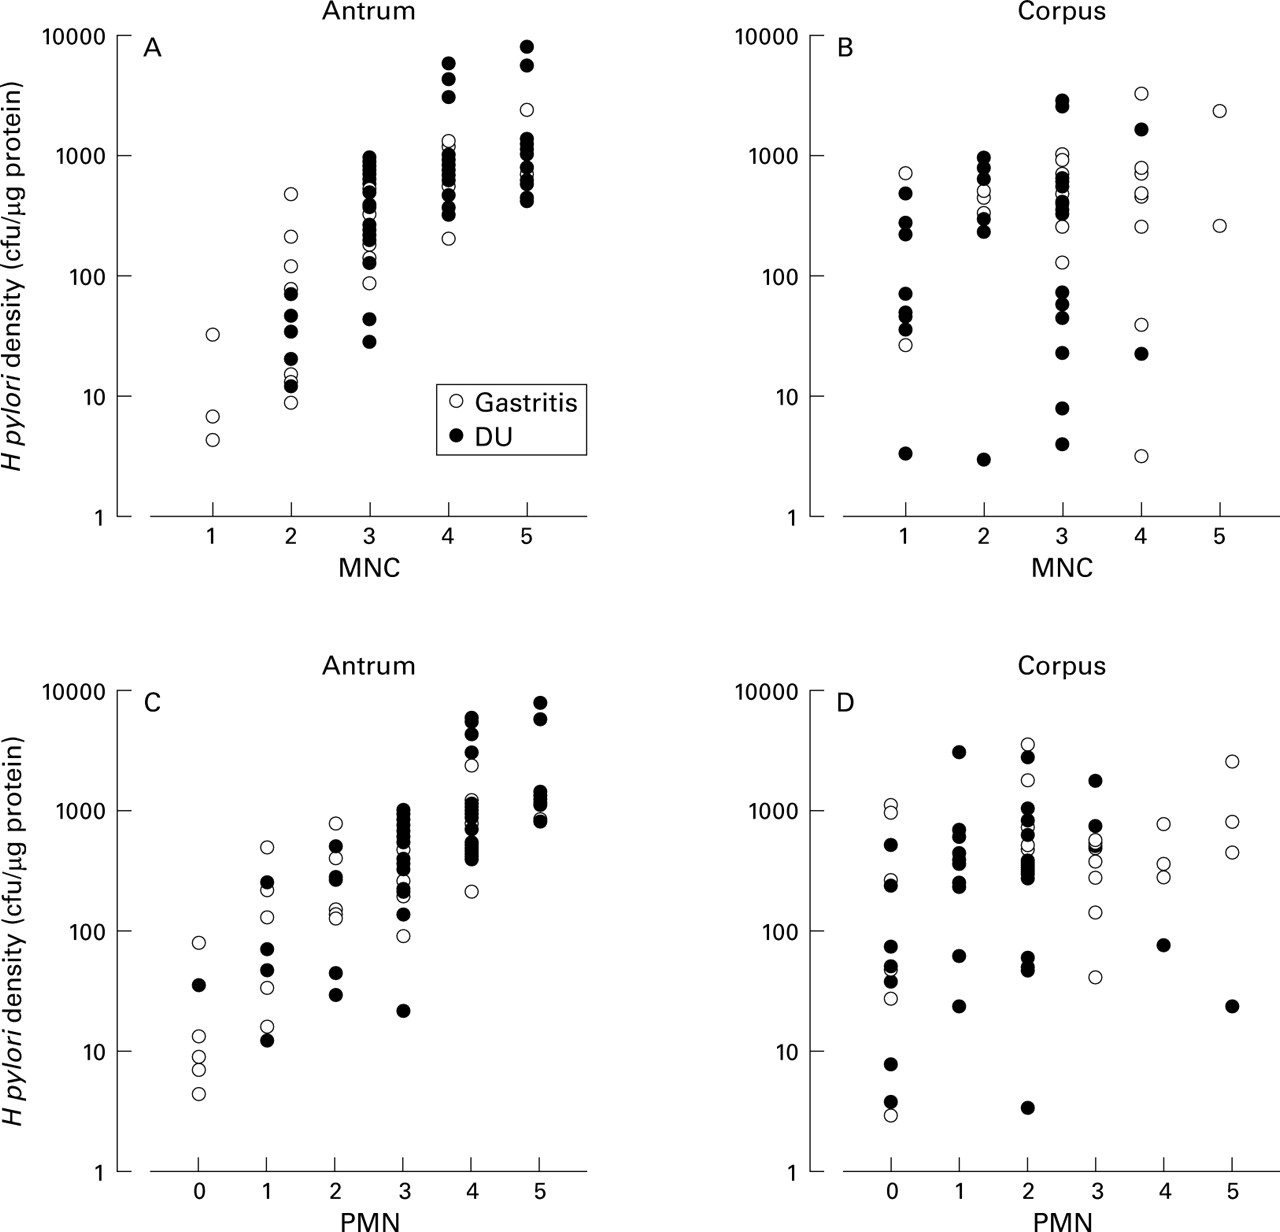
Relation between Helicobacter pylori density by culture and cellular infiltration in cagA+ cases. DU, duodenal ulcer; MNC, mononuclear cell; PMN, polymorphonuclear cell.
CLINICAL OUTCOME, cagASTATUS, AND HISTOLOGY
Antral cellular infiltration was significantly higher incagA+ DU cases than incagA+ gastritis cases and corporal cellular infiltration was significantly lower incagA+ DU cases than incagA+ gastritis cases (table 1). The degree of mucosal atrophy in both the antrum and corpus was significantly higher in cagA+ gastritis cases than incagA+ DU cases. Cellular infiltration and atrophy was present but significantly less incagA− gastritis cases than incagA+ gastritis cases.
cagA status, clinical outcome, and histology
IN VIVO IL-1β AND IL-8 PRODUCTION FROM BIOPSY SPECIMENS
Consistent with the findings regarding cellular infiltration, thecagA+ DU patients had greater antral IL-1β and IL-8 production than cagA+ gastritis patients (IL-1β: median = 81.6 versus 56.5 pg/mg protein, p<0.0001; IL-8: median = 120.8 versus 59.3 pg/mg protein, p<0.001; table 2, fig3). In contrast, cagA+ gastritis patients had significantly higher corporal IL-1β and IL-8 production thancagA+ DU patients (IL-1β: median = 79.5 versus 33.6 pg/mg protein, p<0.0001; IL-8: median = 79.2 versus 25.9 pg/mg protein, p<0.0001). None of the cagA+ DU patients had antral mucosal IL-8 levels of zero (below detectable levels), whereas 10% of those with cagA+ gastritis H pylori infection did. In contrast, corporal level of IL-8 was zero in seven of 35 (20%)cagA+ DU cases.
In vivo and in vitro interleukin (IL) 1β and IL-8 production

Mucosal interleukin (IL) 8 production. The end of the bars indicates the 25th and 75th percentiles. The 50th percentile (median) is indicated with a line in the box and the 10th and 90th percentiles are indicated with error bars. *Two cagA+ gastritis cases with extremely low in vitro IL-8 production, which indicate cagA positive, cagE, cagG negative strains. DU, duodenal ulcer.
In cagA− cases, the IL-8 production in biopsy specimens was frequently below the level of detection in both the antrum and the corpus (median = 0 pg/mg biopsy protein; table 2) irrespective of H pylori density. The mucosal level of IL-1β was also significantly lower incagA− gastritis cases than incagA+ gastritis cases, both in the antrum and corpus.
RELATION BETWEEN MUCOSAL IL-8 AND IL-1β PRODUCTION
In cagA+ H pylori infections, the antral and the corporal mucosal levels of IL-8 correlated with the levels of IL-1β (r=0.91 and 0.89 for gastritis and DU, respectively in the antrum; r=0.74 and 0.69 for gastritis and DU, respectively in the corpus; p<0.0001 for each).
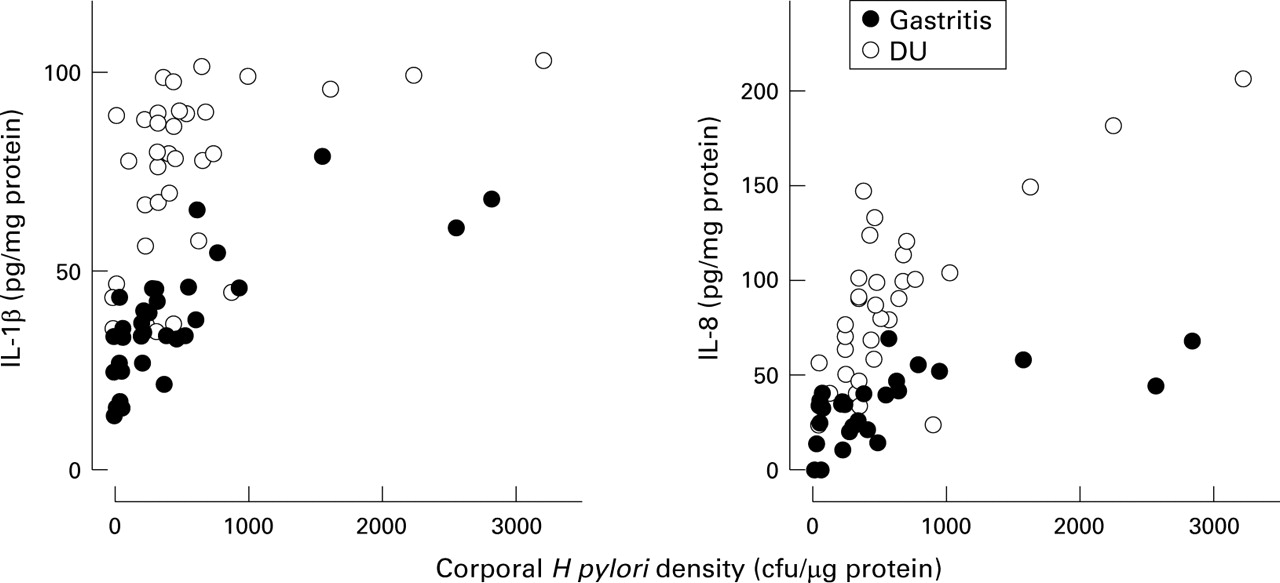
The mucosal levels of IL-1β and IL-8 protein in both the antrum and corpus were significantly related to H pylori density of cagA+ strains (antrum: IL-1β: r=0.72; IL-8:r=0.82; p<0.0001 for each; corpus: IL-1β:r=0.63; IL-8:r=0.72; p<0.0001 for each; figs 4 and 5). In cagA− strains, the antral mucosal level of IL-8 protein was significantly related to H pylori density (r=0.63, p<0.05) and the corporal mucosal level of IL-1β and IL-8 protein was significantly related to H pylori density (IL-1β: r=0.67, p<0.05; IL-8:r=0.85, p<0.01).
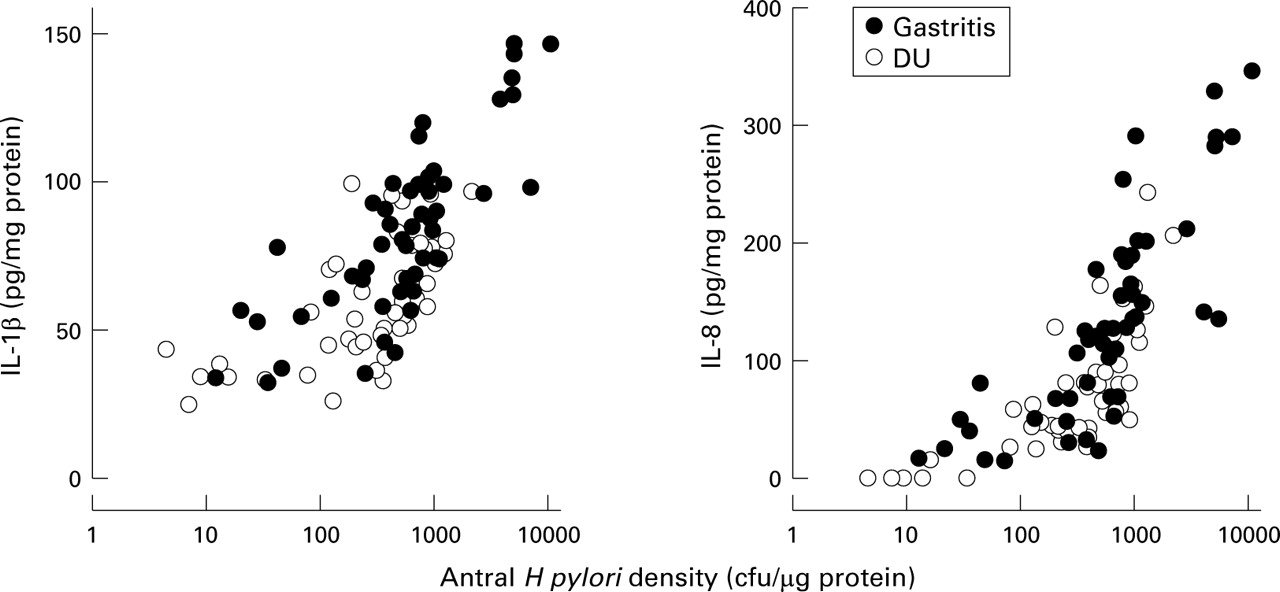
Relation between mucosal interleukin (IL) 1β and IL-8 production and Helicobacter pylori density of cagA+ strains in the antrum.

Relation between mucosal interleukin (IL) 1β and IL-8 production and Helicobacter pylori density of cagA+ strains in the corpus.
RELATION OF MUCOSAL IL-1β AND IL-8 PRODUCTION TO H PYLORIDENSITY
To address the relation between H pylori density and cytokine production, biopsy IL-1β and IL-8 production for the H pylori density was normalised. The mucosal levels of IL-1β and IL-8 were adjusted by subtracting the average level from patients withoutH pylori infection (IL-1β: median = 35.3 and 31.2 pg/mg protein; IL-8: median = 0 and 0 pg/mg protein, in antrum and corpus, respectively). Importantly, the overall interpretation was unchanged whether or not these adjustments were made.
Antral IL-1β and IL-8 production per H pylori was similar in cagA+ infection irrespective of presentation (IL-1β = 3.8 versus 5.6 × 10⁵ pg/cfu, p=0.11; IL-8 = 13.7 versus 18.8 × 10⁵ pg/cfu; p=0.12, for gastritis or DU patients, respectively; table 2, fig 3). On the contrary, the corporal IL-1β and IL-8 production per H pylori was significantly lower in DU patients than in gastritis patients (IL-1β = 1.3 versus 10.4 × 10⁵ pg/cfu, p<0.0001; IL-8 = 7.3 versus 15.1 × 10⁵ pg/cfu, p<0.01, for gastritis or DU patients, respectively). In cagA− gastritis cases, normalised IL-1β and IL-8 levels were also significantly lower than in cagA+ gastritis cases (p<0.0001; table 2).
IN VITRO IL-1β AND IL-8 PRODUCTION FROM GASTRIC CANCER CELL LINE (MKN-45)
IL-8 production from supernatants of medium cocultured withcagA+ H pyloriand MKN-45 cells was approximately equal tocagA+ control strain (60190). In this experiment the number of H pylori was kept constant and the in vitro IL-8 production did not differ between strains from cagA+ DU patients and fromcagA+ gastritis patients, regardless of whether the isolate was from the antrum or corpus (antrum: median production = 3471 pg/ml versus 3278 pg/ml; corpus: 3420 pg/ml versus 3468 pg/ml, for DU and gastritis, respectively; table 2, fig 3).
The two cagA+ gastritis cases which werecagE and cagGnegative by PCR had very low in vitro IL-8 production (JK47A (antrum): 635 pg/ml; JK47B (corpus): 853 pg/ml; JK72A (antrum): 570 pg/ml; JK72B (corpus): 689 pg/ml) and in vivo IL-8 production (JK47: 15.0 (antrum) and 0 (corpus) pg/mg protein; JK72: 0 (antrum) and 23.2 (corpus) pg/mg protein), and cellular infiltration.
The cagA− control strain 93–68 did not induce IL-8 (142 pg/ml) whereas the othercagA− control strain (Tx30) produced small amounts (860 pg/ml). In vitro IL-8 production was extremely low incagA− cases (median production = 724 pg/ml (antrum) and 622 pg/ml (corpus); table 2 and fig 3). In four patients with zero IL-8 production in vivo in either the antrum or corpus, IL-8 production in vitro was similar to that of the medium control withoutH pylori (median production = 123 pg/ml versus 176 pg/ml (control)). The remaining sevencagA− cases induced small amounts of IL-8 in vitro (622–1458 pg/ml).
The level of IL-1β protein from supernatants of medium cocultured with H pylori and MKN-45 cells was below the threshold of sensitivity in all strains.
IL-1β AND IL-8 PRODUCTION AND HISTOLOGICAL FINDINGS
IL-1β and IL-8 production in biopsy specimens was closely related to cellular infiltration both in the antrum and corpus (IL-1β: MNC, r=0.75, PMN,r=0.74, p<0.0001 for each (antrum) and MNC,r=0.45, PMN,r=0.44, p<0.0005 for each (corpus); IL-8: MNC, r=0.81, PMN,r=0.83, p<0.0001 for each (antrum) and MNC,r=0.41, p<0.001, PMN,r=0.49, p<0.0001 (corpus)). IL-1β and IL-8 production in biopsy specimens was weakly related to atrophy only in the corpus (IL-1β: r=0.31, p<0.05, IL-8: r=0.33, p<0.01).
Discussion
This study confirms and extends previous histological observations that duodenal ulcer disease is associated with an antral predominant (or corpus sparing) pattern of gastritis. The average density ofH pylori in the antrum of DU patients was greater than in the antrum of gastritis patients; the converse was also true (H pylori density was lower in the corpus of DU patients than in gastritis patients). We were unable to confirm the hypothesis of Khulusi et alregarding the possibility that a threshold density of antralH pylori is required for development of DU.14 We do not believe that the differences between studies are methodological as we prepared the mucosal homogenates immediately after biopsy with aliquots being plated within 10 minutes. It is also unlikely that our results reflect differences inH pylori density among specimens as we examined IL-1β and IL-8 production in vivo (from biopsy specimens) and in vitro (coculture of H pylori with MKN-45 cells), as well as cytokine production and H pylori density from the same biopsy specimens. To our knowledge this study is the first to investigate the relation between in vitro and in vivo cytokine production or H pyloridensity and cytokine secretion on the same tissue.
We also could not confirm the observation by Athertonet al that the mean antral density ofcagA+ strains was significantly higher than that of cagA− strains.4 The majority of their cagA+ isolates were from DU patients. The predominance of DU patients precluded them from identifying that the increase in H pyloridensity was related to the clinical presentation (DU) rather thancagA status. It is now clear that studies attempting to relate putative virulence factors to outcome must control for both disease and virulence factor (for example,cagA status). Our findings thatH pylori density was independent ofcagA status have also been confirmed by Warburton et al 15 who evaluatedH pylori density by histology.
In the antrum, IL-1β and IL-8 production were closely related to theH pylori density and cellular infiltration. Both IL-1β and IL-8 production were significantly greater in the antrum of DU cases than gastritis cases. Conversely, in the corpus, IL-1β and IL-8 production were significantly lower in DU cases than in gastritis cases. In the corpus both IL-1β and IL-8 production were closely related to the H pylori density but not to cellular infiltration. The finding that corporal IL-8 production could not be directly correlated to cellular infiltration is consistent with previous studies6 ,16 and with numerous histological studies showing high levels of H pylori and low levels of inflammation in DU (antral predominant gastritis).17 The fact that corpus inflammation increases rapidly after vagotomy or high level antisecretory therapy suggests that the host factor, especially acid secretion, is largely responsible for the disconnection between cellular inflammation,H pylori density, and cytokine production in the gastric corpus.18 ,19
The amount of antral mucosal IL-1β and IL-8 produced per viableH pylori did not differ between patients with cagA+ DU or gastritis. Nevertheless, duodenal ulcer patients exhibited a higher range of bothH pylori density and the corresponding cytokine levels (fig 4). In both the antrum and the corpus, the relation between H pylori density and IL-8/IL-1β levels has the appearance of a typical dose-response curve with a threshold, a rapid increase, and a plateau (figs 4 and 5). In the antrum very low levels of in vivo IL-8 production incagA+ infection were related to the presence of very low H pylori density or to the presence of H pylori without a functionalcag pathogenicity island (cagE negative). Recently, Maedaet al also reported the existence of acag pathogenicity island of some Japanese isolates that was partially deleted and had low ability to induce IL-8 in vitro.20 Our findings that in vivo IL-8 levels were also lower in cagA+,cagE negative cases compared with those incagA+, cagE+ cases confirm and extend their observations.
The ability of cagA+ H pylori to induce IL-8 in vitro was similar and independent of whether the strain was obtained from a patient with DU or gastritis, or was obtained from the antrum or the corpus. In those in vitro experiments the quantity of H pylori added was the same and the results are consistent with the notion that the amount of IL-8 per functional cagpathogenicity island in the antrum is similar in both DU and gastritis. In the corpus, the plateau levels of IL-1β and IL-8 were greater for gastritis patients compared with DU patients and, as a result, in vivo cytokine production per H pylori density was also higher in gastritis than in DU. As noted above, because in vitro IL-8 production did not differ between strains from cagA+ DU patients and fromcagA+ gastritis patients, we speculate that the higher acid secretion in DU patients may have been responsible for the different response of cytokine production between DU and gastritis seen in vivo. This hypothesis is currently being tested.
Recent studies have shown that acid secretion is reversibly inhibited in the presence of corpus inflammation and a number of different factors may be responsible for the inhibition of acid secretion, including inflammation related loss of M3 muscarine receptors, and increased concentration of growth factors, such as hepatocyte growth factor, transforming growth factor β1, and gastric juice epithelial growth factor.18 ,21 ,22 In addition, IL-1β is considered to be a possible mediator of this inhibition.23-25 It is important to note that the method of cytokine measurement used in this study included all forms of mucosal cytokine protein; not all of these may be functional. It is also not known whether there are differences in the number of IL-1β and IL-8 receptors between the antrum and corpus, which could also explain why there might be regional differences in the response to cytokines. While both IL-8 and IL-1β levels were related toH pylori density, there was no corresponding increase in inflammation in the corpus. Thus, histological evaluation of corpus inflammation may underestimate the degree of inhibition of parietal secretion present in an individual case.
Infection with cagA− strains generally resulted in low to absent vivo IL-1β and IL-8 production, regardless of the density of H pylori. Those with low IL-8 production in vivo also had low to absent IL-8 production in vitro and mild cellular infiltration. Of interest, somecagA− strains produced no IL-8 in vitro or in vivo. Other cagA− strains produced IL-8 in vitro at a level between one third and one half of thecagA+ in controls and produced IL-8 in vivo in relation to H pylori density. For example, one cagA− case had an in vivo IL-8 production of 101 pg/mg protein, which was higher than median IL-8 values of cagA+ cases, along with a high density of H pylori and severe cellular infiltration. It appears that a virulence factor(s) other than thecag pathogenicity island may also be involved in IL-8 production.26 ,27 Recently, we found that the 34 K outer membrane protein, HP638 (omp13) plays an important role in IL-8 production from gastric cancer cell lines, AGS cells.28 Further studies will be necessary to investigate the relation between IL-8 production and virulence factors.
Abbreviations used in this paper
- DU
- duodenal ulcer
- IL
- interleukin
- MNC
- mononuclear cell
- PCR
- polymerase chain reaction
- PMN
- polymorphonuclear cell
References
Supplementary materials
- Correction
An error occurred in the keys to figures 4 and 5 of the paper by Yamaoka et al (Gut 1999;45:804-11). Gastritis should be represented by open circles and duodenal ulcer by closed circles. We apologise for any confusion this error may have caused.
Linked Articles
- Correction