Article Text

Abstract
BACKGROUND Linear growth retardation is a frequent complication of inflammatory bowel disease in children. The precise mechanisms causing growth failure are not known.
AIMS To determine the relative contribution of reduced calorie intake and inflammation to linear growth delay and to determine the effect of inflammation on the hypothalamic-pituitary-growth axis.
METHODS Linear growth was assessed in prepubertal rats with trinitrobenzenesulphonic acid (TNBS) induced colitis, in healthy free feeding controls, and in a pair-fed group (i.e. healthy animals whose daily food intake was matched to the colitic group thereby distinguishing between the effects of undernutrition and inflammation).
RESULTS Changes in length over five days in the TNBS colitis and pair-fed groups were 30% and 56%, respectively, of healthy free feeding controls. Linear growth was significantly reduced in the colitic group compared with the pair-fed group. Nutritional supplementation in the colitic group increased weight gain to control values but did not completely reverse the growth deficit. Plasma interleukin 6 (IL-6) concentrations were sixfold higher in the colitic group compared with controls. Plasma concentrations of insulin-like growth factor 1 (IGF-1) but not growth hormone (GH) were significantly lower in the colitic compared with the pair-fed group. Administration of IGF-1 to the colitic group increased plasma IGF-1 concentrations and linear growth by approximately 44–60%.
CONCLUSIONS It seems likely that approximately 30–40% of linear growth impairment in experimental colitis occurs as a direct result of the inflammatory process which is independent of undernutrition. Inflammation acts principally at the hepatocyte/IGF-1 level to impair linear growth. Optimal growth in intestinal inflammation may only be achieved by a combination of nutritional intervention and anticytokine treatment.
- inflammatory bowel disease
- TNBS colitis
- growth retardation
- insulin-like growth factor 1
- interleukin 6
Statistics from Altmetric.com
Growth retardation is a frequent extraintestinal manifestation of inflammatory bowel disease (IBD) in children and adolescents. Impaired linear growth is a presenting symptom in 19–31% of children with Crohn's disease and ulcerative colitis.1-3 During the subsequent clinical course, 20–40% of children and adolescents develop severe growth retardation, as defined by either height less than the third percentile for age, height two standard deviations below the average height for a given age, or bone age 2 years less than chronological age.2 4 5 Moreover, early growth delay has been associated with permanent stunting in 17% of patients.6
Reduced calorie intake, steroid use, and a direct effect of inflammation have been proposed as potential aetiological factors. Clinical studies have clearly shown that malnutrition contributes to growth retardation. In children with Crohn's disease and growth failure, calorie intake has been documented to be only 43–82% of recommended values and nutritional supplementation results in increased growth velocity.7-9 However, some children fail to achieve their growth potential despite nutritional intervention suggesting that factors other than reduced calorie intake play an important aetiological role.9 10 Recent studies suggest that this may be due to a direct adverse effect of circulating inflammatory cytokines11 12 on the hypothalamic-pituitary-growth axis.13-15 Transgenic mice which overexpress interleukin 6 (IL-6) have growth impairment and reduced plasma concentrations of insulin-like growth factor 1 (IGF-1).13 The latter, which is principally derived from the liver, plays a pivotal role in postnatal growth as demonstrated by the observation that mice and humans deficient in IGF-1 show markedly decreased postnatal growth.16 17 Animals with experimental colitis have increased plasma concentrations of IL-6 and abnormalities of the growth plate compared with control animals with the same degree of nutritional deprivation.14 These studies suggest that inflammation may potentially have an adverse influence on linear growth.
The purpose of our study was twofold: firstly, to determine the relative contribution of malnutrition and inflammation to linear growth delay; and secondly, to determine the mechanism by which inflammatory mediators inhibit the hypothalamic-pituitary-growth axis. The second aim of our study was to determine if inflammatory mediators act at single or multiple sites of the axis (i.e. hypothalamic, pituitary, hepatic, and growth plate effects) and thus determine potential sites for therapeutic intervention. In these studies, we used an experimental model of colitis and a group of healthy animals whose food intake matched that of the colitic group thus controlling for the effects of malnutrition in the colitic group. Experimental colitis was induced by rectal administration of the hapten reagent 2,4,6-trinitrobenzenesulphonic acid (TNBS) which causes transmural and chronic granulomatous inflammation with clinical, histopathological, and immunological features consistent with those found in Crohn's disease. Our results showed that inflammation was a major mediator of linear growth retardation, principally caused by reduced IGF-1 secretion. Reduced production of growth hormone (GH) and inhibition of end organ responsiveness to IGF-1 played minor roles. Effective treatment of growth retardation requires both nutritional supplementation and IGF-1 treatment or anticytokine approaches to remove inhibition of IGF-1 secretion.
Methods
All experiments were approved by the Animal Scientific Procedures Act 1986.
ANIMALS AND TREATMENTS
Prepubertal (26 days) Wistar rats bought from Charles River Ltd, UK, were divided into three groups (n=10/group) matched for sex, weight, and body length. Animals were housed individually at an ambient temperature of 22±1°C, maintained under a 12:12 hour light-dark cycle, and given standard laboratory chow (RMI cubed) and tap water. All rats were anaesthetised by intramuscular injection of 0.1 ml of Hypnorm (fentanyl citrate 0.315 mg/ml and fluanisone 10 mg/ml) and in the colitic group a plastic catheter was inserted 5 cm proximal to the anus. Colitis was induced by administration via the catheter of 8 mg of 2,4,6-trinitrobenzenesulphonic acid (TNBS, Sigma Chemical Co. UK) in 40% ethanol at a final volume of 0.15 ml.18 Two controls groups were used: (1) healthy free feeding controls allowed free access to food and (2) a pair-fed group comprising healthy animals whose daily food intake was matched to that of their pair in the colitic group. To allow precise matching of food intake, the pair-fed group was started one day after the colitic group. Body weight and 24 hour food and water intake were measured daily in all animals. Body length, assessed by the mean of two measurements of nose-to-tail base distance,19was measured in anaesthetised animals at induction of colitis (age 26 days) and five days later (age 31 days), immediately before sacrifice. Intraobserver precision for measurement of linear length was 3.3%. By necessity, linear length was measured at age 27 and 32 days (i.e. at the onset and after five days of pair feeding) in the pair-fed group. The age difference of one day between the pair-fed and colitic groups did not in itself effect growth velocity or plasma concentrations of IGF-1 (unpublished observations). Animals were killed by decapitation between 0900 and 1100. Trunk blood was collected into EDTA tubes which were placed on ice until centrifugation (2000g, 4°C, for 10 minutes). Plasma was stored at −20°C until hormone measurement. Via a midline laparotomy the colon was removed and macroscopic inflammation assessed by measuring the number and size of ulcers. The total area of ulceration was calculated from these measurements. A section of the colon 2 cm proximal to the anus was removed and stored at −20°C until assayed for myeloperoxidase (MPO) concentrations.
MEASUREMENT OF PLASMA HORMONE AND IL-6 CONCENTRATIONS
Plasma concentrations of rat IGF-1 (rIGF-1) were measured by radioimmunoassay (Diagnostic Systems Laboratories (DSL) Inc, Texas, USA) with a minimum detection limit of 21 ng/ml, intra-assay precision of 3.8–5.9%, and no cross reactivity with human IGF-1 (hIGF-1). Plasma concentrations of hIGF-1 were measured after hIGF-1 treatment by ELISA (IDS Ltd, Tyne and Wear, UK) with a minimum detection limit of 1.9 ng/ml, intra-assay precision of 2.3–3.5%, and no cross reactivity with rIGF-1. IGF binding protein 3 (IGFBP-3), which binds more than 95% of IGF-1 in serum, was measured by ELISA (DSL Inc). Plasma concentrations of GH were measured by radioimmunoassay (Amersham International plc, Bucks, UK). IL-6 concentrations were measured by ELISA using immunoaffinity purified polyclonal antibodies from a sheep antirat IL-6 serum (National Institute for Biological Standards and Control, Hertfordshire, UK).20 For each hormone, all samples were measured in duplicate in a single assay.
MEASUREMENT OF TISSUE MYELOPEROXIDASE CONCENTRATIONS
Tissue concentrations of MPO were measured to assess the degree of intestinal inflammation using a minor modification21 of the technique described by Smith and Castro.22
EFFECT OF NUTRITIONAL SUPPLEMENTATION ON LINEAR GROWTH IN TNBS COLITIS
Prepubertal Wistar rats were divided into four weight and sex matched groups: (1) healthy free feeding controls (n=7), (2) colitic group with free access to food who did not receive nutritional supplements (n=6, unfed colitics), (3) colitic group with free access to food who also received supplementary orogastric tube feeding (1–3 times daily depending on energy requirements) to restore calorie intake to equal that of the free feeding healthy controls (n=6, fed colitics), and (4) pair-fed group whose food intake was matched exactly to that of their pair in the unfed colitic group. In all groups, to allow administration of tube feeds in the colitic group, liquid food was used as the only form of nutrition and provided as Ensure Plus (12.5 g protein, 10.0 g fat, 40.0 g carbohydrate, 1260 Kj/250 ml, Abbott Laboratories Ltd, Berks, UK). In the control and unfed colitic groups, the orogastric tube was also passed 1–3 times daily to control for this intervention in the fed colitic group.
EFFECT OF IGF-1 TREATMENT ON LINEAR GROWTH IN TNBS COLITIS
Prepubertal rats (n=50, 27 male) were divided into five weight and sex matched groups: (1) healthy controls, (2) IGF-1 treated colitics, (3) untreated colitics, (4) IGF-1 treated pair-fed, and (5) untreated pair-fed. Colitis was induced as described previously. Food intake and body weight were measured daily and body length was assessed before and five days after induction of colitis. Human IGF-1 (Chiron Technologies, California, USA) was administered at a dose (300 μg/kg/day subcutaneously in saline, in two divided doses) previously shown to be well tolerated and to increase linear growth.23 Saline vehicle was administered to the untreated colitic and pair-fed groups. Animals were sacrificed approximately three hours after the last dose of IGF-1 and trunk blood was collected for measurement of rIGF-1 and hIGF-1 concentrations. Macroscopic inflammation was assessed and a segment of colon was removed for measurement of MPO concentrations.
STATISTICAL ANALYSIS
Results are presented as mean (SD) or median (interquartile range) for data not normally distributed. Linear growth is presented as change in body length during the five day experimental period. Differences in food intake and body weight were compared between experimental groups by two way analysis of variance (ANOVA). Multiple comparisons were conducted with the Studentised range statistic and evaluated according to the Newman-Keuls procedure. Tissue concentrations of MPO, plasma hormone concentrations, and change in length were compared using one way ANOVA coupled to a Bonferroni for comparison of means. The Kruskal-Wallis test was used for data not normally distributed. A p value <0.05 was considered significant.
Results
EFFECT OF TNBS COLITIS ON LINEAR GROWTH AND PLASMA HORMONE CONCENTRATIONS
Assessment of inflammation
Administration of TNBS/ethanol produced distal colitis extending from the splenic flexure to the anus. There was bowel wall thickening, oedema, and skip lesions, with areas of ulceration up to 0.7 cm in size. MPO concentrations in the colon of the colitic group were 3–6-fold higher (p<0.01) than those in healthy free feeding controls or in the pair-fed group (table 1). The systemic inflammatory response was evident from plasma concentrations of IL-6 (table 1) which were significantly higher in the colitic group compared with healthy free feeding controls (p<0.002) and the pair-fed group (p<0.004).
Intestinal myeloperoxidase (MPO) activity and plasma hormone concentrations. Values are mean (SD) or median (interquartile range) for data not normally distributed
Food intake and body weight
Free feeding controls, colitic, and pair-fed groups had similar 24 hour food intake and body weight before induction of colitis (fig 1). As expected, rats with TNBS colitis ate significantly less than free feeding controls over the five days after induction of colitis (F=325, p<0.0001). Multiple comparisons indicated that TNBS treated rats ate less than controls on day 1 (Q8=16.1, p=0.0001), day 2 (Q7=12.4, p=0.0001), day 3 (Q8=13.4, p=0.0001), day 4 (Q8=13.1, p=0.0001), and day 5 (Q8=12.5, p=0.0001). By definition, food intake in the pair-fed group was the same as that in the colitic group.
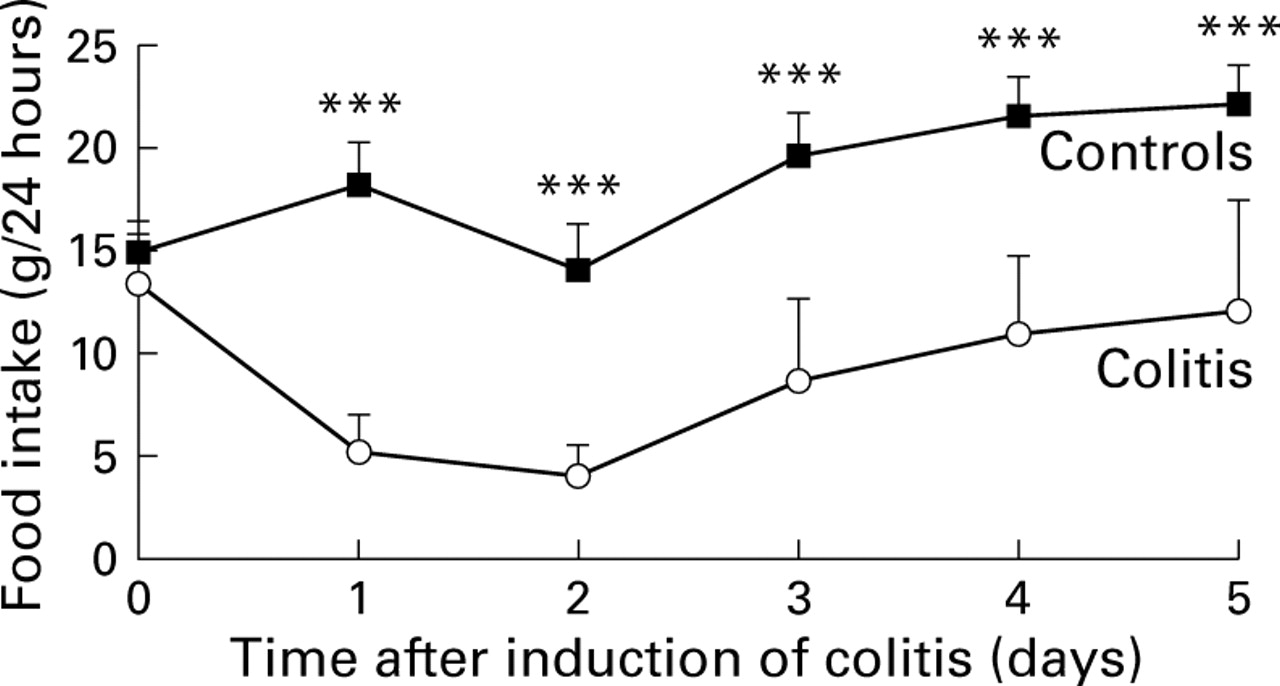
Daily food intake in healthy free feeding controls and in TNBS colitis; n =10/group. Values are mean (SD). Colitis was induced on day 0 (age 26 days). ***p=0.0001 v colitis. By definition, food intake in the pair-fed group (data not shown) was the same as that in the colitic group.
Two way ANOVA indicated a significant difference in body weight between the experimental groups (F=7.99, p<0.0001). Multiple comparisons indicated that body weight in the TNBS colitis group was significantly less than that in free feeding controls on all days after induction of colitis. At the end of the five day experimental period, body weight in the TNBS colitis group (83.2 (15) g) was 73% that of healthy free feeding controls (113.7 (12.1) g, Q6=14.5; p<0.0001). Weight gain in the colitis group was only 6.8 (1.3) g compared with 37.5 (4.2) g in healthy free feeding controls. There was no significant difference (Q3=3.2, p=0.09) in weight gain over the five day experimental period between the colitic and pair-fed groups (7.2 (1.9) g).
Linear growth
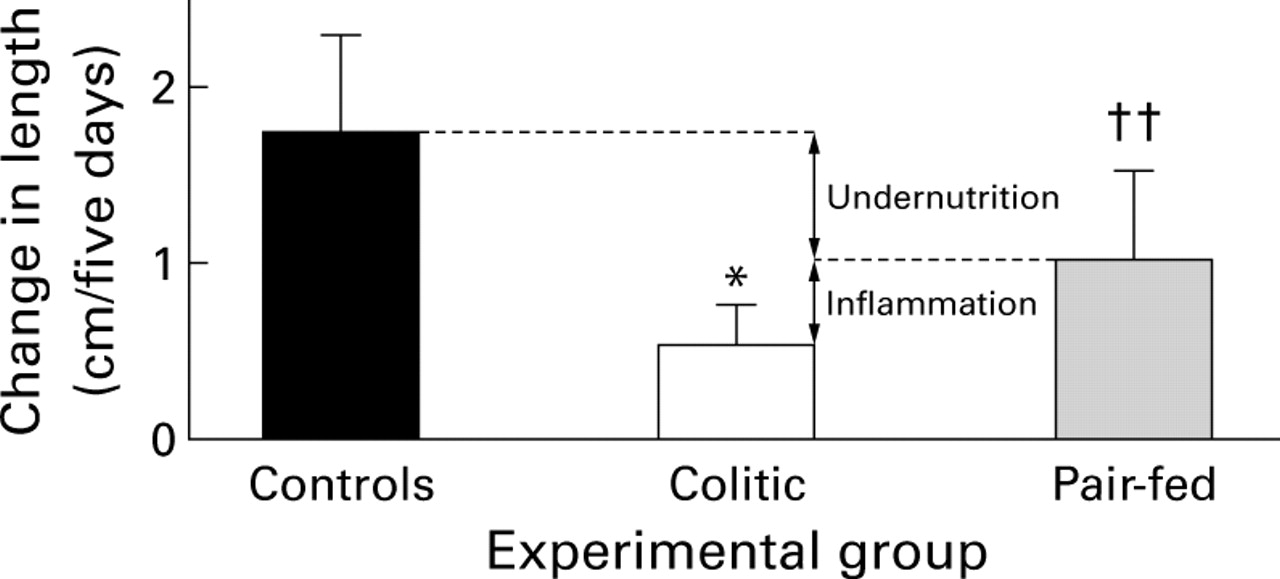
The change in length over five days in animals in the TNBS colitis and pair-fed groups was about 30% and 56% (p<0.002), respectively, of healthy free feeding controls (fig 2). Linear growth was significantly less (p<0.02) in animals with colitis compared with the pair-fed group. Compared with the pair-fed group (i.e. with the same degree of undernutrition as the colitic group) approximately 60% of the growth impairment in the colitic group could be attributed to reduced food intake, with inflammation itself accounting for the remaining deficit (fig 2).

Changes in body length during the five day study period in the healthy free feeding controls, TNBS colitis and pair-fed groups; n=10/group. Values are mean (SD). *p<0.02 v pair-fed; ††p<0.002 v healthy free feeding controls. The arrows indicate the relative contribution of undernutrition and inflammation to growth retardation in the colitic group.
Plasma hormone concentrations
Plasma hormone data are shown in table 1. Plasma rIGF-1 concentrations reflected the linear length data; concentrations in the pair-fed group were approximately 65% (p<0.003) of those measured in free feeding controls with a further reduction in the colitic group (p<0.007 v pair-fed). There was a small but significant reduction in IGFBP-3 concentrations in both pair-fed (p=0.01) and colitic groups (p=0.03) compared with controls but concentrations in the colitic and pair-fed groups were similar. Plasma concentrations of GH were increased fourfold (p=0.001) in the pair-fed group compared with healthy controls (table 1). GH concentrations were lower in the colitic group compared with the pair-fed group but this just failed to reach statistical significance (p=0.07).
In healthy free feeding controls and in the pair-fed group there was a positive correlation between plasma concentrations of GH and rIGF-1 (fig 3). However, in the colitic group there was complete GH resistance, as evidenced by the observation that plasma concentrations of rIGF-1 did not increase with increasing GH concentrations.

Relationship between plasma concentrations of growth hormone (GH) and rat insulin-like growth factor 1 (rIGF-1) in the healthy free feeding controls (r=0.49, p=0.15), TNBS colitis (r=−0.49, p=0.15), and pair-fed groups (r=0.71, p=0.02).
EFFECT OF NUTRITIONAL SUPPLEMENTATION ON LINEAR GROWTH IN TNBS COLITIS
Nutritional supplementation in the colitic group restored weight gain to control values. Two way ANOVA indicated a significant difference in weight gain between the groups during the five day experimental period (F=20.00, p<0.0001). Weight gain in the fed colitic group (25.6 (6.2) g/5 days) was similar (Q2 1.74, p=0.24) to that of healthy free feeding controls (19.4 (8.5) g) but significantly greater (p=0.0004) than in the pair-fed or colitic group without nutritional supplementation, both of which gained only a mean of 1 g in weight.
Nutritional supplementation had a notable beneficial effect on linear growth with a threefold increase (p=0.007) in length in the fed colitic compared with the unfed colitic group (fig 4). However, nutritional supplementation in the colitic group did not restore growth to control values and animals remained shorter (p=0.04) than controls. Figure 4shows that nutritional supplementation reversed about 60% of the growth deficit in the colitic group thus confirming our initial observations that inflammation contributes directly to impaired growth, independent of malnutrition. Nutritional supplementation increased plasma concentrations of rIGF-1 from 302 (110) ng/ml in the unfed colitic group to 499 (142) ng/ml in the fed colitic group (p=0.03).
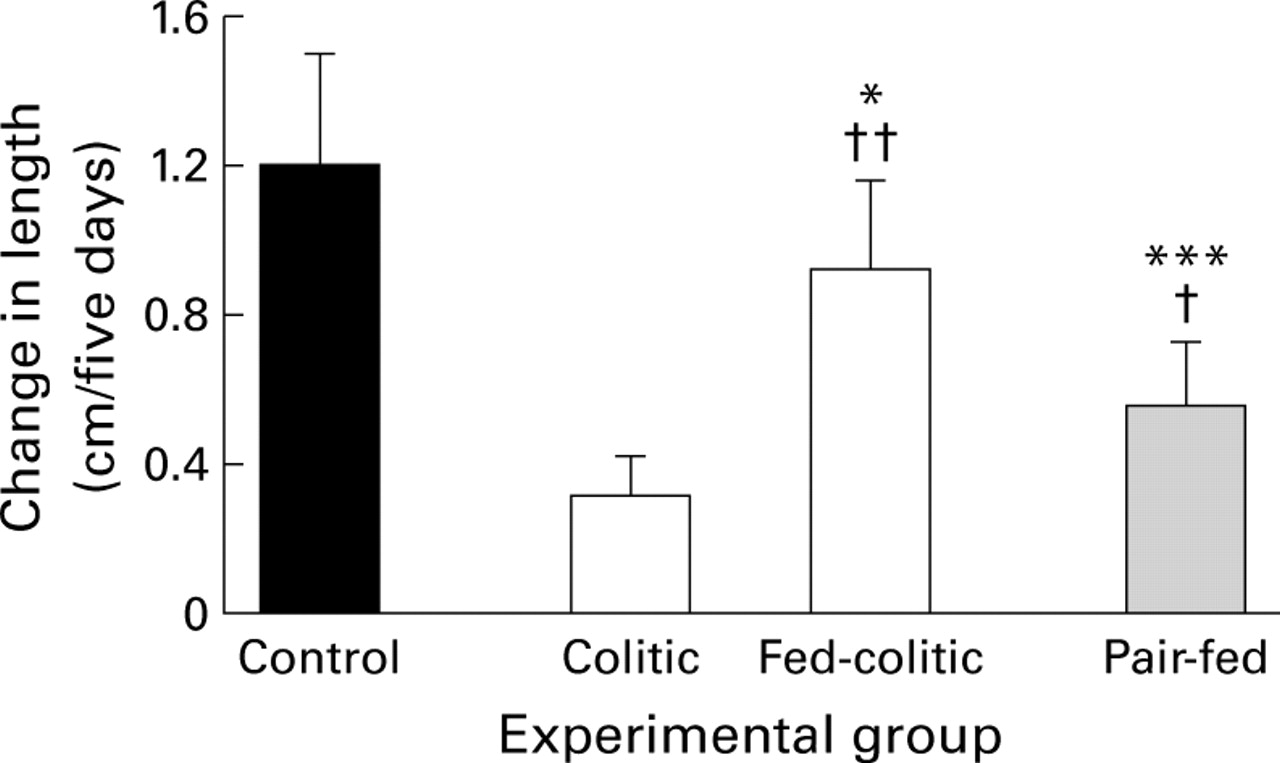
Effect of nutritional supplementation on linear growth in TNBS colitis. n=6–7/group. *p=0.04, ***p=0.0002 v healthy free-feeding controls; †p=0.05, ††p=0.007 v colitis without nutritional supplementation.
Nutritional supplementation did not alter the severity of intestinal inflammation as assessed by macroscopic scores and MPO activity. The number of ulcers in the fed colitic group was 1.5 (1.0–2) compared with 1 (1–1) in the unfed colitic group. The total surface area of ulceration was 190 (132.5–248.25) mm2 in the fed colitic group and 170 (130–235.3) in the unfed colitic group (p=0.7). MPO levels in the fed colitic group (56 (16) mU/g tissue) were similar (p=0.2) to those in the unfed colitic group (62 (15) mU/g tissue) and significantly (p<0.0001) greater than those in the control and pair-fed groups. Furthermore, plasma concentrations of IL-6 were similar in the unfed (257 (124–312) pg/ml) and fed colitic (312 (145–320) pg/ml) groups.
EFFECT OF IGF-1 ADMINISTRATION ON LINEAR GROWTH IN TNBS COLITIS
Human IGF-1 treatment significantly increased linear growth in the colitic group and this was not an indirect result of a reduction in the severity of intestinal inflammation or improvement in nutritional status in the treated group.
One way ANOVA for change in length revealed a significant group difference (F=7.99, p<0.0001). The increase in linear growth was significantly greater (p=0.05) in the hIGF-1 treated colitic group compared with untreated colitics (fig 5). However, growth was still significantly less in both untreated (p<0.001) and treated colitics (p<0.002) compared with healthy free feeding controls. Linear growth was similar (p=0.4) in the hIGF-1 treated pair-fed and untreated pair-fed groups.

Effect of insulin-like growth factor 1 (IGF-1) treatment on linear growth in TNBS colitis; n=10/group. *p=0.05, **p=0.009 v placebo/colitic; ††p=0.006 v controls.
Administration of hIGF-1 to colitic and pair-fed groups resulted in plasma hIGF-1 concentrations of 133 (44) and 153 (35) ng/ml, respectively, in the treated groups. Total plasma IGF concentrations in the treated groups were calculated from the sum of hIGF-1 and rIGF-1 concentrations measured in the respective assays. Total IGF-1 concentrations in the IGF-1 treated colitic and pair-fed groups were 438 (84) and 542 (235) ng/ml, respectively. Human IGF-1 treatment was well tolerated and appeared to have no side effects in the treated group; in particular it did not induce hypoglycaemia.
Testing by Kruskal-Wallis revealed a significant difference (T=20.7, p<0.0001) in weight gain between the experimental groups. Weight gain in the healthy controls (35 (32.5–39) g/five days) was significantly (p<0.0001) more than that in the IGF-1 treated (8 (4–15.8) g) or untreated (2.5 (−15 to 22.25) g) colitic groups. Weight gain in the IGF-1 treated and untreated colitic groups was similar (p=0.49). MPO concentrations were similar (p=0.43) in the treated (40.8 (16.9) mU/g tissue) and untreated (41 (16) mU/g tissue) colitic groups, and were significantly (p=0.002) greater than control values (13 (3) mU/g tissue).
Discussion
The aim of our study was to examine the relative contribution of reduced food intake and inflammation to growth impairment in the TNBS model of colitis. In the first part of the study we showed that linear growth was greatly reduced in animals with TNBS colitis to approximately 30% of healthy free feeding controls. Compared with the results in the pair-fed group it seems likely that about 30–40% of growth impairment in the colitic group occurred as a direct result of the inflammatory process and was independent of undernutrition. Reduced weight gain in the colitic group compared with free feeding controls could potentially be a result of reduced food intake, malabsorption and increased energy losses from the gut, increase in total energy expenditure, or a combination of these factors. In our study, food intake in the colitic and pair-fed groups was the same; in the colitic group reduced feeding was caused by anorexia and in the pair-fed group by restricted feeding. Reduced weight gain was similar in the pair-fed and colitic groups suggesting that, similar to human IBD,24 25 reduced food intake is the major cause of weight loss (or reduced weight gain) associated with TNBS colitis. Malabsorption of nutrients and hence energy or increased energy expenditure would be expected to produce greater weight loss in the colitic group compared with the pair-fed group. Furthermore, malabsorption of energy substrates in not a feature of colitis26 and thus we believe that this did not contribute to the reduced weight gain in TNBS colitis. We would therefore conclude that increased energy requirements do not contribute to undernutrition and growth impairment in colitis. In this study we did not measure body composition and therefore we do not know if there was a difference in fat mass or lean body mass between the colitic and pair-fed groups.
The adverse effect of inflammation on linear growth was confirmed when rats with TNBS colitis received nutritional supplements. If linear growth retardation was mediated entirely by undernutrition we would have expected complete reversal of the growth deficit in the fed colitic group. However, although nutritional supplementation in the colitic group restored calorie intake and body weight to control values, the growth deficit was not completely reversed and these rats remained significantly shorter than controls. Furthermore, similar weight gain in fed colitic and control groups supports our previous conclusions that increased energy requirements do not contribute to malnutrition in experimental colitis.
A previous study examined the growth plate of rats with TNBS colitis and showed that the diameter of the resting zone was increased and the diameter of the proliferative zone was decreased compared with pair-fed animals.14 The results of our study are therefore in agreement with this study which showed a clear detrimental effect of inflammation itself on growth plate morphology. However, growth plate height, when used as the sole parameter to quantitate effects on skeletal growth, may be misleading as it does not necessarily change in proportion to growth rate.27 Thus in the study of Koniariset al it was not possible to determine the relative contribution of inflammation and undernutrition to the final change in body length and the mechanism of the growth plate changes was not explored. In mice, increased plasma concentrations of IL-6, induced by exogenous administration or generation of transgenics, results in decreased plasma concentrations of IGF-1,13suggesting a direct effect of this proinflammatory cytokine on the hypothalamic-pituitary-growth axis. However, plasma IL-6 concentrations which are generated by these methods are usually much higher than in animals and humans with inflammatory conditions and thus the results of the study cannot necessarily be extrapolated to disease models.13
IGF-1 is produced by many tissues including growth plate chondrocytes in response to GH stimulation. However, we believe that the effects of undernutrition and inflammation on linear growth are mediated by a reduction in circulating levels of IGF-1, secondary to reduced hepatic production. The liver, which exhibits a several order of magnitude higher level of postnatal IGF-1 gene expression than any other tissue, is the major source for circulating IGF-1.28-30 Thus although we did not measure tissue expression of IGF-1 it seems likely that the reduction in circulating IGF-1 in the colitic and pair-fed groups was mainly due to a reduction in hepatic production. In addition, the local paracrine IGF-1 system in the growth plate does not appear to contribute to growth inhibition but instead is upregulated by fasting.31
Our results suggest that inflammation acts principally at the hepatocyte/IGF-1 level to impair linear growth. In food restricted healthy animals (i.e. pair-fed) we found that plasma concentrations of GH were increased compared with healthy free feeding controls; this is in agreement with the known effects of starvation on anabolic hormones.32 33 GH concentrations were lower in the colitic group compared with the pair-fed group although this failed to reach statistical significance. In growth retarded children and adolescents with IBD, GH secretion is also reported to be normal34 or low.35 IGF-1, produced by the liver in response to GH stimulation, mediates GH effects on the growth plate of bones. In our study, IGF-1 concentrations in the colitic group were reduced to 35% of control values. Compared with the results obtained in pair-fed animals it can be deduced that malnutrition, which is known to cause GH resistance,36 accounts for about 53% of this reduction in IGF-1 concentrations. Inflammation, which also induces GH resistance,15 accounts for the remaining 47%. These results therefore parallel the linear growth data in terms of the relative contribution of malnutrition and inflammation to growth impairment. Plasma concentrations of IGFBP-3, the major serum binding factor for IGF-1,37 were similar in the pair-fed and colitic groups suggesting that the reduction in IGF-1 concentrations in the colitic group was not due to reduced concentrations of binding protein. However, the affinity of the binding protein may be altered in the presence of inflammation and this was not assessed in this study. The impact of inflammation on the GH/IGF-1 axis was clearly seen when plasma GH concentrations were plotted against rIGF-1 concentrations. In the healthy free feeding controls and the pair-fed group a positive correlation was found although this did not reach statistical significance in the free feeding controls. However, in the colitic group there was a negative correlation between plasma GH and IGF-1 concentrations, suggesting that inflammation induces profound resistance of the hepatocyte to GH stimulation.
Administration of hIGF-1 increased plasma IGF-1 concentrations by approximately 44% compared with untreated colitics and produced a parallel increase in linear growth. These results suggest that inflammatory mediators do not induce end organ resistance (i.e. at the growth plate) to IGF-1. A higher dose of IGF-1 may have resulted in a greater increase in linear length but may also have caused hypoglycaemia. IGF-1 treatment had no significant effect on linear growth in pair-fed animals. Results in the pair-fed group suggest that although food restriction leads to reduced plasma IGF-1 concentrations, deficiency of circulating IGF-1 is not the main mediator of growth retardation. The mechanism of growth retardation induced by food restriction may be due to relative IGF-1 resistance (a higher dose may have had more effect) or factors other than IGF-1.
In children with IBD and in the absence of a pair-fed group, it is impossible to accurately determine the effect of inflammation on linear bone growth. However, published work suggests that the TNBS colitis model, even in the early stages of evolution, is similar to human Crohn's disease, particularly with respect to T cell activation and cytokine profile.38-40 Thus it seems likely that the systemic inflammatory response, which induces growth failure, is similar in human IBD and the TNBS colitis model.
We conclude from these studies that inflammation itself is responsible for approximately 30–40% of the growth deficit in experimental colitis. Furthermore, in agreement with data from IL-6 transgenic mice,13 our results suggest that linear growth retardation induced by inflammation is principally through a reduction in IGF-1 production by the liver. We found increased plasma concentrations of IL-6 in rats with TNBS colitis but other cytokines such as tumour necrosis factor α (TNF-α) may also contribute to suppression of growth.41 42 Excess production of TNF-α in TNF transgenic mice causes growth failure and wasting, which can be prevented by anti-TNF monoclonal antibody. In rheumatoid arthritis TNF-α has been shown to have a pronounced inhibitory effect on chondrocyte kinetics but it is not known if this also applies to growth plate chondrocytes.43 We did not measure TNF-α or its soluble receptor in the present study and it is not known if TNF plays a role in suppression of linear growth associated with intestinal inflammation. The precise cytokines which mediate growth suppression in inflammation will only be determined from further studies of cytokine inhibition with specific antagonists or antibodies.
At the present time, nutritional supplementation is the mainstay of therapy for growth failure in human IBD. Our study clearly shows that in a rat model of colitis, inflammation itself has a detrimental effect on linear growth and this is due in part to a reduction in plasma concentrations of IGF-1. In the absence of human studies our results cannot necessarily be extrapolated to human IBD but they suggest that optimal growth in all patients may be achieved only by a combination of nutritional support and anticytokine treatment or IGF-1 treatment.
Acknowledgments
AB is supported by the Wellcome Trust. Human IGF-1 was a gift from Chiron Technologies, California, USA. The generation of the rat IL-6 ELISA reagents was funded by the European Community Concerted Action Program Biomed 1: “Cytokines in the Brain” (PL931450).
References
Footnotes
- Abbreviations used in this paper:
- IGF-1
- insulin-like growth factor 1
- IGFBP-3
- insulin-like growth factor binding protein 3
- IL-6
- interleukin 6
- GH
- growth hormone
- MPO
- myeloperoxidase
- TNBS
- trinitrobenzenesulphonic acid
- TNF-α
- tumour necrosis factor α
- IBD
- inflammatory bowel disease