Article Text

Abstract
Background—In vivo hepatic phosphorus-31 magnetic resonance spectroscopy (MRS) provides non-invasive information about phospholipid metabolism.
Aims—To delineate MRS abnormalities in patients with chronic ductopenic rejection (CDR) and to characterise spectral changes by in vitro MRS and electron microscopy.
Patients and methods—Sixteen liver transplant recipients (four with CDR; 12 with good graft function) and 29 controls (23 healthy volunteers; six patients with biliary duct strictures) were studied with in vivo 31P MRS. Peak area ratios of phosphomonoesters (PME) and phosphodiesters (PDE), relative to nucleotide triphosphates (NTP) were measured. In vitro MRS and electron microscopy were performed on biopsy specimens from five patients with CDR, freeze clamped at retransplantation. Phosphoethanolamine (PE), phosphocholine (PC), glycerophosphorylethanolamine (GPE), and glycerophosphorylcholine (GPC) concentrations were measured.
Results—The 12 patients with good graft function displayed no spectral abnormalities in vivo; the four patients with CDR showed significantly elevated PME:NTP (p<0.01) and PDE:NTP ratios (p<0.005). Patients with biliary strictures had significant differences in PME:NTP (p<0.01) from patients with CDR, but not in mean PDE:NTP. In vitro spectra from CDR patients showed elevated PE and PC, mirroring the in vivo changes in PME, but reduced GPE and GPC concentrations were observed, at variance with the in vivo PDE findings. On electron microscopy, there was no proliferation in hepatocyte endoplasmic reticulum.
Conclusions—The increase in PME:NTP reflects altered phospholipid metabolism in patients with CDR, while the increase in PDE:NTP may represent a significant contribution from bile phospholipid.
- in vivo 31P magnetic resonance spectroscopy
- in vitro 31P magnetic resonance spectroscopy
- liver transplantation
- chronic ductopenic rejection
- electron microscopy
- phospholipids
Statistics from Altmetric.com
- in vivo 31P magnetic resonance spectroscopy
- in vitro 31P magnetic resonance spectroscopy
- liver transplantation
- chronic ductopenic rejection
- electron microscopy
- phospholipids
Orthotopic hepatic transplantation has become the treatment of choice for end stage liver failure, but between 2% and 17% of patients subsequently develop chronic graft rejection, occurring most often between six weeks and six months postoperatively.1The syndrome is characterised by biliary stasis from the loss of small bile ducts and has been termed ductopenic rejection or the vanishing bile duct syndrome.2 In the majority of cases this results in irreversible liver damage, often requiring retransplantation.3 However, there is some evidence to suggest that altering immunosuppressive regimens, especially to tacrolimus, may alter the course of chronic ductopenic rejection if the disorder is diagnosed at an early stage.4 ,5 This emphasises the need for early detection of the condition. Histological examination remains the diagnostic gold standard, but it is subject to sampling error because the liver may be affected unevenly.1
Hepatic phosphorus-31 magnetic resonance spectroscopy (31P MRS) is a non-invasive technique which provides direct biochemical information on phospholipid membrane metabolism and on the energy status of the liver. A typical 31P MR spectrum of the human liver in vivo contains resonances which can be assigned to phosphomonoesters (PME), phosphodiesters (PDE), inorganic phosphate (Pi), and nucleotide triphosphates (NTP), including ATP.6-10 A variety of liver diseases have been studied using 31P MRS,6-13 but there is no information on patients with chronic ductopenic rejection. It is very unlikely that MRS will have any future role in the early detection of chronic ductopenic rejection, but as an in vivo research tool, it may provide some information on the pathogenesis of the condition.
At higher magnetic field strengths than those used for clinical MR systems, in vitro MRS on tissue extracts provides the required spectral resolution to separate the multicomponent PME and PDE resonances into their constituent metabolites. Such techniques have been successfully used to study the metabolite changes responsible for the in vivo PME and PDE signals in normal liver, hepatic tumours, and in patients with cirrhosis.14-16
The MR signal from endoplasmic reticulum (ER) also contributes to the PDE resonance.17 In vitro MRS techniques cannot provide information on this, but quantification of hepatocyte ER using electron microscopy may also help in determining the underlying mechanisms responsible for in vivo hepatic MRS abnormalities.
The aims of this preliminary study were thus to delineate abnormalities in the in vivo hepatic MR spectra of patients with chronic ductopenic rejection. Any abnormalities observed would firstly be compared with in vivo hepatic MR spectra from normal healthy volunteers, transplanted patients with good graft function, and a group of patients with biliary strictures, acting as jaundiced controls. Secondly, these spectral changes would be further characterised by in vitro MRS and electron microscopy examination of freeze clamped liver samples obtained at the time of retransplantation.
Patients and methods
PATIENTS
Twenty two patients were assessed for in vivo MRS study following hepatic transplantation, but six of these individuals failed to complete the spectroscopic examination either because of discomfort or claustrophobia.
The study population for in vivo MRS therefore comprised 16 patients (six men and 10 women) of mean age 39 (range 22–68) years, all of whom had undergone orthotopic liver transplantation for chronic liver failure. All patients had received azathioprine, one patient was on tacrolimus, and 15 patients were taking cyclosporin as part of their immunosuppressive regimen. Four individuals had biochemical evidence (table 1) and biopsy proven evidence of severe ductopenic rejection. The initial indication for transplantation was primary sclerosing cholangitis in three of these individuals and autoimmune hepatitis/cirrhosis in one individual. Three of the patients with ductopenic rejection were subsequently retransplanted because of graft failure and in vitro hepatic 31P MRS was performed on samples of these livers, obtained at the time of retransplantation. The remaining 12 individuals had good graft function on the basis of standard biochemical liver function tests (table 1) and liver biopsy appearances; the MRS examination took place after a considerably shorter postoperative time period than in those subjects with chronic ductopenic rejection (table 1), owing to the natural history of the latter condition which develops well beyond the initial postoperative period. It was difficult to recruit patients with well functioning grafts for MRS beyond the first few weeks after the liver transplant operation, but we did examine two individuals at 217 and 249 days for temporal comparison with the group of patients with chronic ductopenic rejection. The median time interval between transplant surgery and MRS examination was therefore 20 (range 10–249) days for the 12 patients with good graft function and 377 (range 280–851) days for the four patients with chronic ductopenic rejection.
Liver function tests of study patients
The reference population for in vivo MRS comprised an age matched group of 23 healthy volunteers who had no history, clinical, or biochemical evidence of liver disease (mean age 37, range 25–58 years). None of these individuals was taking regular medication and all consumed less than 20 g of alcohol per day on a regular basis. A further control group (table 1) of six jaundiced patients (mean age 34, range 21–50 years) was studied with biliary strictures (five with primary sclerosing cholangitis and one with a postcholecystectomy bile duct stricture); none of these patients had cirrhosis of the liver and none had undergone liver transplantation.
All MRS studies were undertaken after an overnight fast. Blood was drawn for standard laboratory liver function tests immediately prior to each MRS examination. Individuals were excluded from the study if they had cardiac pacemakers or other ferromagnetic implants such as operative clips. All subjects provided written, informed consent. The study protocol conformed to the ethical guidelines of the 1975 Declaration of Helsinki with a priori permission being obtained from the Ethics Committees of the Royal Postgraduate Medical School, London (REC 4047), and the Royal Free Hospital and School of Medicine, London.
IN VIVO MRS METHODS
In vivo hepatic 31P MR spectra were obtained using a Picker prototype spectroscopy system (Picker International, Cleveland, Ohio, USA), based on a whole body magnet (Oxford Magnet Technology, Oxford, UK) operating at 1.5 Tesla. An enveloping transmitter body coil and a separate surface receiver coil were used, both double tuned for protons at 64 MHz and phosphorus at 26 MHz. The proton signal was used for shimming and to obtain a T1 weighted image (TR 600 ms, TE 22 ms) in the axial plane to confirm patient positioning within the magnet coordinates. Localised spectra were obtained from eight parasagittal planes, each of nominal width 30 mm, using a one dimensional chemical shift imaging (1-D CSI) technique.18Spatial localisation was achieved perpendicular to the plane of the receiver coil; the lateral extent of the region sampled was determined by the sensitivity profile of the coil. Data were collected with repetition times (TR) of 5 seconds (16 averages) and 0.5 seconds (64 averages) with a pulse angle of 45°. The pulse was calibrated using an external pick-up loop, which monitored the radiofrequency (rf) field directly. The variations in loading on the transmitter system between phantom calibration studies and in vivo human studies were corrected for by this procedure. The choice of a 45° rf pulse is commensurate with improving spectral appearances or signal to noise ratios in instances where TR is sufficiently low for resonances to be partially saturated.19 The total examination time varied between 45 and 60 minutes.
Data processing
A typical in vivo hepatic 31P MR spectrum contains six resonances attributable to PME, Pi, PDE, γNTP, αNTP, and βNTP (γ, α, and β phosphates of nucleoside triphosphates). A phosphocreatine (PCr) resonance is present in spectra from some parasagittal planes of liver, because the MR localisation technique does not always exclude a signal from anterior and posterior abdominal wall muscle.13 A single observer, who was blinded to the patients’ clinical condition, processed, phased, and analysed all in vivo spectra in this study. The spectra were processed with a simple cosine filter in the spatial domain and a 60 ms exponential (or 5.3 Hz Lorentzian) filter in the time domain. Spectra were manually phased to provide zero order phase correction. The delay in applying the localising phase encoding gradients in the 1-D CSI sequence resulted in the appearance of a baseline roll. This artefact was removed using prior knowledge based data processing of the data in the frequency domain to provide baseline roll corrected spectra.20Spectra from the single parasagittal plane of liver with best signal to noise ratio and the least or no PCr was chosen for further analysis. The anatomical position of this plane was confirmed by reference to the MR image. Peak area ratios for PME, Pi, and PDE, relative to the βNTP resonance (NTP) were measured in the baseline corrected spectra. All baseline roll corrected spectra were fitted to inverse polynomial functions, as previously described,13 using the NMR1 spectral processing program (New Methods Research Inc., E Syracuse, New York, USA), which relies on a minimum residual sum of squares using a non-linear minimisation algorithm. This was performed on a SUN SPARCstation 10 (Sun Microsystems Inc., Mountain View, California, USA).
The peak heights of spectral metabolites were used to calculate signal height ratios (SHR) (TR 5 s/TR 0.5 s), providing an estimation of T1 values.
IN VITRO METHODS
Standard percutaneous or transjugular liver biopsy techniques do not provide large enough tissue samples for in vitro 31P MRS studies and therefore specimens of liver were obtained at retransplantation from five patients with chronic ductopenic rejection, three of whom had undergone in vivo hepatic 31P MRS. The median lag time between in vivo MRS and hepatic retransplantation was 84 (range 28–112) days. The additional in vitro hepatic31P MRS data were obtained from two further patients (one man and one woman) of mean age 52 years with chronic ductopenic rejection. One had initially been transplanted for primary biliary cirrhosis and the other for alcoholic cirrhosis; neither had undergone prior in vivo hepatic 31P MRS owing to claustrophobia.
In every case, six to eight representative pieces of liver of approximately 1 cm3 in size were freeze clamped in liquid nitrogen with minimum possible ischaemic time (two to four minutes). This procedure was performed within two minutes of hepatectomy in all except one patient. All samples were stored separately in a liquid nitrogen dewar until further processed.
It was not ethical to obtain liver biopsy samples from hepatic wedge resections for in vitro MRS analysis from transplanted patients with good graft function, as these patients were well and did not require the invasive surgical techniques necessary for biopsy procurement. Furthermore, our control patient population with biliary strictures were clinically stable and it was not indicated to perform further liver biopsies solely for the purposes of in vitro MRS analysis. Our previously published reference data for in vitro MRS were therefore obtained from wedge biopsy samples of liver, taken from six patients undergoing laparotomy for surgical treatment of pancreatitis.14-16 In all six individuals, contiguous samples of liver tissue were found to be histologically normal on examination.14
Sample processing
In each of the five cases, approximately 1000 mg (926–1401 mg) of liver tissue was processed with 12% perchloric acid (PCA), added to the still frozen samples, in a ratio of 5 ml per 1000 mg of liver. This procedure ensured complete extraction of water soluble metabolites. All samples were ground down under liquid nitrogen with a mortar and pestle and then allowed to thaw, before centrifugation at 3000 rpm for 10 minutes. The supernatant was separated, neutralised with 3 M potassium hydroxide, freeze dried, and reconstituted in deuterium oxide. The pH was readjusted to 7.5, after the addition of 100 mmol/l of EDTA to chelate any metallic ions present such as Cu2+ and Fe2+, which would otherwise degrade the quality of the MR signal obtained. Absolute quantification of metabolites was achieved by adding known amounts of methylene diphosphonate (MDP) and/or PCr to the perchloric acid extracts. These also acted as internal reference standards for chemical shift assignments of the resonances observed. Metabolites were assigned using the methods that we have previously described.14-16 The chemical shift of each metabolite was found and subsequently confirmed by the use of “spiking” with known compounds.14-16
IN VITRO MRS METHODS
Proton decoupled 31P MR spectra were obtained at room temperature using a 11.7 Tesla MR spectroscopy system, from perchloric acid extracts of the freeze clamped tissue samples, with 16 K data points, a 45° pulse angle and TR 1s. Samples were also run with TR 20s and a 45° pulse angle so that corrections for T1relaxation could be made.
Data processing
The free induction decay was zero filled to 32 K and Fourier transformed after line broadening of 5 Hz. Peak areas for phosphoethanolamine (PE), phosphocholine (PC), glycerophosphorylethanolamine (GPE), glycerophosphorylcholine (GPC), MDP, and/or PCr were obtained by a single blinded observer using the NMR1 spectral integration program, which fitted the data to Lorentzian functions.
ELECTRON MICROSCOPY METHODS
Electron microscopy was performed on liver tissue from two of the patients with chronic ductopenic rejection who had undergone retransplantation, both of whom had also undergone in vivo and in vitro hepatic 31P MRS. These samples, having been freeze clamped immediately following transplant hepatectomy and stored under liquid nitrogen, were fragmented in a mortar and pestle which had been precooled with liquid nitrogen. Pieces of liver tissue less than 1 mm3 were then thawed in 5 ml of ice cold glutaraldehyde (1% vol/vol) in 0.2 M sodium phosphate buffer (pH 7.2). The method used has previously been described in detail.21 ,22 The amount of endoplasmic reticulum (ER) was visually assessed by a single observer, blinded to the clinical status of the patient. The grading system ranged from 1 (least) to 3 (most).
STATISTICAL ANALYSIS
As the data were not normally distributed, non-parametric statistical analysis was applied. Values for in vivo metabolite ratios and in vitro metabolite concentrations in the patient and reference populations were compared using the Mann-Whitney U test with a Bonferroni correction. Spearman rank correlations were calculated to determine the relation between the measured biochemical variables and the metabolite ratios. Comparisons between in vivo and in vitro MRS data were made using correlation coefficients. A p value of less than 0.05 was considered significant.
Results
IN VIVO MRS
The same resonances were seen in the hepatic 31P MR spectra from the reference population as in the liver transplant patient population (fig 1). There was no significant difference in the mean PME:NTP ratio between the healthy volunteers, the six patients with biliary strictures, and the 12 transplanted patients with good graft function (table 2), but four of these transplanted patients had a PME:NTP ratio beyond the upper end of the normal reference range (fig2). The mean PME:NTP ratio was significantly elevated in the four patients with chronic ductopenic rejection compared with the healthy volunteers (p<0.01) and patients with biliary duct strictures (p<0.01), but not compared with patients with good graft function (table 2).

In vivo hepatic 31P MR spectra from (A) a healthy volunteer, (B) a patient with good graft function, and (C) a patient with chronic ductopenic rejection.
Metabolite ratios in the patient and reference populations
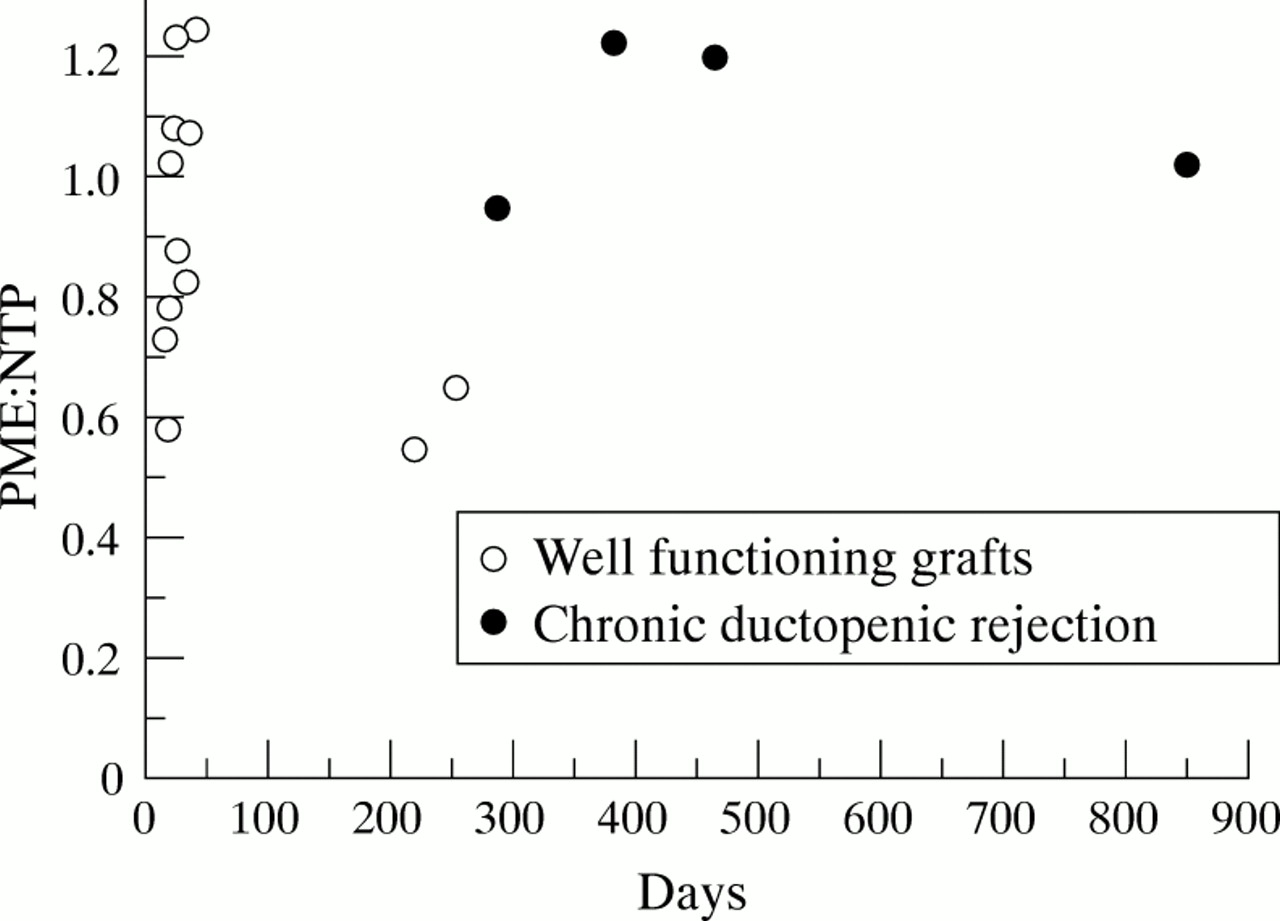
Scattergram of PME:NTP values plotted against the length of postoperative period prior to in vivo MRS examination.
There was no significant difference in mean PME signal height ratio (SHR) between the 12 patients with good graft function, the six control patients with biliary strictures, and the 23 healthy volunteers. However, the mean PME SHR was significantly elevated in patients with chronic ductopenic rejection compared with both the normal controls (p<0.01) and the patients with good graft function (p<0.05), but not compared with those patients with biliary strictures (table 3).
Signal height ratios (SHR) in patient and reference populations
There were no statistically significant differences in the mean Pi:NTP ratio or the mean Pi SHR between the patient and reference populations. There were also no statistically significant differences in chemical shift of any of the resonances or in pH values between the patient and reference groups. Furthermore, the mean PDE:NTP ratio for the 12 transplanted patients with good graft function was not significantly different from that for the reference population (table 2, fig 3), but all four patients with chronic ductopenic rejection showed a significant elevation in the PDE:NTP ratio compared with both healthy volunteers (p<0.005) and patients with good graft function (p<0.005) (table 2). There was no significant difference in mean PDE:NTP ratios between the patients with chronic ductopenic rejection and the six jaundiced patients with biliary duct strictures, since one of the latter group also had a significantly elevated PDE:NTP ratio.

Scattergram of PDE:NTP values plotted against the length of postoperative period prior to in vivo MRS examination.
There was also no significant difference in PDE SHR between any of the patient and reference populations (table 3), but there was a significant direct correlation in the total transplant patient population between the PDE:NTP ratio and serum bilirubin (correlation coefficient 0.7; p<0.0001) and serum alkaline phosphatase activity (correlation coefficient 0.65; p<0.0005).
There was no trend towards elevation in values for MRS metabolite ratios with increasing length of the postoperative period prior to MRS examination. Instead, when the two groups of transplant patients were considered separately, there was a trend towards reduction in these ratios with time in patients with well functioning grafts. This is shown in fig 2 for PME:NTP (r 2=0.26 for patients with good graft function; r 2=0.01 for patients with chronic ductopenic rejection). Similarly, when PDE:NTP values were considered (fig 3), there was a trend towards reduction in metabolite ratios with time in the patients with good graft function (r 2=0.24 for patients with good graft function; r 2=0.1 for patients with chronic ductopenic rejection).
IN VITRO MRS
Figure 4 shows a typical in vitro 31P MR spectrum from a PCA liver extract containing resonances arising from PME, Pi, PDE, and both nucleotide diphosphates (NDP) and triphosphates (NTP). MDP and PCr were added as internal reference standards. The PME region of the spectrum consists of over 10 resonances, including signals from PE, PC, adenosine monophosphate (AMP), coenzyme A, 2,3-diphosphoglycerate, and intermediates of carbohydrate metabolism such as glucose 6-phosphate, glycerol 1-phosphate, 3-phosphoglycerate, and ribose 5-phosphate.14-16 The PDE region contains two major resonances, GPE and GPC.14-16 ,23

Typical proton decoupled in vitro 31P MR spectrum of perchloric acid extracted normal liver tissue. (A) Full spectrum; (B) PME and PDE regions. PME, phosphomonoesters; PDE, phosphodiesters; NTP, nucleotide triphosphates; NDP, nucleotide diphosphate; PE, phosphoethanolamine, PC, phosphocholine, GPE, glycerophosphorylethanolamine; GPC, glycerophosphorylcholine; PCr, phosphocreatine; MDP, methylene diphosphonate.
Most of these metabolites are unstable with ischaemia and therefore only PE and PC from the PME region and GPE and GPC from the PDE region of the spectrum were quantified as their concentration is not significantly changed by ischaemic periods of up to one hour.24-26
The signal intensity of the PE and PC resonances was increased and the GPE and GPC resonances reduced in spectra from all five patients with chronic ductopenic rejection, when compared with spectra from the six histologically normal livers. Table 4 presents the metabolite concentrations and fig 5 shows a spectrum from a patient with chronic ductopenic rejection. MDP was added as an internal reference standard for quantification purposes. There were significantly higher PE (p<0.005) and PC concentrations (p<0.05) and significantly lower GPE (p<0.005) and GPC concentrations (p<0.005) in the PCA extracts from all the patients than from the six reference livers (table 4). When different regions of the same liver were analysed, regional variations in metabolites were observed (table5).
Metabolite concentrations obtained from in vitro MRS of liver tissue

In vitro hepatic 31P MR spectrum from a perchloric acid extract of liver tissue from a patient with chronic ductopenic rejection. (A) Full spectrum; (B) PME and PDE regions. PME, phosphomonoesters; PDE, phosphodiesters; NTP, nucleotide triphosphates; NDP, nucleotide diphosphate; PE, phosphoethanolamine; PC, phosphocholine; GPE, glycerophosphorylethanolamine; GPC, glycerophosphorylcholine; MDP, methylene diphosphonate.
Metabolite concentrations from different regions of the same liver from representative patients with chronic ductopenic rejection
IN VIVO/IN VITRO MRS CORRELATIONS
Although the sample size is too small to yield definite conclusions, in the three patients where comparisons between in vivo and in vitro MRS techniques were possible, there was no correlation between the concentration of PE or PC (r 2=0.08) measured in vitro and the PME:NTP ratios calculated in vivo. Similarly, there was no correlation between the concentration of GPE (r 2=0.01) or GPC (r 2=0.03) measured in vitro in each individual patient and the calculated PDE:NTP ratios in vivo.
ELECTRON MICROSCOPY
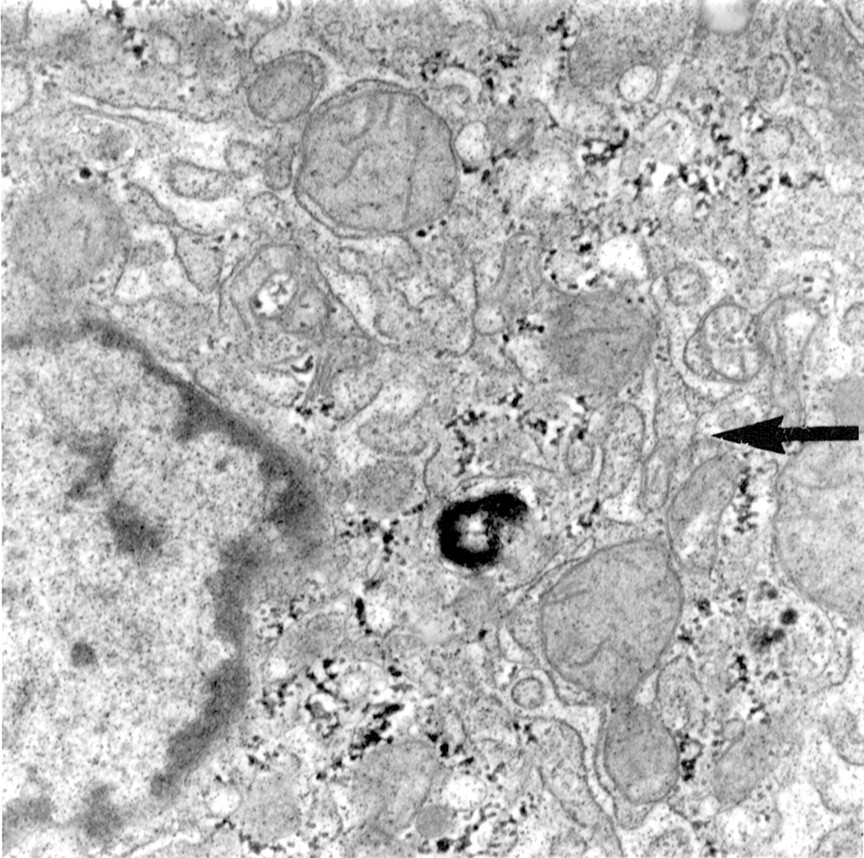
On electron microscopy of the hepatic parenchymal epithelial cells from the patients with chronic ductopenic rejection, there was no abnormal proliferation of endoplasmic reticulum in either of the liver samples examined. In certain sections there was actually a paucity of these subcellular structures (fig 6). The cytoplasm in this liver sample contained very scanty amounts of endoplasmic reticulum (arrow) of either rough or smooth type (ER score = 1). Mitochondria were few in number, typically enlarged, and mildly irregular in shape. Large quantities of granular aggregates of glycogen were present throughout the cytoplasm.
Electron micrograph of liver (original magnification × 10 000) from a patient with chronic ductopenic rejection.
Discussion
The salient feature of chronic rejection in the later post-transplant period is a loss of small bile ducts (ductopenia) and on average this affects 8% of liver transplant patients, often resulting in severe cholestasis.1 It is usually associated with progressive graft dysfunction and may require retransplantation.3 However, its diagnosis can be difficult, resting to a large extent on histological examination of liver biopsy samples.27 Classically, there is loss of bile ducts in at least 50% of the portal tracts,1 but often considerably fewer portal tracts may be affected, which frequently makes definitive diagnosis impossible at an early stage. Furthermore, the condition affects the liver patchily and the diagnosis often may only be made on comparison of serial biopsy specimens.27As there is evidence to suggest that the chronic rejection may be reversible,4 ,5 consequent to manipulation of antirejection chemotherapy, a reliable means of early diagnosis is required.
Both the PME and the PDE resonances are multicomponent and the constituents are not resolved at the magnetic field strengths used in human in vivo 31P MRS examinations. In this preliminary study, we investigated the biochemical basis behind abnormalities in the composite PME and PDE resonances seen in hepatic spectra from patients with chronic ductopenic rejection. As conventional liver biopsy techniques do not yield enough tissue for correlative in vitro MRS and electron microscopy, it was necessary to study patients undergoing retransplantation, where sufficient tissue was available from the explanted liver for the in vitro studies. These patients obviously had advanced disease and showed significant elevations of the mean PME:NTP ratio, mean PME SHR and the mean PDE:NTP ratio when in vivo MR spectra were compared with those from the healthy volunteers. MR spectra from control patients with biliary duct strictures were significantly different in the PME region from those of patients with chronic ductopenic rejection, but not in the PDE region. The31P MR spectra obtained from patients with good graft function were indistinguishable from those from healthy volunteers and patients with biliary duct strictures.
Signal height ratio values determined from data acquired at TR 0.5s and 5s provide an estimate of changes in T1, which is the MR time constant governing the recovery of longitudinal magnetisation after excitation. Different metabolites have different T1values and these may change with disease. Accurate delineation of T1 values requires five or six measurements with different repetition times. This would considerably lengthen the duration of the MR scan and therefore this was not possible within the time constraints of the clinical examination. Thus, SHR measurements were used to give an indication of these changes. In our study, the mean PME SHR in patients with chronic ductopenic rejection was significantly increased, compared with that of both healthy volunteers and patients with good graft function, although the Pi SHR and PDE SHR remained unaltered. The T1 changes indicated by the differences in SHR probably arise from a variation in the relative contribution of different components to the PME resonance. In order to address this problem and fully separate the components of the in vivo MR peaks, we therefore undertook in vitro 31P MRS studies of liver tissue extracts at higher magnetic field strengths.14
The PME peak includes contributions from PC and PE, intermediates on the pathway of phospholipid membrane synthesis,28 as well as contributions from AMP and various glycolytic intermediates (sugar phosphates).14 Our in vitro hepatic MRS results show that the elevation of the mean PME:NTP ratio in patients with chronic ductopenic rejection represents an increased contribution of PE and PC to the PME resonance. These metabolites have previously been shown to increase during hepatic regeneration both in animal studies17 and in humans with cirrhosis16 ,22and hepatic tumours.15 It does not therefore seem surprising that in other conditions where there may be rapid cell turnover, such as hepatic graft failure in chronic ductopenic rejection, that these cell membrane precursors are increased.
The PDE resonance is also composite, including signal from GPC and GPE, intermediates on the pathway of phospholipid breakdown,28and a contribution from endoplasmic reticulum.29 Our in vitro hepatic MRS results show that the increase in the PDE:NTP ratio which we observed in the individuals with chronic ductopenic rejection in vivo is not due to a larger contribution of these cell membrane breakdown products to the PDE resonance.
A compensatory increase in hepatocyte endoplasmic reticulum29 could be responsible for the observed elevation in the PDE:NTP ratio from these patients with poor graft function. This hypothesis was further investigated using electron microscopy of tissue samples obtained from the chronically rejected liver at retransplantation; the results failed to show any proliferation in endoplasmic reticulum in the hepatic parenchymal epithelial cells. However, it is possible that an increase in the mobility of phospholipids in the endoplasmic reticulum would account for the elevated PDE:NTP ratio. We have no evidence to support this hypothesis, but if this were the case, the MR signal would be increased without altering the absolute quantity of endoplasmic reticulum present.
Chronic ductopenic rejection is characterised by interlobular and septal bile duct loss1 and since none of the major recognised components of the PDE resonance were elevated, one further explanation of the increase in the PDE:NTP ratio in vivo may be a significant contribution from phospholipids in the bile in these severely cholestatic patients. This is an attractive hypothesis, as we have found that there is a direct correlation between the standard indicators of cholestasis (bilirubin p<0.0001; alkaline phosphatase activity p<0.0005) and the PDE:NTP ratio in vivo. However, such in vivo MR spectral abnormalities in the PDE resonance are probably not specific to this syndrome, because patients with other cholestatic conditions, such as primary biliary cirrhosis and primary sclerosing cholangitis, also have a higher PDE:NTP ratio than may be expected in vivo.13 ,30 Furthermore, in previous studies, in vitro MRS of liver extracts obtained at the time of transplantation from patients with primary biliary cirrhosis and primary sclerosing cholangitis have also failed to show any increase in cell membrane breakdown products which would account for any PDE abnormality in vivo.16 In this study we chose to examine a group of jaundiced patients with biliary strictures to act as cholestatic controls for the in vivo MRS examinations. One of these patients also had a greatly elevated PDE:NTP ratio, but such changes in the PDE:NTP ratio were generally of a smaller order of magnitude than those which we observed in individuals with chronic ductopenic rejection.
It should be noted that patients with good graft function were examined with in vivo MRS considerably earlier than patients with chronic ductopenic rejection. It is possible that this could have introduced an element of bias in the results. Future longitudinal studies must address this issue in detail. Ideally, we should have performed repeated examinations on both transplant groups. However, MRS examinations are tiring, since patient positioning in our spectroscopy system involves long periods lying supine with the right arm bent above the head in order not to interfere with the MR signal from the liver. Patients with chronic ductopenic rejection were all chronically fatigued and were therefore reluctant to undergo serial examinations. Furthermore, most patients were reluctant to volunteer for MRS studies when they were feeling perfectly well (and wanted to stay out of hospital), other than in the early post-transplant period. Nevertheless, in the two patients with well functioning grafts who were examined at 217 and 249 days post-transplant, the PME:NTP and PDE:NTP results were the lowest or among the lowest observed; the differences from the values recorded for these metabolite ratios in the patients with chronic ductopenic rejection were extremely notable (figs 2 and3). Although the numbers involved are small, these results are against a bias towards an underlying rise in metabolite ratios with time.
The absence of an in vivo–in vitro MRS correlation is not surprising. Firstly, the number of patients where this analysis was possible was too small for meaningful statistical correlations. Secondly, the regional variations in metabolite concentrations observed in extracts from different areas of the same liver probably reflects the fact that the rejection processes do not affect the liver in a uniform fashion.27 The biochemical information provided by the 1-D CSI in vivo MRS is essentially an average from a large slice of the liver, whereas in vitro MRS provides information on small specimens of tissue, which may have a degree of sampling error. Thirdly, the quantification of the membrane phospholipid precursors and degradation products in vitro does not reflect all the contributions to the PME and PDE resonances in vivo. Glycolytic intermediates, for example, were not quantified, because of an unavoidable period of ischaemia involved with the human liver transplant protocol. Furthermore, biliary phospholipids were not quantified by this study and need further evaluation. A final confounding factor may have been the time lag between in vivo MRS examination and retransplantation (when material for in vitro MRS and electron microscopy was collected). However, since the rejection process leads to an inexorable slide towards liver failure, it may be expected that the in vitro results may have become more abnormal with time rather than improving during the waiting period for a suitable donor liver.
MRS techniques largely remain a research tool and it is extremely improbable that such methodology will be of future use in the clinical diagnosis of chronic ductopenic rejection. Nevertheless, further larger scale studies are needed to elucidate fully the pathogenic mechanisms underlying our MRS findings in such patients in this preliminary study and to determine the sensitivity and specificity of these observations. Ideally in vivo MRS examinations should be performed serially to observe spectral changes over time. Such studies, not only in patients with allograft rejection, but also in other cholestatic conditions that may occur post-transplantation must involve a correlation between in vivo hepatic 31P MRS and in vitro 31P MRS analysis of liver biopsy material, plasma, and bile (obtained from indwelling biliary T tubes, if present in the immediate postoperative period, or from ERCP for assessment of biliary phospholipid content). Additional electron microscopy of hepatic parenchymal epithelial cells, cell fractionation studies, and carbon-13 MRS of lipid extracts from liver samples may shed further light on hepatocyte membrane content.
This study does not bring the search for a simple, non-invasive marker of chronic ductopenic rejection any closer, but it does suggest that further investigation of alterations in biliary phospholipid metabolism may be a useful future direction of research.
Acknowledgments
This study was supported by the British Medical Research Council, the UK Department of Health, and Picker International, Cleveland, Ohio, USA. ULIRS in vitro MRS facilities were used at Birkbeck College, London. Dr K Kumar Changani is supported by the Wellcome Trust. Dr Caroline Doré, Royal Postgraduate Medical School, London, advised on statistical methods. Peter Young and Paula Stafford, Liverpool School of Tropical Medicine, Liverpool, provided technical expertise for electron microscopy. We are grateful to Dr Marsha Y Morgan and her team (Angela Madden, Margaret M Harris, Harriet Gordon, Rosemary Mallalieu) from the Royal Free Hospital, London, who gave consistently helpful comments on the study.