Article Text

Abstract
Aims—To determine the sources of funding for UK gastroenterology research papers and the relative impact of papers funded by different groups and of unfunded ones.
Methods—UK gastroenterology papers from 1988–94 were selectively retrieved from theScience Citation Index by means of a specially constructed filter based on their title keywords and journal names. They were looked up in libraries to determine their funding sources and these, together with their numbers of authors, numbers of addresses, and research category (clinical/basic) were considered as input parameters to the research. Output parameters analysed were mean journal impact category, citation counts by papers, and the frequency of citation by a US patent.
Results—Gastroenterology papers comprise about 7% of all UK biomedical research and 46% of them have no acknowledged funding source. One quarter of the papers acknowledged government support, and a similar fraction a private, non-profit source; 11% were funded by the pharmaceutical industry. The papers acknowledging funding had significantly more impact than the others on all three measures. The citing patents had six times more UK inventors than the average for all US Patent and Trademark Office patents in the relevant classes and were mostly generic in application.
Conclusion—The variation in impact of papers funded by different sources can mostly be explained by a simple model based on the input factors (numbers of funding bodies, numbers of authors, numbers of addresses, and research type). The national science base in gastroenterology is important for the underpinning of UK invented patents citing to it.
- gastroenterology
- research
- funding
- impact
- citations
- patents
Statistics from Altmetric.com
This study was conducted in order to investigate the state of British gastroenterology research, and in particular to compare the outputs of different funding bodies and groupings (for example, medical research charities). Biomedical research projects normally lead to publications in the serial literature and these are often used as a measure of the success of the work.1-5 However they are really only the first step in the dissemination and application of the results of the research. These are described as outcomes rather than outputs and there is a complex pattern of interactions by which the latter are turned into the former.6-8 The present paper is concerned with the direct outputs and with their second order effects on other scientists (citations by papers) and on inventors (citations by patents).
The primary focus of the study was on the funders of research and the differences between papers that acknowledge no funding source and ones that acknowledge one or more. These acknowledgements may be explicit, or implicit from the address(es) on the paper (for example, those of pharmaceutical companies or government laboratories). It was known that papers with no funding sources were less frequently cited9 and in journals of lower impact; the number of authors also had a positive effect on impact.10 The effect of multiple addresses appears positive in isolation,11 but because of its close correlation with the numbers of authors and numbers of funding bodies on a paper, its effect may actually be negative. Another input factor known to affect impact is the type of research being undertaken, with clinical papers normally attracting fewer citations than basic ones.12 (This link means that research level is not strictly independent of journal impact.) However it was not known whether these differences in input factors would also affect the likelihood that papers would be used to underpin commercially valuable technology as embodied in US patents.
The analysis of patents and the prior art in the form of non-patent references that they cite is now establishing itself as an important technique.13-15 It has been shown that human genome technology depends on a strong local or national science base,16 and that industrial intellectual property in many fields in the USA is largely underpinned by publicly funded science.17 But the analysis can also be extended to look at the potential applications of the technology and the extent to which scientific advances in one field are used in others.
Methods
Many previous attempts to categorise research papers in journals by subfield have simply used the specialist journals to identify them.18 ,19 However this not only misses typically two thirds of the total literature,20 but also many of the most highly cited papers which appear in general scientific journals such as Nature or general medical ones such as the Lancet. Accordingly, a “filter” was developed which combined some 76 title keywords or combinations, such as: abdominal; bowel; cirrhosis; dyspepsia; enteric; fecal; gastr* not (gastropod or gastrul*); hemorrhoid*; ileum; and jejun* with the names of 23 specialist journals. (Note: an asterisk denotes any character(s) or none; US spelling is used uniformly in theScience Citation Index.) UK papers were retrieved, either if they were in one of the specialist journals, or had one of the selected title keywords, from the Research Outputs Database, a PRISM database of biomedical research papers (articles, notes, and reviews only) that is based on theScience Citation Index.21 (It currently covers papers from 1988–95, but this study was conducted on 1988–94 papers only.) The filter was calibrated by three individual experts to determine its degree of recall, R (papers that should be retrieved that actually were), and its degree of precision, P (papers that were retrieved that actually should be): these gave estimates of R=0.87 and P=0.83. These values mean that the filter was relatively good because gastroenterology has numerous technical words that are specific to the subject. (The use of three experts rather than just one was exceptional; they agreed well with each other on the selection of title words and the marking of the lists of papers.)
All the papers were looked up in libraries in order to record their source(s) of funding and these were recorded as trigraph (three letter) codes taken from the PRISM Funding Body Thesaurus. Each funding body was further characterised by its country of origin and its type, such as: CH—charity (collecting); FO—foundation (endowed); GA—government agency; GD—government department; HT—hospital trustees; IN—industry; MI—mixed (academic); and NP—other non-profit. UK postcodes were added or corrected as necessary to permit a geographical analysis of outputs.
The numbers of funding bodies, N, recorded for each paper were determined, as were the numbers of authors, A, and the numbers of addresses, D. The fourth input parameter was the type of research described. This was categorised on the basis of the journal in which the paper was published as a “research level”, RL, in four classes: 1—clinical observation; 2—clinical mix; 3—clinical investigation; 4—basic research. Most biomedical journals have been assigned to one of these four classes by CHI Research Inc. in the USA, a specialist bibliometrics consultancy firm, on the basis of expert opinion and journal to journal citation patterns.22 It is a somewhat crude characterisation because many journals will carry a range of different types of paper, but it does permit large groups of research papers to be differentiated from each other.
Three different measures of output impact were used. The first was based on the impact factor of the journal in which the paper was published. This was taken as the five year mean count of citations (C0–4 values) to papers published in 1990 and cited 1990–94, as shown in the Institute for Scientific Information’sJournal Expected Citation Reports file. New journals for which five year mean citation scores were not available were given a score extrapolated from their citation scores over shorter time periods, as described in Leydesdorff et al.18 The intention was to place each journal in one of four weighting categories, with the top 10% of journals in terms of their impact factor being given a weight, W, of 4; the next 20% of journals a weight of 3; the next 30% of journals a weight of 2; and the bottom 40% a weight of 1.
However the 12 925 UK gastroenterology papers in the data set were published in some 971 different journals, and it did not seem reasonable to select the percentages in each group on the basis of the hundreds of journals with only one or two papers in each. In fact, three quarters of the papers were published in just 133 journals, each with at least 17 papers, and these were taken as a “core set”. They were listed in descending order of five year impact values (C0–4), with the highest being New England Journal of Medicine (n=20; C0–4 = 80.9), the most popular being Gut (n=1113; C0–4 = 11.6), and the lowest beingBritish Journal of Clinical Practice (n=136; C0–4 = 0.9). The top 13 journals (see table 1) all had C0–4 greater than 16.6 and were assigned a value of W=4; the next 27 (also listed in table 1) had C0–4 greater than 10.2 and were assigned W=3; the next 40 had C0–4 greater than 5.8 and were assigned W=2; the remaining 53 journals with C0–4 less than 5.8 were assigned W=1. The 838 (971−133) non-core journals were then assigned W values on the basis of their C0–4 values relative to the critical values of 16.6, 10.2, and 5.8.
List of core medical journals publising gastroenterology papers, in descending order of five year impact factor, in the top two impact categories (W4 and W3)
The second measure of impact was the number of citations, again taken over a five year period, in order to ensure that the peak annual score, which normally occurs in the second or third year after publication, was included. As at the time of the study citations were only available from the Science Citation Index up to 1995, the cited papers were taken from 1988 to 1991 only. A comparison was originally made between the C0–4values for papers supported by 12 UK charities and not for profit organisations (including the British Society of Gastroenterology) concerned exclusively with gastrointestinal research, see table 2(n=118), and a sample of papers supported by UK charities and foundations (n=376). For the purposes of the present paper, an additional analysis was carried out of three further samples of papers (n=294): those supported by the UK government departments and agencies, notably the Medical Research Council; those supported by the pharmaceutical industry, either intramurally or extramurally; and those with no acknowledgement (mainly National Health Service hospitals).
Twelve UK charities and non-profit organisations supporting gastrointestinal research
The third measure of impact was the frequency with which papers in different groups were cited by US patents. The data were taken from the TechTrac database maintained by PRISM, based on citations on the front page of US patents in all fields that were published up to mid October 1996. Although most papers are cited by other papers, only a small percentage of papers are cited on patents and it is rare for a paper to be cited by more than a single patent. The analysis also covered the details of the citing patents, including the countries of their inventors, their assignees, and their patent classes (subject areas) and applications.
Results
The gastroenterology filter retrieved 12 925 UK papers published during the seven years, 1988–94. The number of papers per year rose from 1758 in 1988 to 1973 in 1994. They represented just over 7% of the UK biomedical papers within the Research Outputs Database, or 6.7% when account is taken of the lack of recall and lack of precision of the filter. This proportion fell slightly from 7.1% to 6.2% over the period. Within the total, 46% had no acknowledged funding source and 85% of these papers came from National Health Service (NHS) hospitals. Of the 54% that did have funding, 25% were supported by the UK government (mainly the Medical Research Council), a similar percentage by UK private, non-profit organisations (collecting charities, endowed foundations, hospital and academic private funds, and other non-profit bodies), 11% by the pharmaceutical industry, and 2% by the 12 gastrointestinal (GI) charities listed in table 2. (These percentages sum to more than 54% because some papers had multiple funding sources.)
Over the seven year period, the proportion of papers directly funded by government remained steady, but the percentage without funding acknowledgements fell by five percentage points from 49% to 44%. By contrast, the percentage of papers funded by private, non-profit sources rose from 23% to 28%; the share of the pharmaceutical industry also rose, from 10% to 12%. The 12 GI charities supported just over 2% of the papers in the database, but this fraction increased from about 1.5% to 2.4%. This pattern of a decline in state funding and an increase in private funding for medical research has been seen in other subfields of biomedicine as revealed by the data in the Research Outputs Database.23
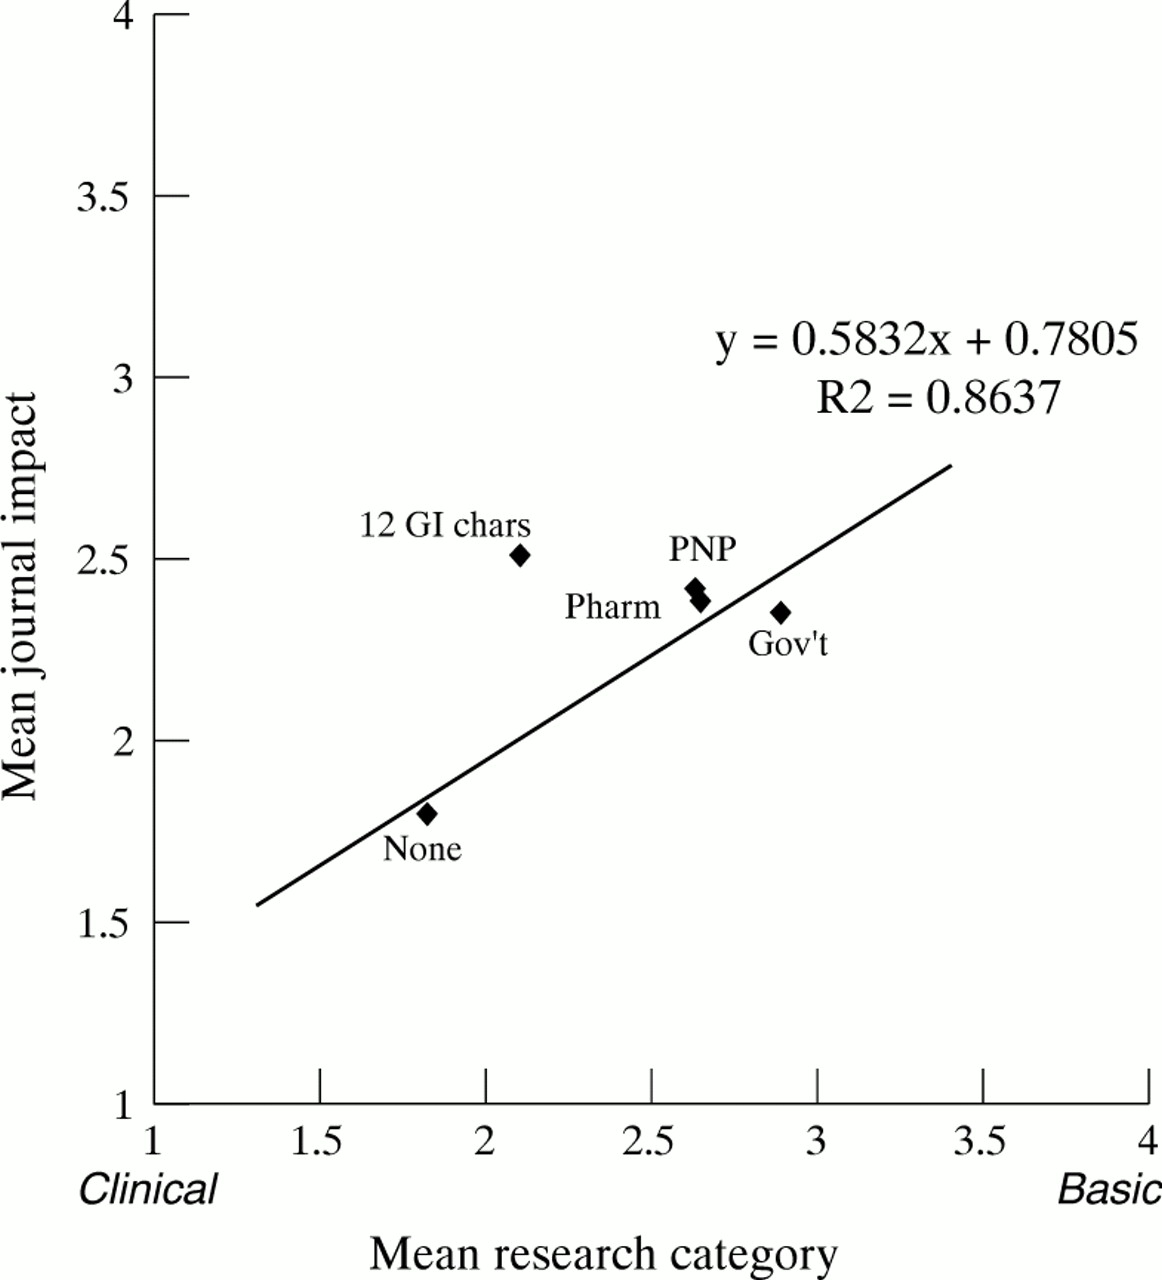
The categorisation of the papers by four classes of research category (RL) and of journal impact or weighting (W) allowed each paper to be put into one of 4 × 4 = 16 cells of a matrix, and the distribution to be shown as a carpet plot (see fig 1). The mean value of RL and of W for papers with each group of funding sources was determined; table 3 shows the results for different groups of funding bodies, and of none. There is a big difference both in research level, RL, and in mean journal weighting, W, between the funded and the unfunded papers. The relation is seen more clearly in fig 2. The trend line takes account of the different numbers of papers represented by each spot. The position of the spot labelled “GI chars” above the line indicates that these papers are being published in journals of significantly higher impact (by about 0.5 in W values) than would be expected for the type of research they report.

Plot of distribution of UK gastroenterology papers, 1988–94, by research category (RL) and journal impact (W). Mean RL = 2.28 (SE 0.009); mean W = 2.09 (0.009).
Mean research category and mean journal impact category for differently funded groups of UK gastroenterology papers 1988–94

Plot of mean journal weighting (W) against mean research category (RL) for groups of UK gastroenterology papers with different funding. PNP, private, non-profit; Pharm, pharmaceutical industry; GI chars, GI charities.
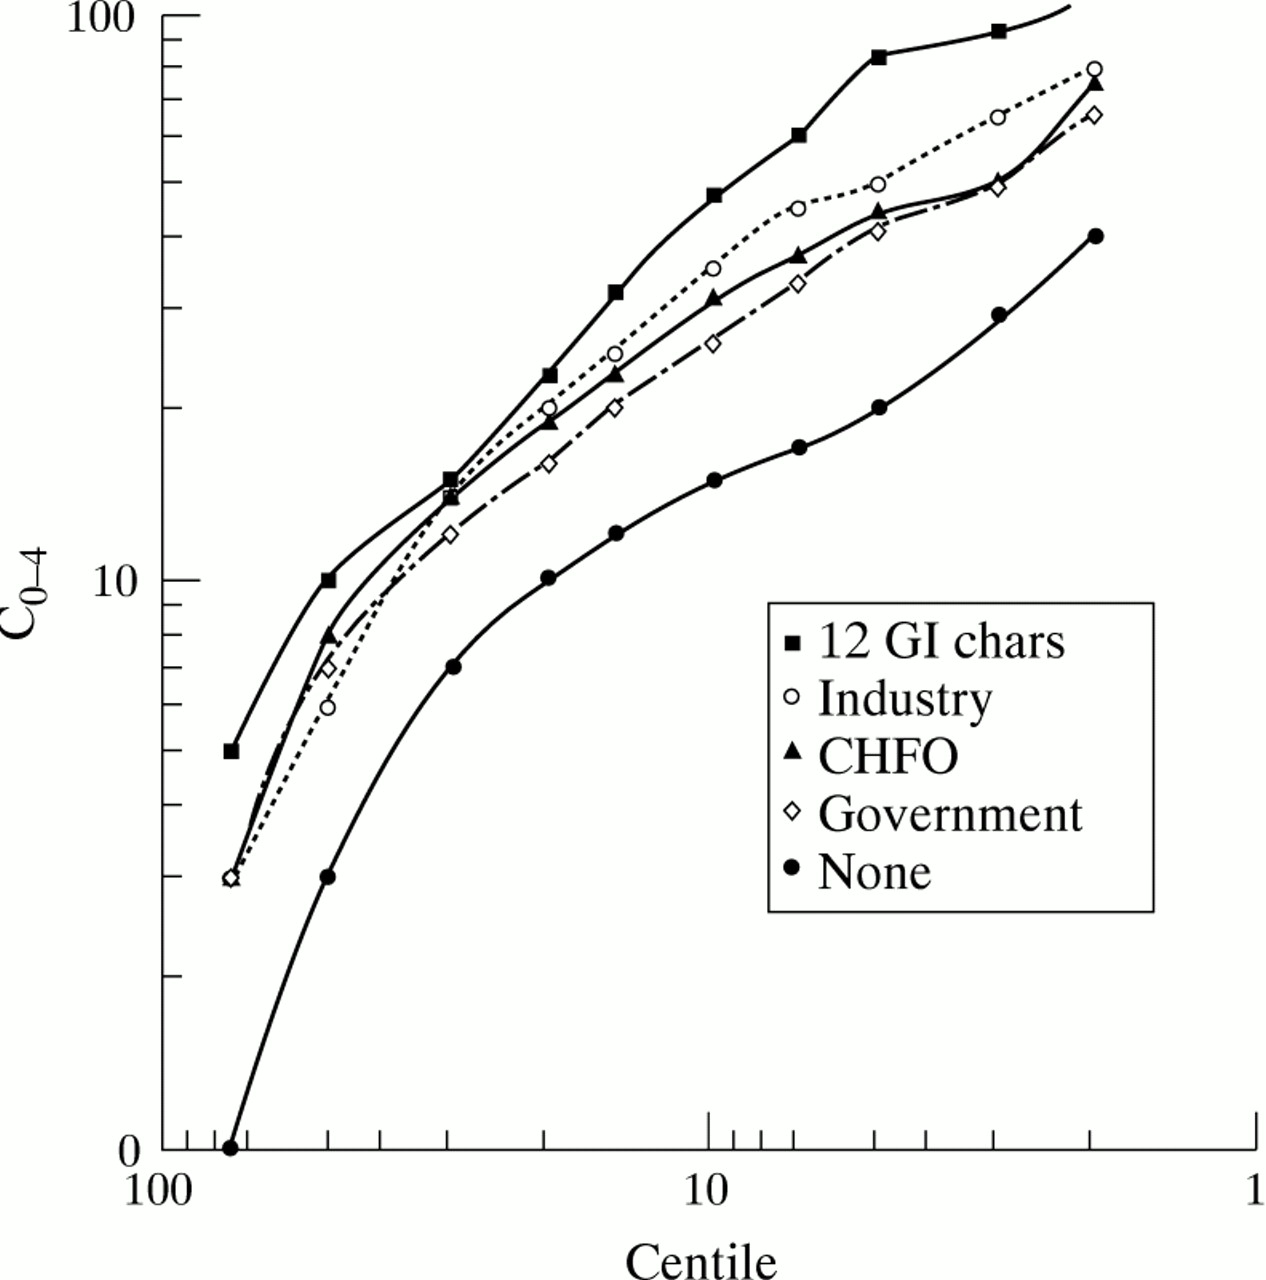
Figure 3 shows citation scores to samples (n=294 except for charities and foundations (n=376) and the 12 GI charities (n=118)) of the five groups of papers with different funding sources. This shows the distribution of five year citation scores for each sample plotted as the number of citations needed for a paper to be in each centile of its group. Both axes have a logarithmic scale so that the ratios between the numbers of citations received by different groups of papers can be perceived as the vertical distance between curves that are approximately parallel. The least cited group of papers is the one with no funding acknowledgements: government funded papers are more highly cited by a factor of 1.90; papers funded by charities and foundations by a factor of 2.12; papers funded by the pharmaceutical industry by a factor of 2.25; and papers funded by the group of 12 GI charities by a factor of 3.12.

Five year citation scores for five groups of UK gastroenterology papers, 1988–91. GI chars, GI charities; CHFO, charities and foundations.
As mentioned above, most scientific papers are not cited by patents. Those that are tend to be the older ones and the ones in basic research and clinical investigation journals, rather than in clinical observation and clinical mix ones. For example, the chance of a paper in a basic research or clinical investigation journal being cited compared with one in a clinical observation or clinical mix journal is more than double. This differential chance of citation inevitably influences the probability that papers funded by different groups, or by none, will be cited by a patent. Table 4 shows these probabilities separately for papers in the two groups of journals. Although the numbers of papers cited by patents are small, it is clear that the papers supported by the 12 GI charities and the industrial papers are the most frequently cited, and the unfunded ones the least, for papers in both groups of journals.
Numbers and percentages of UK gastroenterology papers 1988–94 cited by US patents up to 1996
The US patents citing to the UK gastroenterology papers numbered 224, and because of the inevitable delay between publication of a paper and of the citing patent, which includes the time needed for its examination, these patents were mostly from recent years, with 59 dated 1995 and 78 dated 1996. The citing patents had a total of 606 inventors, of which 444 were from the USA and 82 (13.5%) from the UK. Other countries well represented among the inventors were Sweden (19), Japan (16), and Canada (14). The assignees, or owners of the patents, were also identified. By far the largest number, 147, were from the USA: 105 were companies and 31 were universities. Of the other assignees, 21 (9.4%) were British and 10 were pharmaceutical companies, led by Glaxo Wellcome plc with six; four were assigned to the British Technology Group and two to University College Hospital. The citing patents were also categorised by their main patent class, and the numbers in each class that were for a gastroenterological application were determined. Table 5 shows the results. Surprisingly, gastroenterological applications are very much the minority except in “equipment and apparatus” and the dominant class is techniques and diagnostic methods, rather than drugs.
Analysis of US patents citing UK gastroenterology papers by patent class and application
Discussion
The above analysis has led to the following conclusions:
UK gastroenterological research outputs from 1988–94 have increased in absolute numbers but have declined slightly as a percentage of all UK biomedical output. Support for this research from the NHS has declined steadily while support from private sources, particularly non-profit ones, has increased.
Papers with no acknowledgements (effectively, ones from NHS hospitals) comprise nearly half the total and have less impact than papers acknowledging funding on all three measures (journal impact, citations by papers, citations by patents).
Papers funded by specialist GI charities only comprise 2% of the total but have the greatest impact, again on all three measures.
US Patent and Trademark Office (USPTO) patents citing to UK gastroenterological research are primarily US invented but UK inventors form nearly 14% of the total which is five times their proportion of the inventors of all USPTO 1995 patents in relevant medical classes (drugs and medicine; and professional and scientific instrumentation).
Only 9.4% of these patents had UK assignees, suggesting that US organisations are exploiting UK gastrointestinal science better than UK organisations, indicative of a development gap.
The citing patents are mostly for medical techniques and diagnostic methods, followed by drugs and medicine, and equipment and apparatus; only one third of them have applications limited to gastroenterology.
The relative decline in the UK commitment to GI research contrasts with the situation in other subfields related to parts of the body. For example, between 1988–90 and 1992–94, GI research papers increased by 5% but in the same time period, papers in renal medicine (2.2% of papers in the Research Outputs Database, ROD) increased by 13%, and papers in respiratory medicine (4.6% of ROD) and in cardiovascular medicine (8.9% of ROD) both increased by over 19%. So it appears that GI research is becoming relatively less popular.
One of the questions that arose was why the papers funded by the small GI charities should have such a notable impact. As it was known from Lewison and Dawson10 that gastroenterology papers had greater impact if they had more funding bodies, more authors, more addresses, and were basic rather than clinical, it was natural to examine whether these factors suffice to cause them to have a higher impact. Table 6 shows the mean number of funding bodies, N, the mean number of authors, A, the mean number of addresses, D, and the mean research level, RL, for papers funded by the 12 GI charities, by the three main funding groups, and by none. A set of multiple regression equations was derived to express W as a function of these input variables, first using a linear model for each, and then adding higher order terms in N and RL, with the constant term adjusted slightly if necessary to bring the overall average W estimated for all the papers into alignment with the actual value (2.09). The best overall fit was obtained with a quadratic term in N but linear terms only for the other variables:
 and the values of W estimated for each of the groups of papers are shown in the right hand column of table 6. (The negative coefficient for D shows that papers with multiple addresses are in lower impact journals than ones with a single address, if all other input factors are the same.)
Mean values of input parameters and of mean journal weighting category for differently funded groups of UK gastroenterology papers 1988–94
It can be seen that the equation overestimates the impact of government funded papers and underestimates that of the private, non-profit ones, which are therefore of higher impact than would be expected on the basis of the input parameters. The papers funded by the 12 GI charities are also of significantly higher impact than would be expected (the difference in W values is 0.18, which is three times the standard error of 0.06). Thus although the model accounts for much of the difference in mean journal impact category between the groups of differently funded papers, there are still some other factors that are needed to explain why particular groups differ in their impact from what would be expected. The main factor would probably be the actual quality of the work, which is of course not possible to measure in a quantitative way.
Acknowledgments
The work was funded by the British Society of Gastroenterology (BSG). Professors Robert Heading, Tom MacDonald, and David Thompson defined the gastroenterology filter, and David Thompson carried out the analysis of the US citing patents, on behalf of the BSG. The citation analysis was performed by my Wellcome Trust colleagues Robert Cottrell and Mark Challen, and the patent analysis by David Seemungal.