Article Text

Abstract
Background—Although leptin, an adipocyte derived hormone which regulates food intake and energy balance, is released after injections of tumour necrosis factor (TNF) and interleukin 1, plasma concentrations have not been characterised in chronic inflammation. Leptin may contribute to the anorexia and body weight loss associated particularly with the acute stages of inflammatory bowel disease.
Aims—To investigate plasma leptin concentrations during the time course of intestinal inflammation in different animal models.
Methods—Plasma leptin was measured at different time points in rats with trinitrobenzene sulphonic acid (TNBS) induced colitis, indomethacin induced ileitis, or endotoxic shock caused by lipopolysaccharide (LPS). Systemic TNF-α was also measured during acute inflammation.
Results—Plasma leptin concentrations increased fourfold eight hours after induction of TNBS colitis (p<0.0001) and twofold after administration of ethanol alone (p<0.02). Plasma leptin responses throughout the first post-treatment day were correlated with myeloperoxidase activity and gross damage scores. Similar leptin overexpression was observed in indomethacin induced ileitis and in rats with endotoxic shock. Plasma concentrations were lower in TNBS treated rats than in controls on day 5 before reaching a similar concentration on day 14. Anorexia and body weight loss were observed during the first four days post-TNBS. A significant increase in systemic TNF-α was only detected in LPS treated rats.
Conclusion—Elevated plasma leptin concentrations, correlated with the degree of inflammation and associated with anorexia, were induced in rats during the early stages of experimental intestinal inflammation but proved transient; this might account for discrepancies in recent results concerning concentrations in patients with inflammatory bowel diseases.
- leptin
- inflammatory bowel disease
- experimental rat intestinal inflammation
- tumour necrosis factor
- endotoxic shock
- anorexia
Statistics from Altmetric.com
- leptin
- inflammatory bowel disease
- experimental rat intestinal inflammation
- tumour necrosis factor
- endotoxic shock
- anorexia
Leptin, the protein product of the ob gene, is a circulating hormone primarily secreted from adipocytes. It is thought to act as a hormonal feedback signal in regulating adipose tissue mass via hypothalamic mechanisms controlling food intake, metabolic rate, and body weight homoeostasis.1 ,2 The cloning of leptin receptor cDNAs from various non-neuronal tissues, such as lung, kidney, liver, gonads, fat, and lymph nodes, as well as from stomach, small intestine, and colon,3-5 suggests that leptin also has extrahypothalamic effects. There is increasing evidence that leptin plays various unexpected but important roles in many systems such as reproduction6 and haematopoiesis.7 ,8 The leptin receptor is produced in several alternately spliced forms both in rodents and humans. The long isoform bears homology to members of the class I cytokine receptor family,3 which is consistent with a previous structural prediction indicating that leptin could be expected to fold into a cytokine like structure.9
Inflammatory bowel diseases (IBD) are commonly characterised by flare up phases. Anorexia, increased resting energy expenditure, and body weight loss are prominent features of these diseases, especially during acute stages.10-12 Despite enormous efforts over many decades, the aetiology of these severe wasting diseases remains enigmatic. It has been recently suggested that leptin plays a role in the anorexia associated with acute infection. Intraperitoneal administration of endotoxin or proinflammatory cytokines (tumour necrosis factor (TNF) and interleukin 1 (IL-1)) led to acute increases in leptin mRNA expression in adipose tissue and in circulating concentrations of leptin in fasted hamsters13 and mice.14 The increase in plasma leptin in hamsters was correlated with reduced food intake. To date, two other studies have shown that leptinaemia in humans is under the control of IL-1α15 and TNF.16 However, it is not clear whether leptin concentrations are modified during chronic inflammation. The availability of simple animal models of inflammation that closely resemble prevalent human intestinal inflammatory conditions facilitated the performance of the present study in which leptin and TNF-α were investigated during the time course of different experimental inflammations. The rat model of trinitrobenzene sulphonic acid (TNBS) induced colitis was used, which makes it possible to study plasma leptin patterns at different stages of inflammation. Changes in these concentrations were also studied in indomethacin induced acute ulcerative ileitis. Finally, the specificity of our findings was compared with those obtained after induction of lipopolysaccharide (LPS) endotoxic shock in rats.
Methods
ANIMALS AND EXPERIMENTAL DESIGN
Male Wistar rats weighing 380–390 g at the beginning of the experiment were obtained from Janvier Laboratories (Le Genest, St Isle, France) and then housed individually in a temperature controlled room (about 22°C) with a 12 hour light-dark cycle beginning at 8 00 am. They had free access to water and were provided with standard rodent chow according to the protocol described below. Before the experiments, animals were adapted to diet and maintenance conditions for several days. All experiments were conducted in compliance with the Animal Care and Use Committee of the INRA (France). Twenty four hour food intakes were measured by subtracting the food bin weight on each day from that of the previous day for three days before and all days after treatments. Rats were weighed daily during the period that food intakes were monitored.
All experiments started at 8 00 am and were performed in animals deprived of food for 11 hours but with free access to water (food was withdrawn at 9 00 pm, one hour after onset of the dark cycle). Before induction of inflammation, fasted blood samples were collected from the tail vein, and basal leptin and TNF-α concentrations were determined as described below. In addition, plasma leptin concentrations were measured at 8 00 am in ad libitum fed rats (n=16). Fasted blood samples were obtained from the tail vein during the time course of intestinal inflammation in three different models of inflammation: TNBS induced colitis, indomethacin induced acute ulcerative ileitis, and LPS endotoxic shock. Blood samples collected in heparin coated polypropylene tubes were centrifuged at 3000 rpm for 20 minutes at 4°C, and the supernatant clear plasma was then stored at −70°C until assay. At completion of the experiment, rats were anaesthetised, and their abdomens were opened between 9 00 and 11 00 am. Blood was collected via the inferior vena cava, and perirenal and epididymal fat pads were dissected and weighed. The stomach, small intestine, caecum, and colon were excised for the indomethacin model, but only the ileum and colon for the TNBS model. The organs and tissues were opened longitudinally, washed with saline solution to remove faecal material, and laid out on a board with the mucosa uppermost for macroscopic scoring. In addition, the severity of intestinal inflammation was assessed by myeloperoxidase (MPO) activity, an index of granulocyte infiltration. For this purpose, full thickness tissue samples were removed from macroscopically damaged tissue (inflamed rats) as well as from normal tissue (control rats), snap frozen in liquid nitrogen, and stored at −70°C for MPO assay.
TRINITROBENZENE SULPHONIC ACID INDUCED COLITIS
This model has been described in detail elsewhere.17Briefly, fasted rats were anaesthetised with pentobarbital, and colitis was induced on day 1 by a single intracolonic administration of 2,4,6-trinitrobenzene sulphonic acid (80 mg/kg) dissolved in 40% ethanol. A 1 ml aliquot of the solution freshly prepared on the day of treatment was injected into the colon 8 cm proximal to the anus, using a cannula which was left in place for one minute to ensure that the TNBS-ethanol solution was not immediately expelled by the rat. The rats were then maintained in head down position for 30 minutes.
TNBS treated rats were divided into three groups sacrificed on days 2 (n=6), 6 (n=5), and 15 (n=5). Three control groups received 1 ml of sterile pyrogen-free, isotonic 0.9% saline instead of TNBS on day 1 and killed on days 2 (n=6), 6 (n=6), and 15 (n=6). Fasted blood samples were obtained from the tail vein at 4, 8, 12, and 24 hours post-treatment. Similarly, samples were drawn at 8 00 am and 5 00 pm on day 5 and at 8 00 am on day 6. Finally, samples were drawn at identical time points on days 14 and 15. To determine the effect of ethanol treatment alone, a fourth control group of rats (n=5) was treated with ethanol (40% ethanol, 1 ml) on day 1 and killed on day 2. Fasted blood samples were drawn at 4, 8, 12, and 24 hours post-ethanol.
INDOMETHACIN INDUCED ILEITIS
Ileitis was induced in fed rats (n=7) by two subcutaneous injections of indomethacin, an inhibitor of the cyclooxygenase pathway of arachidonic acid, as previously described.18 The two injections (10 mg/kg in 5% freshly prepared NaHCO3 at 37°C) were administered 24 hours apart; the second injection of indomethacin represents day 1. Fasted blood samples were taken from the tail vein on day 2 (24 and 33 hours after the second injection), and on day 3 before sacrifice (48 hours after the second injection). This procedure was adopted in accordance with the recommendation of Yamadaet al 18 that animals should be fed to observe enteritis and in order to provide a similar fasting period to that of the protocol for TNBS induced colitis.
INDUCTION OF ENDOTOXIC SHOCK
Fasted rats (n=6) were given an intraperitoneal injection of 1 ml of LPS from Escherichia coli serotype 0127:B8 at a dose of 5 mg/kg dissolved in sterile pyrogen-free, isotonic 0.9% saline. To establish the 24 hour kinetics of plasma leptin concentrations after LPS endotoxic shock, fasted blood samples were obtained at 4, 8, 12, and 24 hours post-treatment. The rats were killed 24 hours post-LPS.
ASSESSMENT OF INFLAMMATION SEVERITY
Macroscopic scoring
For the TNBS induced colitis model, the gross inflammation index was assessed macroscopically according to a previously described scale.17 Each colon was assigned a score on this scale ranging from 0 (normal) to 15 (severe damage) indicative of ulcerations, gross inflammation of the colonic wall, and diarrhoea. For the indomethacin ileitis model, gross inflammatory scores (0–7) were assigned using recently described criteria.19
Myeloperoxidase activity assay
The activity of intestinal MPO, a specific enzyme marker of polymorphonuclear neutrophil primary granules, was measured using the method of Krawisz et al 20 with minor modifications. Briefly, intestinal tissue samples (approximately 50–100 mg) were homogenised on ice using a polytron (13 500 rpm, one minute) in a solution of 0.5% hexadecyltrimethyl ammonium bromide (HTAB) in 50 mM potassium phosphate buffer (HTAB, pH 6.0, 1 ml per 50 mg tissue). The resulting homogenate was subjected to three rapid freezing (−70°C) and thawing (immersion in warm water, 37°C) cycles. The samples were then centrifuged (4000 rpm, 15 minutes, 4°C) to remove insoluble material. The MPO containing supernatant (0.1 ml) was assayed spectrophotometrically after addition of 2.88 ml phosphate buffer (50 mM, pH 6.0) containing 0.167 mg/mlo-dianisidine hydrochloride and 0.0005% hydrogen peroxide. The kinetics of absorbance changes at 470 nm were measured. Sample enzyme activity was calculated with a standard curve of known MPO unit activity. One unit of MPO activity, defined as the quantity of enzyme able to convert 1 μmol of hydrogen peroxide to water in one minute at room temperature, was expressed in units per gram of tissue.
MEASUREMENT OF LEPTIN AND TNF-α IN PLASMA
Plasma leptin concentrations were measured in duplicate using the double antibody radioimmunoassay (RIA) kit (Linco Research, St Charles, Missouri) based on a rat standard. Briefly, this RIA involved the competition of a rat leptin sample with 125I-rat leptin tracer for binding to a specific rabbit antileptin polyclonal antibody. The limit of assay sensitivity was 0.5 ng/ml; the intra-assay variation was less than 7% and the interassay variation less than 9%.
Plasma TNF-α concentrations were determined in duplicate by a commercially available enzyme linked imunosorbent assay (ELISA) kit (rat TNF-α ultrasensitive, Biosource, France). The minimum detectable dose of TNF-α was less than 0.7 pg/ml, and the interassay and intra-assay coefficients of variation were less than 10%.
CHEMICAL PRODUCTS AND DRUGS
The following products were obtained from Sigma (France): picrylsulphonic acid (2,4,6-trinitrobenzene sulphonic acid, TNBS), indomethacin, lipopolysaccharide (LPS) from E coliserotype 0127:B8, hexadecyltrimethylammonium bromide (HTAB), ando-dianisidine hydrochloride.
STATISTICAL ANALYSIS
Statistical analysis was performed using the unpaired Student’st test. A p value of less than 0.05 was considered significant. Results are shown as mean (SEM). Plasma leptin concentrations are expressed as changes over baseline to adjust for differences at baseline. Area under the curve above zero value was calculated for 24 hour kinetics post-TNBS, post-ethanol, and post-saline.
Results
CHANGES IN FOOD INTAKE AND BODY WEIGHT
TNBS treated rats and control rats had similar 24 hour food intakes prior to treatment (29.2 (0.5) g versus 27.9 (0.8) g, respectively). Intracolonic instillation of saline did not reduce food intake relative to pretreatment baseline, whereas TNBS induced colitis was associated with notably suppressed food intake for the first 72 hours (p<0.0001) (fig 1A).

Daily (24 h) food intake (A) and body weight (B) for 13 days after intracolonic administration (arrow) of TNBS or saline in rats. Day 0 represents pretreatment baseline. Values are means (SEM). Significantly different between saline and TNBS, *p<0.05, ***p<0.001, †p<0.0001.
Changes in food intake were paralleled by changes in body weight (fig1B). Rats lost weight within 24 hours after induction of inflammation (p<0.05) and experienced the greatest drop in body weight on days 3 and 4 (p<0.001). Their weights remained 10% lower than controls on all post-treatment days despite ad libitum feeding (p<0.05). Despite possible inaccuracy of fat pad weighings and possible variations due to small heterozygous differences in body fat content, colitis resulted in a 25% decrease in perirenal fat content on day 6 (p<0.05). On day 15, perirenal and epidydimal fat content weighed approximately 25% (p<0.05) and 29% (p<0.05) less than their respective controls.
ASSESSMENT OF TNBS INDUCED COLITIS AND ACUTE ULCERATIVE ILEITIS
Table 1 shows the severity of colitis assessed macroscopically and by measurement of MPO activity on days 2, 6, and 15. In colitic rats, a severely inflamed dilated segment of the distal colon adherent to adjacent organs was revealed at laparotomy on days 2 and 6. On day 15, inflammation as well as dilatation of the diseased segment had decreased, whereas adherence to adjacent organs persisted.
Morphology and myeloperoxidase activity (MPO) of colonic tissue at three time points after intracolonic administration of TNBS (80 mg/kg), ethanol (40%), or saline
When the colonic lumen of TNBS rats was opened on days 2 and 6, a severely inflamed red oedematous mucosa was noted, with ulcerations often involving the entire circumference of the bowel. Deep ulcers, extending randomly from the injection site up to the ileocaecal junction, were surrounded by thickened inflamed tissue (up to 5–6 cm for rats killed on day 2 and to 3–4 cm for rats killed on day 6). On day 15, the affected colon appeared to be thickened, with two sites of hyperaemia that were less dilated and showed healing of the mucosal ulcers. Rats receiving only 40% ethanol, which were killed one day after colonic instillation, showed extensive (approximately 2 cm) haemorrhagic necrosis of the colonic mucosa without ulceration. Transmural MPO activity was increased approximately 26-fold over that of uninflamed controls, even though tissue was assayed only 24 hours after TNBS treatment (table 1).
Indomethacin produced numerous white palpable nodules on the serosal side of the ileum as well as dilated, adherent, and hyperaemic areas in the mid part of the small intestine. Adhesions between adjacent intestinal loops were observed, as well as mesentery and epididymal adipose fat pads and mesentery bleeding. When the intestinal lumen was opened longitudinally, it was found that indomethacin had invariably produced multiple deep longitudinal ulcers with many round lesions. These ulcers involved the entire circumference of the bowel wall throughout the length of the ileum, extending up to 15–35 cm. The mean gross inflammation index was increased to 5.7 (0.3) (p<0.0001), and ileal MPO activity showed a fourfold increase compared with control values for rats receiving saline (5.4 (0.4) versus 1.3 (0.5) U/g tissue, p<0.0001).
PLASMA LEPTIN CONCENTRATIONS
Before induction of inflammation, plasma leptin concentration was 5.01 (0.43) ng/ml in ad libitum fed rats (n=16) and 1.45 (0.09) ng/ml in rats deprived of food for 11 hours (n=47). After a 35 hour fasting period, leptin concentrations fell to 0.53 (0.04) ng/ml in control rats receiving saline (n=6). Figure 2 shows the changes in leptin concentrations during the time course of TNBS induced colitis. Compared with controls receiving saline, these concentrations increased approximately fourfold and threefold respectively, eight and 12 hours after induction of colitis (fig 2A). In ethanol treated rats, this increase was lower (approximately twofold eight hours post-ethanol compared with control rats receiving saline, p<0.005), and non-existent at 24 hours post-ethanol, whereas it persisted in rats with TNBS induced colitis (fig 2A). Furthermore, there was a highly significant correlation of plasma leptin areas under the curve throughout the first day for post-saline, post-ethanol, and post-TNBS with respect to MPO activity (r=0.84, p<0.0001, n=17; fig3) and macroscopic scores (r=0.95, p<0.0001, n=17). Early intestinal inflammation also increased plasma leptin concentrations in indomethacin induced acute ileitis (fig 4). Injection of endotoxin increased these concentrations, which peaked at 12 hours and dropped after 24 hours (fig 5). Although MPO activity of TNBS treated rats was still high on day 6 (table 1), plasma leptin concentrations were significantly reduced on day 5 compared with those of control rats receiving saline (fig 2B). On day 15, leptin concentrations and MPO activity were not significantly different from those of saline receiving controls (fig 2C).
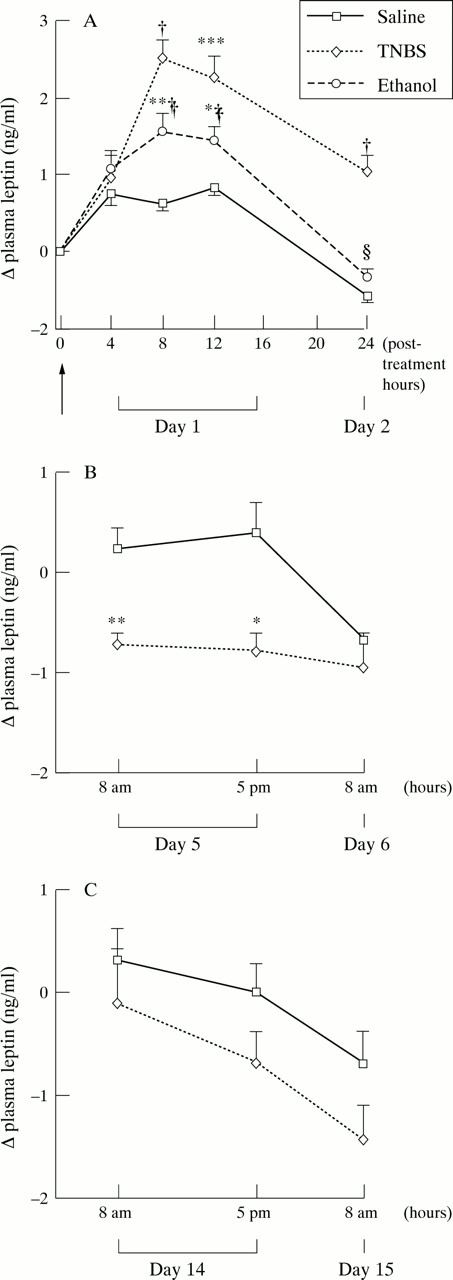
Changes in plasma leptin concentrations after intracolonic administration (arrow) of TNBS, ethanol, or saline in rats on days 1 and 2 (A), days 5 and 6 (B), and days 14 and 15 (C). Values are means (SEM). Significantly different from saline: *p<0.05, **p<0.01, ***p<0.001, †p<0.0001. Significantly different from TNBS, ‡p<0.05, §p<0.001.
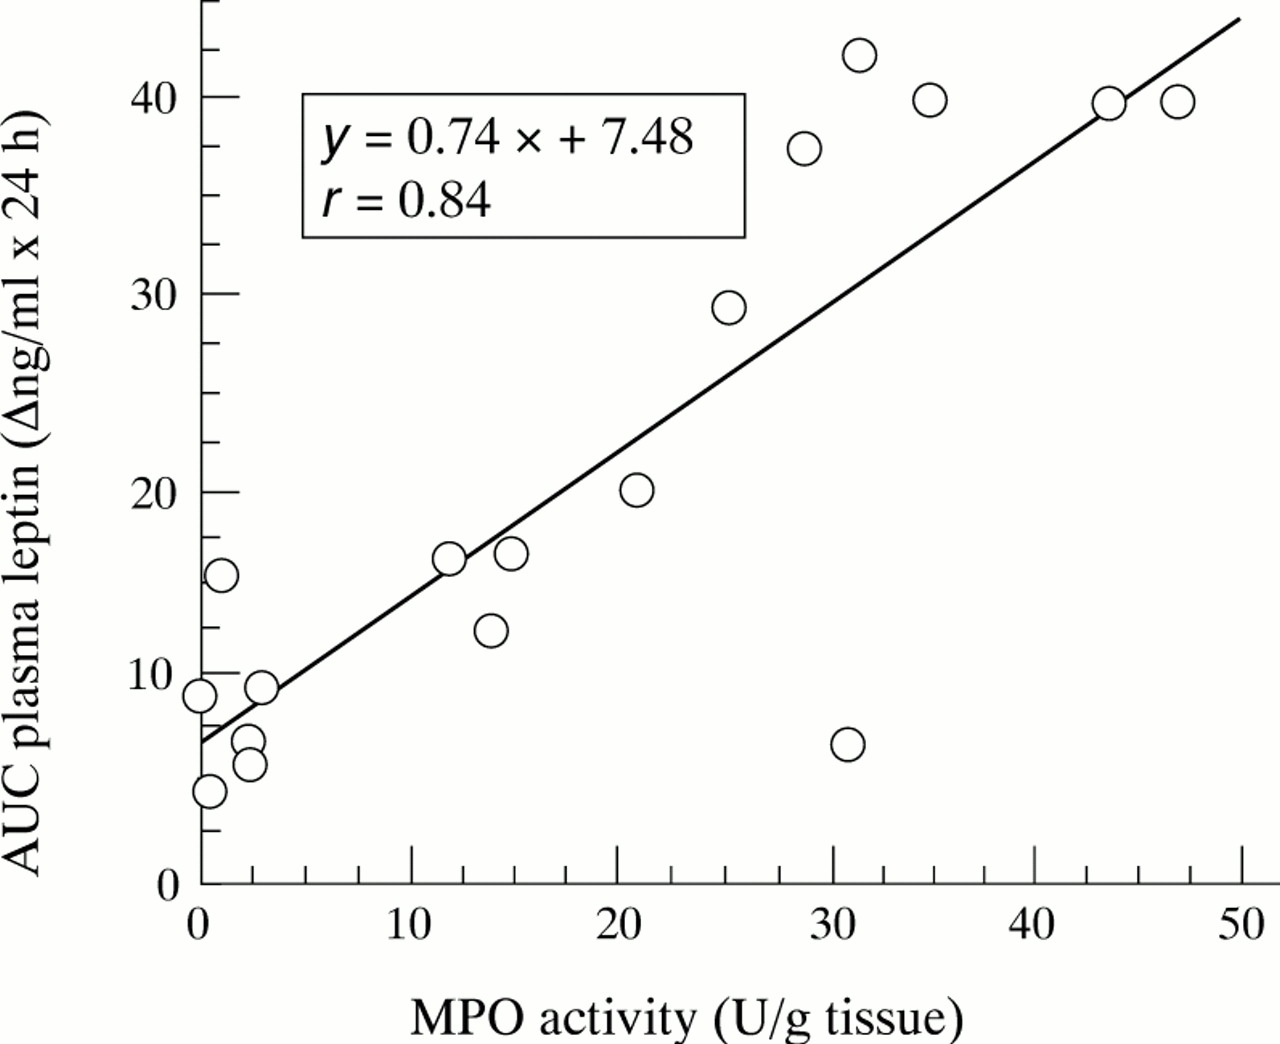
Correlation of areas under the curve (AUC) of changes in plasma leptin concentrations throughout the first day post-TNBS, post-ethanol, and post-saline with MPO activity measured at 24 hours post-treatment. Each point represents the value of one rat (n=17), p<0.0001.
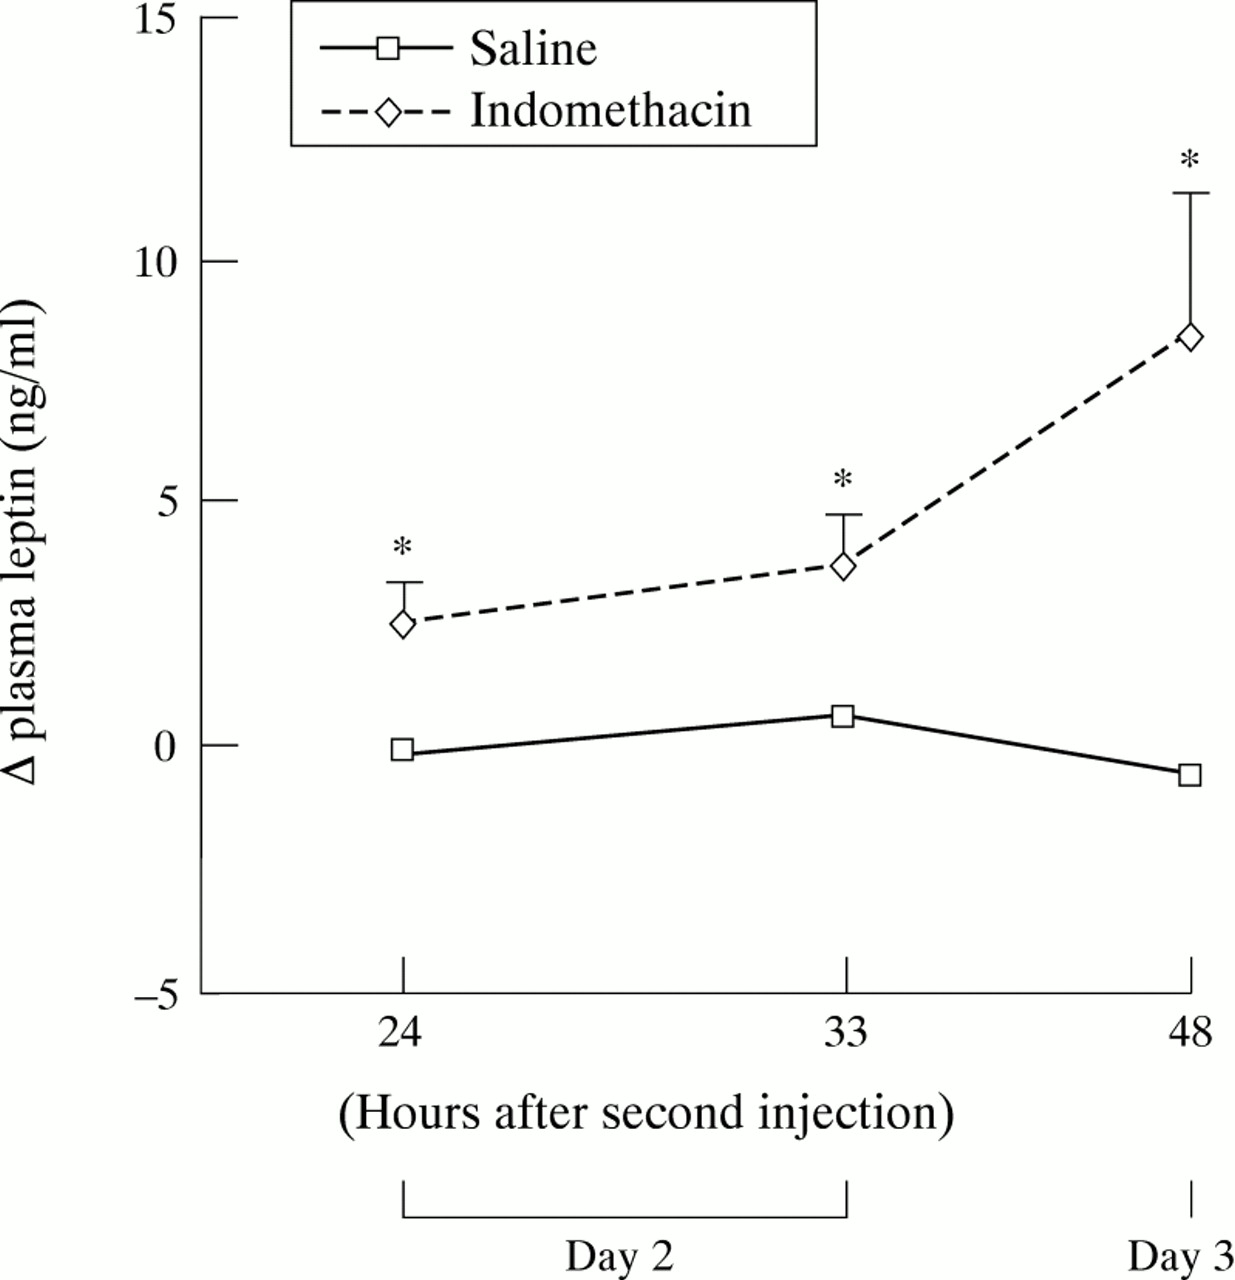
Changes in plasma leptin concentrations on days 2 and 3 in the indomethacin induced ileitis model. All rats were subcutaneously injected with indomethacin (n=7) or saline (n=6) daily at 24 hour intervals, the second injection representing day 1. Values are means (SEM). *Significantly different from saline, p<0.05.

Changes in plasma leptin concentrations on the first day after intraperitoneal administration of lipopolysaccharide (n=6) or saline (n=6) in rats. Values are means (SEM). Significantly different from saline, *p<0.05, **p<0.01, †p<0.001.
PLASMA TNF-α CONCENTRATIONS
Before induction of inflammation, TNF-α was either detected in plasma at low concentrations (11.5 (1.5) pg/ml, n=12), or undetectable (n=35). At eight hours post-LPS, plasma TNF-α concentrations were significantly increased (59.3 (4.4) pg/ml, n=6, p<0.0001), whereas no detectable rise was noted in plasma TNF-α eight hours post-TNBS nor on day 2 for the indomethacin induced ileitis model.
Discussion
This study investigated plasma leptin concentrations during the different stages of established experimental models of intestinal inflammation and determined, in particular, that overexpression was correlated with the degree of inflammation and associated with anorexia during the early stage of TNBS induced colitis in rats. A similar overexpression was observed in acute indomethacin induced ulcerative ileitis and in rats with endotoxic shock. Overexpression was transient, disappearing five days after TNBS treatment despite the persistence of high colitis scores.
While previous studies have shown an increase in plasma leptin concentrations following intraperitoneal injection of cytokine or endotoxin in animals,13 ,14 the present study provides the first direct evidence of such an increase in animal models of inflammation. The correlation between increased leptin concentrations and early inflammation should be discussed first. As previously reported,17 ,18 ,21 induction of intestinal inflammation in rats led to significant increases in macroscopic scores and MPO activity during the first five days for TNBS induced colitis and on day 2 for indomethacin induced ileitis. As reported elsewhere,22 ,23 ethanol alone initiated a transient inflammatory response which was less notable than after TNBS treatment. In these models of inflammation, a significant increase in plasma leptin occurred during the first day of inflammation. At eight and 12 hours post-TNBS, despite fasting, intestinal inflammation was associated with plasma leptin concentrations approaching those recorded in ad libitum fed rats. Ethanol alone also increased plasma leptin concentrations, but to a lesser degree than TNBS. Furthermore, a significant correlation of plasma leptin response with MPO activity and macroscopic scores was found throughout the first post-treatment day, suggesting that leptin release depends on the extent of intestinal inflammation. The disappearance of leptin overexpression 24 hours post-ethanol, as opposed to its persistence 24 hours post-TNBS despite a 35 hour fasting period, lends support to this hypothesis. This overexpression was not restricted to TNBS induced colitis as elevated plasma leptin concentrations were also observed after acute indomethacin induced ulcerative ileitis and after intraperitoneal injection of a high dose of LPS. Previous reports showed leptin overexpression after LPS injection in hamsters and mice,13 ,14 although the kinetics of plasma leptin release were not studied. In the current study, plasma leptin was only elevated during the early inflammatory response. Similarly, in cancer patients treated with IL-1α, plasma leptin concentrations increased, showing a correlation with IL-1α dose within 24 hours, before returning to pretreatment concentrations by day 5 of therapy despite continuous administration of IL-1α.15 Likewise, Zumbach et al,16 who studied the effect of repeated TNF infusion on leptin in patients with solid tumours, noted that plasma concentrations increased 12 hours after infusion but returned to baseline within 24 hours.
On the contrary, plasma leptin concentrations were reduced on day 5 of TNBS induced colitis. There may be several reasons for this secondary underexpression. Firstly, rats with TNBS induced colitis weighed 10% less than their controls and had a reduction in adipose tissue mass which might have diminished plasma leptin concentrations. Secondly, as TNBS rats had severely reduced their food intake during the four preceding days, they had thus been subjected to a longer fasting period than their healthy counterparts. The fact that ob gene expression is augmented after food intake and reduced after fasting may partly explain the leptin underexpression observed in these rats. This is concordant with the large drop in plasma leptin concentrations observed despite mild body weight loss reported in non-obese humans subjected to three days of fasting24 or in obese subjects on a low calorie diet.25
Leptin overexpression observed early in the course of intestinal inflammation may contribute to anorexia and loss of weight. Anorexia induced by TNBS was accompanied by a significant decrease in body weight, as in previous observations.21 Suppression of feeding and loss of weight are not restricted to TNBS induced colitis as previous studies have shown similar effects after indomethacin induced ileitis18 ,19 or LPS injection under various conditions.26 These findings indicate that the development of anorexia is not specific to the stimulus used to induce colitis and that anorexia occurs as a result of the inflammation. In addition, it is also possible that leptin underexpression on day 5 of TNBS induced colitis may have stimulated energy intake in order to reinitiate weight gain after body weight loss as a feedback response of the organism. Actually, food intake was restored by day 5 of inflammation, and rats began to regain weight on day 6.
The mechanism of the induction of leptin secretion in intestinal inflammation remains unknown. On the basis of studies by Grunfeldet al 13 and Sarraf et al,14 which show that IL-1 and TNF-α increased plasma leptin concentrations, it is tempting to suppose that these proinflammatory cytokines secreted during intestinal inflammation could cause leptin overexpression. Both tissue and circulating cytokines could contribute to overexpression. Rachmilewitz et al,23 and more recently Tateishi et al,27 have reported that several cytokines (IL-1α, IL-1β, IL-6, TNF-α) became rapidly elevated in damaged colonic tissue of TNBS treated rats. Furthermore, the acute release of these proinflammatory cytokines might be induced in peripheral blood by endotoxins whose concentration is maximal in the early stage of TNBS induced colitis.28 Yet, though there is clear evidence of simultaneous upregulation of IL-1, IL-6, and TNF-α in intestinal inflammation, the potential role of individual cytokines in modifying leptin release or any other in vivo response remains unclear. Mantzoroset al 29 found a positive association between circulating leptin concentrations and soluble TNF-α receptor, which has been validated as a sensitive indicator of activation of the TNF-α system, in diabetics and healthy subjects.
An attempt was made in the present study to assay circulating TNF-α in the different models of intestinal inflammation. Except in rats with endotoxic shock, elevated plasma TNF-α was not detected during intestinal inflammation. This is consistent with the recent results of Ameho et al 30 who also failed to detect changes in systemic TNF-α in TNBS induced colitis. Nevertheless, these results do not mean that this cytokine was not produced. Our failure to detect systemic TNF-α may have been due to its low production rate, short half life, and rapid clearance from plasma, or to its mode of action (autocrine or paracrine). Many acute inflammations show local paracrine production of IL-1 and TNF-α but very low concentrations in the systemic circulation.31 For instance, Neilly et al 28 found an increase in plasma IL-6 concentration but no significant increase in TNF concentration in TNBS treated rats. However, these authors did not exclude TNF as a major mediator in the inflammatory process and suggested that its effects are short lived. Similarly, Tateishiet al 27 obtained the same results in TNBS treated rats which experienced an increase in plasma IL-6 concentration in the early stage of the disease, whereas other cytokines (IL-1α, IL-1β, and TNF-α) could not be detected in the blood at any time point.
The mechanism of the induction of leptin secretion by cytokines is unknown, although two pathways seem likely. Firstly, cytokines could act directly on fat cells to stimulate leptin secretion. In a recent study, Kirchgessner et al 32 reported evidence in vitro and in vivo that leptin secretion is regulated by TNF-α post-translationally, which indicates that TNF-α can act directly on adipocytes to regulate the release of a preformed leptin pool by a secretagogue-like mechanism. Similarly, Granowitz33 found that treatment of 3T3-L1 adipocytes with IL-1β, IL-6, or TNF-α resulted in a decrease in ob mRNA, whereas treatment with the anti-inflammatory cytokine TGF-β increased steady state concentrations of ob mRNA. Unfortunately, the effects of these cytokines on leptin secretion in culture media were not measured. Secondly, leptin concentrations could be increased by secondary effects of inflammatory mediators. Peripherally generated inflammatory mediators and cytokines activate the hypothalamic-pituitary-adrenal axis, leading to an increase in circulating glucocorticosteroids which could then directly stimulate ob gene expression and plasma leptin concentrations.34 ,35
The relevance of our findings to the interpretation of human diseases may be important. Indeed, different preliminary studies reported elevated,36 unchanged,37 or decreased38 leptin concentrations in patients with IBD. Some of these discrepancies probably reflect the difficulty inherent in analysing results from patient populations that are heterogeneous with regard to body mass index, degree of severity of disease, stage of the disease process, or treatment regimens (such as steroids) with a potential for altering leptin expression.34 ,35
In summary, the results presented here show that an elevated plasma leptin concentration, correlated with the degree of inflammation, was induced during experimental intestinal inflammation. Evidence is provided that leptin overexpression occurred early in the disease and then disappeared, which might partly account for the discrepancies in recent results for plasma leptin concentrations in patients with IBD.36-38 Although little is known about the initiating events of human IBD, the inflammatory response in its acute phase shows similarities with models of acute non-specific damage.39Our findings in animal models suggest that plasma leptin concentrations are transiently increased during acute phases of inflammation, which are typified by weight loss, elevated metabolic rate and anorexia.
Acknowledgments
We wish to thank Mr Lecannu for help with the rats. Prof. Krempf and Dr Darmaun are acknowledged for their useful comments on the manuscript.