Article Text

Abstract
Background: Transient elastography (FibroScan) is a new, non-invasive, rapid, and reproducible method allowing evaluation of liver fibrosis by measurement of liver stiffness. In cirrhotic patients, liver stiffness measurements range from 12.5 to 75.5 kPa. However, the clinical relevance of these values is unknown. The aim of this prospective study was to evaluate the accuracy of liver stiffness measurement for the detection of cirrhosis in patients with chronic liver disease.
Methods: A total of 711 patients with chronic liver disease were studied. Aetiologies of chronic liver diseases were hepatitis C virus or hepatitis B virus infection, alcohol, non-alcoholic steatohepatitis, other, or a combination of the above aetiologies. Liver fibrosis was evaluated according to the METAVIR score.
Results: Stiffness was significantly correlated with fibrosis stage (r = 0.73, p<0.0001). Areas under the receiver operating characteristic curve (95% confidence interval) were 0.80 (0.75–0.84) for patients with significant fibrosis (F>2), 0.90 (0.86–0.93) for patients with severe fibrosis (F3), and 0.96 (0.94–0.98) for patients with cirrhosis. Using a cut off value of 17.6 kPa, patients with cirrhosis were detected with a positive predictive value and a negative predictive value (NPV) of 90%. Liver stiffness was significantly correlated with clinical, biological, and morphological parameters of liver disease. With an NPV >90%, the cut off values for the presence of oesophageal varices stage 2/3, cirrhosis Child-Pugh B or C, past history of ascites, hepatocellular carcinoma, and oesophageal bleeding were 27.5, 37.5, 49.1, 53.7, and 62.7 kPa, respectively.
Conclusion: Transient elastography is a promising non-invasive method for detection of cirrhosis in patients with chronic liver disease. Its use for the follow up and management of these patients could be of great interest and should be evaluated further.
- HCV, hepatitis C virus
- HBV, hepatitis B virus
- ROC, receiver operating characteristic
- AUROC, area under the ROC curve
- AST, aspartate aminotransferase
- ALT, alanine aminotransferase
- liver stiffness
- portal hypertension
- fibrosis
- oesophageal varices
- liver biopsy
- hepatocellular carcinoma
- ascites
Statistics from Altmetric.com
- HCV, hepatitis C virus
- HBV, hepatitis B virus
- ROC, receiver operating characteristic
- AUROC, area under the ROC curve
- AST, aspartate aminotransferase
- ALT, alanine aminotransferase
- liver stiffness
- portal hypertension
- fibrosis
- oesophageal varices
- liver biopsy
- hepatocellular carcinoma
- ascites
Progressive hepatic fibrosis with the development of cirrhosis is a feature of almost all chronic liver diseases. Approximately 10–20% of patients with chronic hepatitis C virus infection have cirrhosis at first clinical presentation, and as many 20–30% of those who do not have cirrhosis will eventually develop this condition and its complications within one or more decades.1–3 These complications are liver failure, ascites, variceal bleeding, portal-systemic encephalopathy, and hepatocellular carcinoma.3
Liver biopsy is currently considered the gold standard for assessing hepatic fibrosis. However, it is an invasive and painful procedure,4 with rare but potential life threatening complications,5 limiting its acceptance and repetition in usually asymptomatic patients. In addition, the accuracy of liver biopsy in assessing fibrosis may be questioned because of sampling error and interobserver variability, which may lead to understaging of cirrhosis.6–9 Thus there is a need to develop and validate non-invasive tests that can accurately reflect the full spectrum of hepatic fibrosis, cirrhosis, and its severity in liver diseases.
Transient elastography (FibroScan; Echosens, Paris, France) is a novel, rapid, and non-invasive technique which measures liver stiffness.10 Briefly, this system is equipped with a probe consisting of an ultrasonic transducer mounted on the axis of a vibrator. A vibration of mild amplitude and low frequency is transmitted from the vibrator to the tissue by the transducer itself. This vibration induces an elastic shear wave which propagates through the tissue. In the meantime, pulse-echo ultrasonic acquisitions are performed to follow the propagation of the shear wave and measure its velocity, which is directly related to tissue stiffness (or elastic modulus). The harder the tissue, the faster the shear wave propagates. Recent reports have shown that liver stiffness measurement using FibroScan allowed accurate prediction of hepatic fibrosis in patients with chronic hepatitis C virus infection.11–14 In patients with chronic hepatitis C, we have shown that liver stiffness measurements ranged from 2.4 to 75 kPa, with a median value of 7.4 kPa.14 Based on the stiffness measurement distribution according to fibrosis stage and receiver operating characteristic (ROC) curves, we found that the cut off value for cirrhosis was 12.5 kPa. However, the clinical relevance of theses values (from 12.5 to 75 kPa) in cirrhotic patients is unknown.
The aim of this prospective study was to assess the accuracy of transient elastography for the detection of cirrhosis in clinical practice in a large cohort of consecutive patients with chronic liver disease.
PATIENTS AND METHODS
Patients
Between June 2003 and September 2004, all consecutive patients with chronic liver diseases seen at the Hepatology Unit of Haut-Lévêque Hospital (University Hospital of Bordeaux, Pessac, France) were prospectively included. Determination of the aetiology of chronic liver disease was made using standard diagnostic criteria. Hepatitis C virus (HCV) or hepatitis B virus (HBV) was diagnosed by serological detection of hepatitis C antibodies (with positive serum HCV-RNA by polymerase chain reaction) and hepatitis B surface antigen, respectively. Alcoholic liver disease was diagnosed in those with consumption of at least 40 g of alcohol daily for five years or more. All other diseases were diagnosed as usual. The study protocol conformed to the ethical guidelines of the 1975 Declaration of Helsinki. Patients were enrolled after written informed consent was obtained. All patients consented to the study.
Characteristics of patients
For all patients, the following parameters were determined at the time of the liver stiffness measurement. Clinical parameters included weight, height, past history of ascites or bleeding varices, and hepatocellular carcinoma. Biological parameters included aspartate aminotransferase (AST), alanine aminotransferase (ALT), γ-glutamyl-transpeptidase, total bilirubin, platelet count, prothrombin time, factor V, albumin, and α fetoprotein. Morphological parameters included oesophageal varices (after upper gastrointestinal endoscopy) and ultrasonographic splenomegaly. As ascites is a physical limitation to the technique because elastic waves do not propagate through liquids, patients with ascites were excluded.
Liver stiffness measurement
Details of the technical background and examination procedure have been previously described.11,12 Measurements were performed on the right lobe of the liver through intercostal spaces on patients lying in the dorsal decubitus position with the right arm in maximal abduction. The tip of the probe transducer was covered with coupling gel and placed on the skin, between the rib bones at the level of the right lobe of the liver. The operator, assisted by an ultrasonic time-motion image, located a liver portion of at least 6 cm thick free of large vascular structures. Once the measurement area had been located, the operator pressed the probe button to start an acquisition. Measurement depth was between 25 mm and 65 mm below the skin surface. Measurements which did not had a correct vibration shape or a correct follow up of the vibration propagation were automatically rejected by the software. Up to 10 successful measurements were performed on each patient. Success rate was calculated as the ratio of the number of successful measurements over the total number of acquisitions. The results are expressed in kilopascal (kPa). Median value of the successful measurements was kept as representative of liver stiffness. The whole examination duration was less than five minutes. Only liver stiffness measurements obtained with at least five successful measurements and a success rate of at least 30% were considered reliable.
Liver histology and quantification of liver fibrosis
For patients who had liver biopsy at the time of the liver stiffness measurement (usual indications for liver biopsy), liver biopsy was fixed in formalin and paraffin embedded. Liver stiffness measurements were performed just before liver biopsy. All biopsy specimens were analysed independently by an experienced pathologist blinded to the clinical data and the results of the liver stiffness measurements.
Liver biopsies that contained less than 10 portal tracts (except for cirrhosis) were excluded from the histological analysis. The length of each liver biopsy specimen was also established (in millimetres). Fibrosis was staged according to the METAVIR scoring system as follows: no or mild fibrosis (no fibrosis or portal fibrosis without septa, F0F1), moderate fibrosis (portal fibrosis and few septa, F2), severe fibrosis (numerous septa without cirrhosis, F3), and cirrhosis F4.15
Statistical analysis
The Kruskal-Wallis non-parametric analysis of variance was used to compare liver stiffness among the different METAVIR fibrosis stages. For fibrosis and complications of cirrhosis, the diagnostic performance of liver stiffness measurement was assessed using ROC curves. A subject was assessed as positive or negative according to whether the non-invasive marker value was greater than, less than, or equal to a given cut off value. Associated with any cut off value was the probability of a true positive (sensitivity) and the probability of a true negative (specificity). The ROC curve is a plot of sensitivity versus 1−specificity for all possible cut off values. The most commonly used index of accuracy is area under the ROC curve (AUROC), values close to 1.0 indicating high diagnostic accuracy. ROC curves were thus constructed for detection of patients with METAVIR fibrosis stage 2 or more (F⩾2), METAVIR fibrosis stage of 3 or more (F⩾3), and cirrhosis (F = 4).
Spearman coefficients of correlation and their associated probability (p) were used to evaluate the relationship between parameters. As some data were missing for some patients, the number of patients (n) included in the calculation of each correlation coefficient was specified.
Optimal cut off values for liver stiffness were chosen to optimise the predictive value according to the diagnostic question. Statistical analyses were performed with NCSS 2004 software (Statistical Systems, Kayville, Utah, USA).
RESULTS
Patients
A total of 758 patients were enrolled. Forty seven patients (6.2%) were excluded because of unsuccessful liver stiffness measurement, mostly due to overweight (31 patients had less than five valid measurements and 16 had a success rate lower than 30%). Thus 711 patients were analysed. Their characteristics at the time of the FibroScan examination are summarised in table 1. They were 403 males, with a mean age of 52 (13) years. Aetiologies of chronic liver diseases were: HCV (n = 398) or HBV infection (n = 43), alcoholic liver disease (n = 89), HCV infection and alcoholic liver disease (n = 26), HCV and human immunodeficiency virus infection (n = 24), non-alcoholic steatohepatitis (n = 26), haemochromatosis (n = 17), cholestatic liver disease (n = 13), and other (n = 75).
Characteristics of patients at the time of the FibroScan examination
A total of 354 patients (49.8%) had undergone liver biopsy at the time of the liver stiffness measurement. Fibrosis stage distribution was as follows: 111 patients (31.4%) had no or mild fibrosis (F0F1), 99 patients (28.0%) had moderate fibrosis (F2), 49 patients (13.8%) had severe fibrosis (F3), and 95 patients (26.8%) had cirrhosis (F4). Median biopsy length was 16.5 mm.
For cirrhotic patients, Child-Pugh score was A in 70 (73.7%) cases, B in 15 cases (15.8%), and C in 10 (10.5%) cases.
Relationship between liver stiffness and histological parameters
Liver stiffness measurements ranged from 2.4 to 75.4 kPa (median 6.8). Mean number of measurements per patient was 12.6 (4.1) (range 7–33). A total of 696 of 711 patients had 10 valid measurements. The other patients had 5–9 valid measurements. Therefore, the success rate was 84.7 (18.3)% (range 30–100%).
Figure 1 shows box plots of liver stiffness for each fibrosis stage. For patients with severe fibrosis (F3 and F4), median liver stiffness was 18.7 kPa (range 3.3–75.4). For patients with cirrhosis, median liver stiffness was 31.1 kPa (range 5.5–75.4). Liver stiffness was significantly different between patients according to their fibrosis stage (p<0.001) and significantly correlated with fibrosis stage (r = 0.73, p<0.0001).

Liver stiffness values for each fibrosis stage (0–4). The vertical axis is a logarithmic scale. The top and bottom of the boxes are the first and third quartiles. The length of the box represents interquartile ranges, within which are located 50% of the values. The lines through the middle of the boxes represent median values.
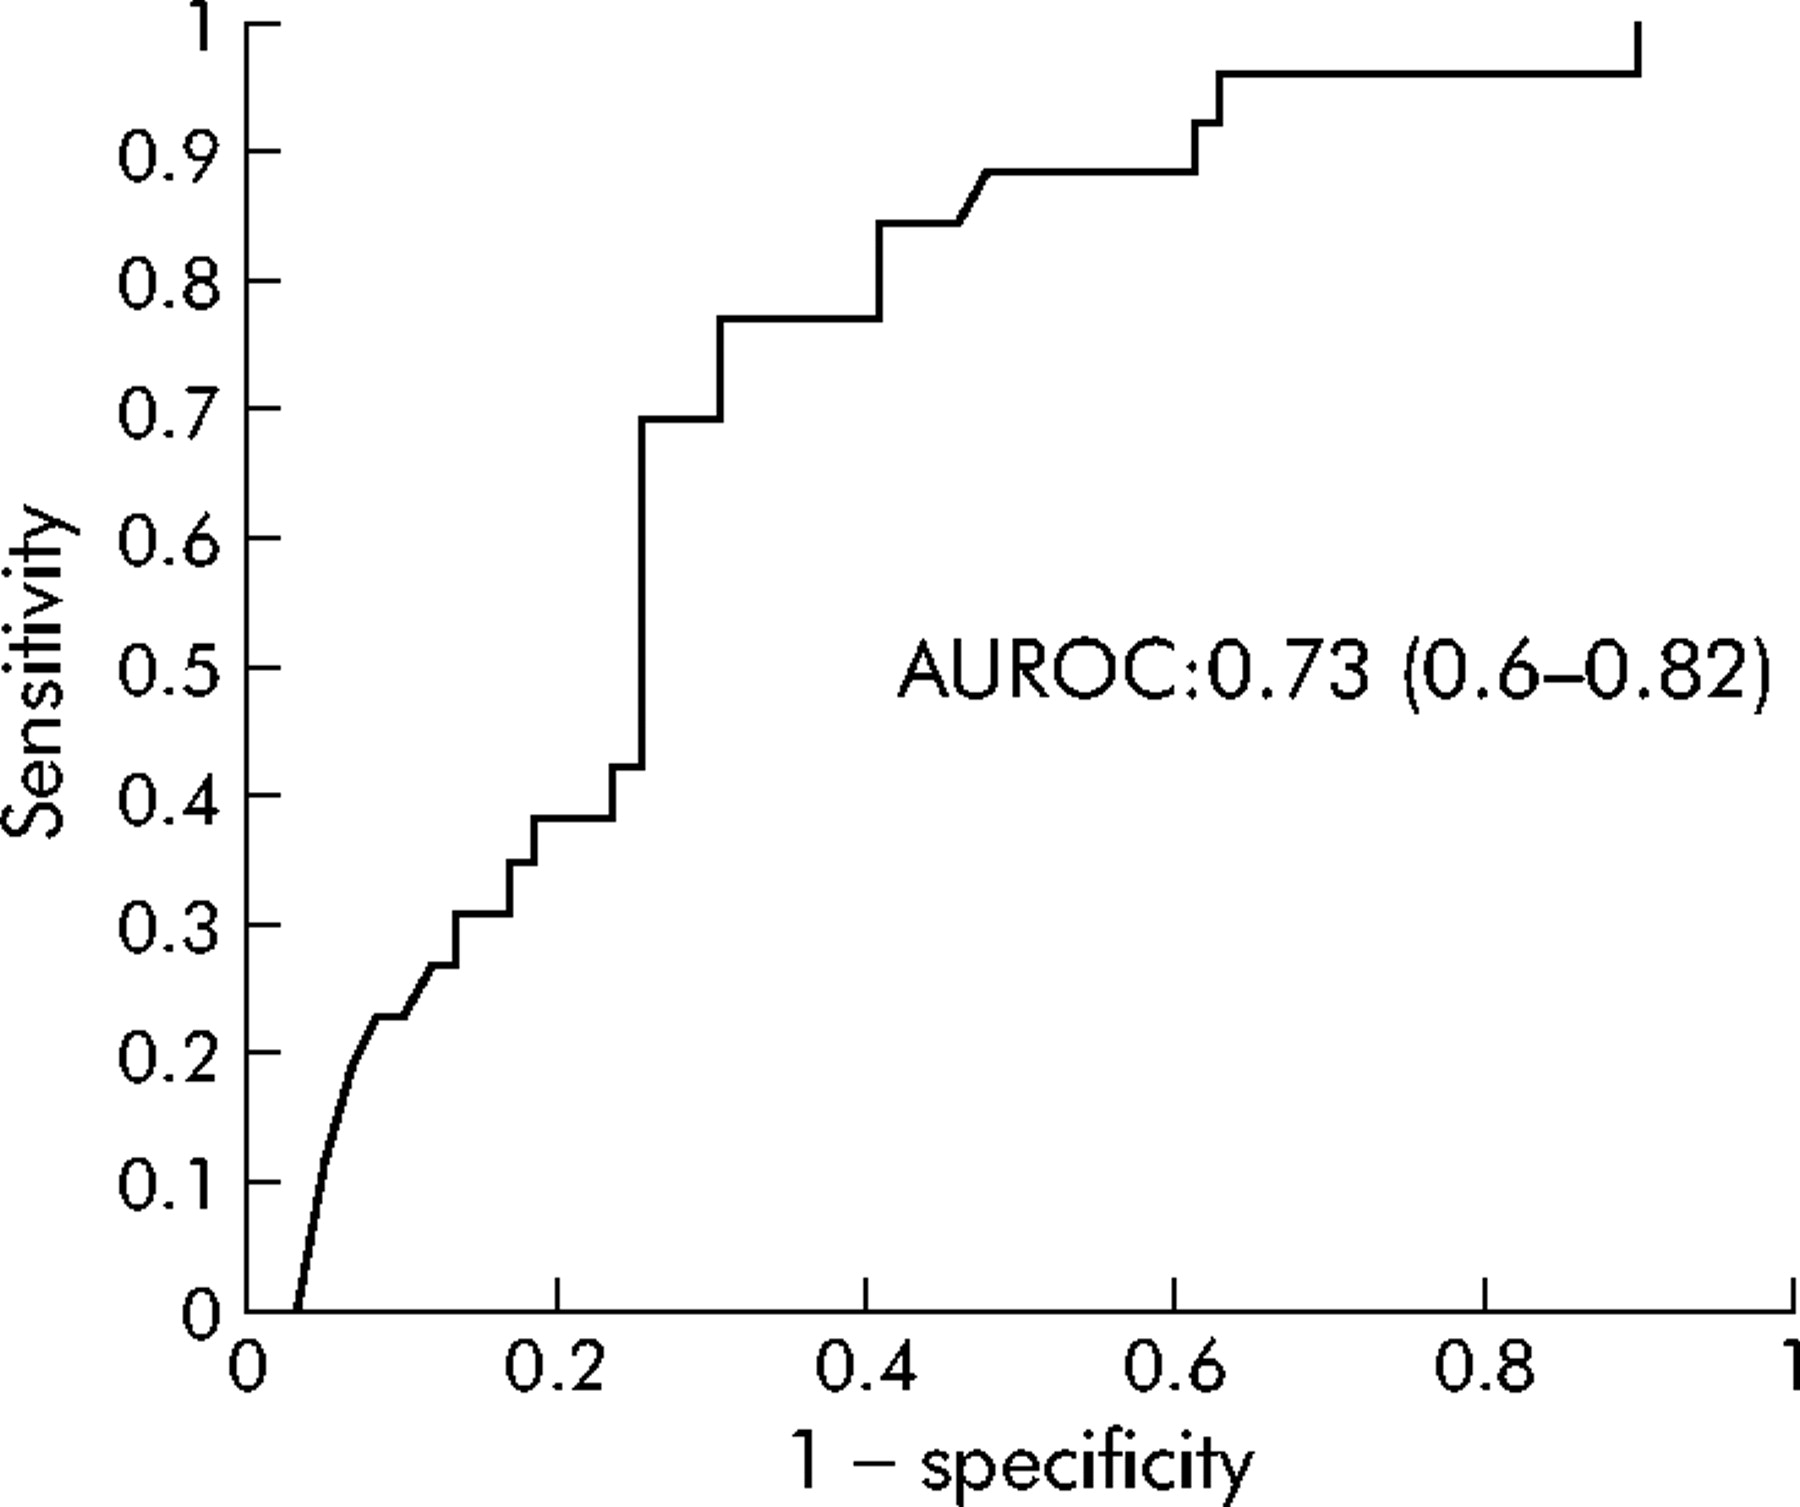
Figure 2 shows the diagnostic value (ROC curves) of liver stiffness measurement for different degrees of fibrosis: moderate fibrosis or more (F⩾F2), severe fibrosis or more (F⩾F3), and cirrhosis (F = 4). Corresponding AUROC values (95% confidence interval) were 0.80 (0.75–0.84) for F⩾F2, 0.90 (0.86–0.93) for F⩾F3, and 0.96 (0.94–0.98) for F = 4. Based on the stiffness measurement distribution according to fibrosis stage and ROC curves, the best discriminant cut off levels were determined (positive predictive value of at least 90%). These cut off levels were 7.2 kPa for moderate fibrosis or more, 12.5 kPa for severe fibrosis or more, and 17.6 kPa for cirrhosis (table 2). Twenty of 95 cirrhotic patients (21%) had liver stiffness measurements less than 17.6 kPa. For patients with viral and alcohol related cirrhosis, median liver stiffness values were 23 kPa and 52.4 kPa, respectively (p<0.001).
Cut off values of liver stiffness according to fibrosis stage for a positive predictive value of at least 90%

Receiver operator characteristic (ROC) curves for liver stiffness measurements for different fibrosis thresholds: moderate fibrosis or more (F⩾F2), severe fibrosis or more (F⩾F3), and cirrhosis (F = 4).
Correlation between elastography measurement and parameters of severity of cirrhosis
For all patients as well as for the subgroup of F3F4 patients, as indicated in table 3, liver stiffness was significantly (p<0.05) correlated with clinical parameters (past history of bleeding varices, hepatocellular carcinoma, or ascites), biological parameters (platelet count, prothrombin time, factor V, albumin, and total bilirubin) and morphological parameters (oesophageal varices stage 2/3, ultrasonographic splenomegaly). In cirrhotic patients, liver stiffness was significantly (p<0.0001) correlated with Child-Pugh score (r = 0.517).
Correlations between transient elastography and biochemical, clinical, and ultrasonographic features
Diagnosis accuracy of liver stiffness measurement in clinical practice
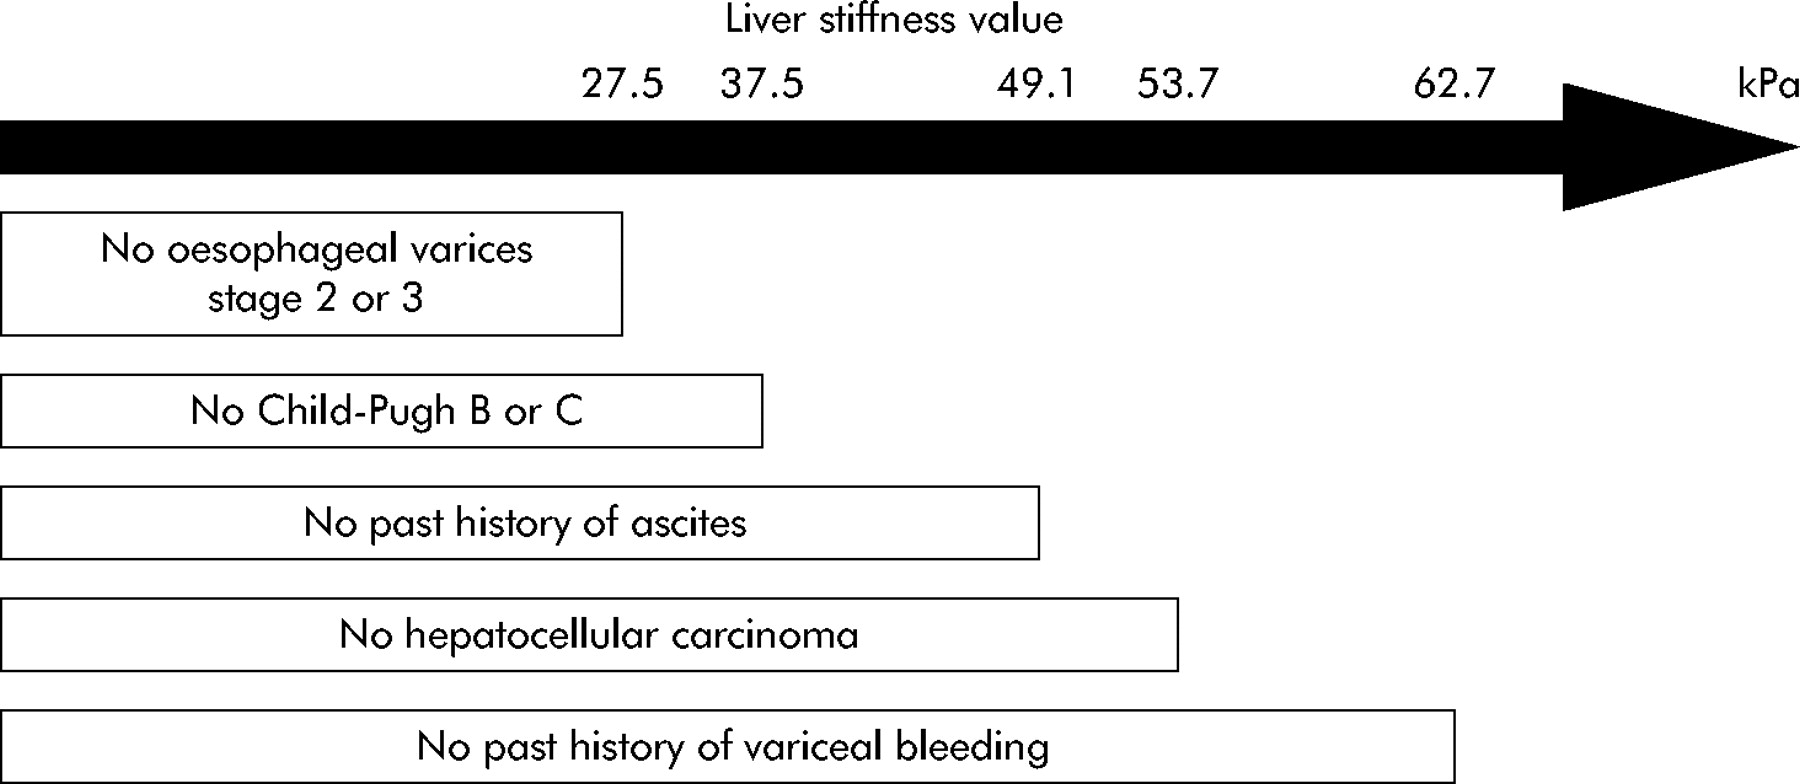
For patients with severe fibrosis or more (F⩾F3), AUROC values for the performances of the liver stiffness measurements in detecting complications of cirrhosis are given in table 4. With a negative predictive value >90%, the cut off for the presence of oesophageal varices stage 2/3 was 27.5 kPa, for cirrhosis Child BC 37.5 kPa, for a past history of ascites 49.1 kPa, for hepatocellular carcinoma 53.7 kPa, and for oesophageal bleeding 62.7 kPa (fig 3). According to these negative predictive values, the usefulness of the liver stiffness measurements with FibroScan in clinical practice is indicated in fig 4.
Diagnostic accuracy of liver stiffness for complications of cirrhosis (144 patients with F3F4 fibrosis)

Receiver operator characteristic (ROC) curves for liver stiffness measurement for the detection of oesophageal varices of grade 2 or 3 (n = 85).

Usefulness of liver stiffness measurement with FibroScan in clinical practice.
DISCUSSION
The results of the present study conducted prospectively in a large cohort of patients with chronic liver disease showed that transient elastography is an efficient technique for the diagnosis of cirrhosis and its severity. With a cut off value of 17.6 kPa, negative and positive predictive values for the diagnosis of cirrhosis were 92% and 91%, respectively. We established the cut off value for complications of cirrhosis, with a negative predictive value of more than 90%. These cut off values were 27.5 kPa for the presence of oesophageal varices stage 2/3, 37.5 kPa for cirrhosis Child BC, 49.1 kPa for a past history of ascites, 53.7 kPa for hepatocellular carcinoma, and 62.7 kPa for oesophageal bleeding. In clinical practice, such results could be of major relevance for follow up of patients with severe fibrosis or cirrhosis.
In the present study, cut off values for the diagnosis of fibrosis were slightly different from those previously published.13,14 In published studies, for a diagnosis of fibrosis ⩾F2, cut off values ranged from 7.1 to 8.8 kPa.13,14 In our study, this cut off was 7.2 kPa. For the diagnosis of fibrosis ⩾F3, cut off values ranged from 9.5 to 9.6 kPa.13,14 In our study, this cut off was 12.5 kPa. Finally, for the diagnosis of cirrhosis, cut off values ranged from 12.5 to 14.6 kPa.13,14 In our study, the cut off for diagnosis of cirrhosis was 17.6 kPa. These differences could be due to the study population which comprised patients with chronic liver diseases of various aetiologies. In the two previous studies, only patients with chronic HCV infection were included. Secondly, in the two previously published studies, cut off values were chosen to maximise the sum of sensitivity and specificity whereas in this study we chose cut off values to have a positive predictive value of more than 90%, which favours specificity.
Cirrhotic patients with alcoholic liver disease had higher liver stiffness values than cirrhotic patients with chronic hepatitis C. Indeed, patients with chronic hepatitis C are diagnosed at an early stage than alcoholic patients, with a histological diagnosis without clinical complications of cirrhosis. In contrast, patients with alcoholic disease are diagnosed later, when clinical complications of cirrhosis occur.
To our knowledge, this study is also the first to compare liver stiffness measurement and fibrosis stage assessed on liver biopsies in a large population of patients with chronic liver disease of various aetiologies. The diagnostic performances for F⩾F2, F⩾F3, and F = F4 obtained in these different aetiological populations were similar to those obtained in previously published studies conducted only in HCV patients.13,14 In our study, the proportion of patients with advanced fibrosis stages (F⩾3) was higher than in the general population so diagnosis performance might be lower in the general population. However, these results indicate that liver stiffness measurement could be used to evaluate liver fibrosis in chronic liver diseases, whatever the aetiology. A liver biopsy was not performed in all patients. However, no statistically significant difference was observed between the characteristics of patients with or without liver biopsy.
Needle liver biopsy has been used as the “gold standard” for assessment of liver fibrosis. Usually, the diagnosis of cirrhosis is based on a biopsy specimen that only represents 1/50 000 of the total liver mass.5 Furthermore, inter- and intraobserver discrepancies of 10% to 20% in assessing hepatic fibrosis have been reported, which may lead to understaging of cirrhosis.7,15 Therefore, while liver biopsy remains the “gold standard”, both the clinician and researcher should view the results with some reservations and should interpret the findings in the broader clinical context. Although the risks of liver biopsy can be reduced by operator experience and using ultrasound guidance, several known risks of obtaining the tissue, such as pain, bleeding, pneumothorax, haemothorax, bile peritonitis, haemobilia, puncture of the kidney and intestine, infections, anxiety, and even death, do not seem to be entirely avoidable.4,5,16,17
Liver stiffness measurement using FibroScan is reproducible and independent of the operator12 and explores a volume of liver parenchyma which can be approximated to a cylinder of 1 cm in diameter and 4 cm in length. This volume is 100 times larger than the biopsy specimen volume and is thus much more representative of the entire hepatic parenchyma. Correlation of liver stiffness and fibrosis stage is not affected by steatosis or activity grade.13
A variety of indirect markers of cirrhosis have been evaluated, including variables such as the AST/ALT ratio,16,18,19 platelet count,20 prothrombin index,21 APRI,22 and Fibrosure.23 All of these methods have been evaluated in HCV patients. Our study showed that liver stiffness measurement using transient elastography is a new non-invasive method for the diagnosis of cirrhosis in either HCV infected patients or in other patients with chronic liver diseases. With FibroScan, AUROC for the diagnosis of cirrhosis was 0.96. None of the other non-invasive methods provide such an accurate value.
Ultrasonographic or radiological evaluation of the liver to assess fibrosis has been limited to identification of individuals with cirrhosis and its complications. In a study of 243 patients, the diagnosis of cirrhosis could be made by ultrasound with an accuracy of 82–88%.24 However, significant interobserver variability and inability to gather all of the required measurements, due to technical problems, limit the value of ultrasonography. Using pulsed Doppler ultrasonography, Chawla and colleagues showed that there was a significant decrease in portal flow velocity in patients with Child’s C cirrhosis compared with controls and patients with Child’s A and Child’s B cirrhosis.25 With liver stiffness measurements using FibroScan, there is no intra- or interobserver variability and the technique is reproducible.12 With only five successful acquisitions and a 30% success rate, the result of liver stiffness measurements correlated with fibrosis stage.
Cirrhosis places the patient at risk of clinical complications, such as portal hypertension, and variceal rupture is the second cause of death in cirrhosis, justifying early screening for oesophageal varices. The usual means of diagnosing oesophageal varices is upper gastrointestinal endoscopy. However, endoscopy can be considered invasive due to the technique and level of discomfort. Non-invasive methods for diagnosis need to be developed. In a study of cirrhotic patients, diagnosis accuracy of oesophageal varices was 72% with two variables: platelet count and prothrombin index.20 In another study, the positive predictive value of platelet count for the presence of oesophageal varices was 67%.26 In our study, 20 patients did not undergo endoscopy because of refusal or because an endoscopy had been performed 1–2 years before the study. With a negative predictive value of 95%, a liver stiffness measurement of >27.5 kPa was associated with the presence of oesophageal varices stage 2 or 3, independently of the cause of cirrhosis. Thus a prospective study in clinical practice should be done evaluating the relevance of oesophageal varices screening in patients with liver stiffness values of more than 27.5 kPa.
Maharaj et al, by performing three transcutaneous biopsies in the same patients using different entry points, reported that, in proven cirrhotic patients, a histopathological feature of cirrhosis was present in all three biopsy specimens in only 50% of patients.6 Similarly, Abdi and colleagues27 performed several post mortem biopsies and showed that the diagnosis of cirrhosis could be obtained from one biopsy specimen in only 16 of 20 cases. According to Bedossa et al, sampling variation in liver fibrosis is a significant limitation in the assessment of fibrosis with liver biopsy.8 Thus some cirrhotic patients are misclassified as F3 patients. To determine the usefulness of liver stiffness measurements with FibroScan in clinical practice, to include all patients with cirrhosis, even real cirrhotic patients with an incorrect F3 fibrosis at liver biopsy examination, we evaluated the diagnostic accuracy of liver stiffness for complications of cirrhosis in F3F4 patients.
In patients with hepatocellular carcinoma, ultrasonography was performed before FibroScan in order to evaluate liver stiffness in a part of the liver without hepatocellular carcinoma. Therefore, tumour stiffness did not influence the results of FibroScan. In this study, only a small number of patients had hepatocellular carcinoma. Thus the role of FibroScan in assessing the risk of hepatocellular carcinoma needs further investigations. At last, in clinical practice (need for surgery, medical treatments, etc) the risk of cirrhosis decompensation could be excluded in patients with liver stiffness measurements <27 kPa (cut off value for Child A stage).
In conclusion, liver stiffness measurement is a good method for the diagnosis of fibrosis and cirrhosis, irrespective of the cause of liver disease. Values in cirrhotic patients ranged from 17.6 to 75.4 kPa. Liver stiffness measurement may be accurate for assessing the severity of cirrhosis. However, a longitudinal cohort study needs to be performed to predict the complications of cirrhosis using FibroScan so that screening for complications of cirrhosis, and close follow up, could be performed.
REFERENCES
Footnotes
-
Published online first 14 July 2005
-
Conflict of interest: None declared.