Article Text

Abstract
Background: Obesity has been associated with gastro-oesophageal reflux disease (GERD); however, the mechanism by which obesity may cause GERD is unclear.
Aim: To examine the association between oesophageal acid exposure and total body or abdominal anthropometric measures.
Methods: A cross-sectional study of consecutive patients undergoing 24 h pH-metry was conducted. Standardised measurements of body weight and height as well as waist and hip circumference were obtained. The association between several parameters of oesophageal acid exposures and anthropometric measures were examined in univariate and multivariate analyses.
Results: 206 patients (63% women) with a mean age of 51.4 years who were not on acid-suppressing drugs were enrolled. A body mass index (BMI) of >30 kg/m2 (compared with BMI<25 kg/m2) was associated with a significant increase in acid reflux episodes, long reflux episodes (>5 min), time with pH<4, and a calculated summary score. These significant associations have affected total, postprandial, upright and supine pH measurements. Waist circumference was also associated with oesophageal acid exposure, but was not as significant or consistent as BMI. When adjusted for waist circumference by including it in the same model, the association between BMI>30 kg/m2 and measures of oesophageal acid exposure became attenuated for all, and not significant for some, thus indicating that waist circumference may mediate a large part of the effect of obesity on oesophageal acid exposure.
Conclusions: Obesity increases the risk of GERD, at least partly, by increasing oesophageal acid exposure. Waist circumference partly explains the association between obesity and oesophageal acid exposure.
- BMI, body mass index
- GERD, gastro-oesophageal reflux disease
- PE, parameter estimate
Statistics from Altmetric.com
Obesity has been associated in several studies with a 1–2-fold increase in the risk of gastro-oesophageal reflux disease (GERD) and its complications, such as erosive oesophagitis and oesophageal adenocarcinoma.1
The mechanism by which obesity promotes GERD remains unclear. We have previously shown that obesity increases the intragastric pressure and gastro-oesophageal pressure gradient.2,3 These changes are hypothesised to increase reflux across the lower oesophageal sphincter with subsequent increased oesophageal exposure to gastroduodenal contents. However, the association between obesity, whether overall or abdominal, and oesophageal acid exposure is not clear.4 Few studies have been conducted in a small number of patients with morbid obesity being evaluated for bariatric surgery and have had conflicting findings.5–9 For example, Fisher et al6 studied 30 patients with morbid obesity and reported a significant association between body mass index (BMI) and oesophageal pH exposure, whereas Lundell et al7 reported no differences in reflux variables between a group of 50 patients with massive obesity referred for gastroplasty operations and 29 age- and sex-matched, symptom-free, healthy controls. Wajed et al9 retrospectively examined 70 patients with symptoms of GERD and found strong correlation between BMI and oesophageal pH measurements. There are no large-scale prospective studies involving people with a wide range of BMI and waist circumference. Therefore we conducted this prospective cross-sectional study to examine the association between oesophageal acid exposure and several anthropometric measures indicating the overall and regional body fat distribution.
METHODS
Study design
We conducted a cross-sectional study of consecutive patients undergoing 24 h pH-metry between January 2004 and May 2005 at the open access Reflux Center and GI Physiology Laboratory, The Methodist Hospital, Houston, Texas, USA. We did not enrol patients who had liposuction in the past 1 year, scleroderma, achalasia, gastric surgery, fundoplication, known gastroparesis and intestinal pseudo-obstruction. Patients on proton-pump inhibitors or H2-receptor antagonists were excluded from the main analyses. We also collected information on age, gender and race.
Anthropometric measurements
On the day of the procedure, body weight (kg) was measured using a well-calibrated weighing scale, and height (cm) was measured using a wall-mounted ruler with the patient standing barefoot. Waist and hip circumference were measured using a hand-held measuring tape. Waist was measured consistently at a level located approximately 5 Pcm above the ileac crest. A trained nurse performed all measurements.
24-h pH measurements
Ambulatory pH monitoring was performed using a single-use, 1.8 mm, monocrystalline pH catheter with two antimony electrodes (Medtronic A/S, Kobenhavn, Denmark) positioned 15 cm apart. The pH electrodes were calibrated at 37°C in pH 7.01 and pH1.07 buffer solutions (Medtronic, Minneapolis, Minnesota, USA) before each study. pH catheters were passed nasally and positioned such that the distal electrode was 5 cm above the manometrically determined lower oesophageal sphincter. The pH electrodes were connected to a portable digital data recorder (Digitrapper MK III, Medtronic) that stored pH data every 4 s for up to 24 h. Patients were instructed to keep a diary recording meal times, time of lying down for sleep and time of waking up, and any symptoms that they experienced. They were instructed to carry out normal daily activities without dietary restrictions and return the following day for the removal of the probe and collection and review of the diary.
The data were downloaded and analysed using PolyNet 4.0 computer software (Medtronic Gastroenterology and Urology, Shoreview, Minnesota, USA). A trained nurse, supervised by an experienced investigator (GAE), carried out all procedures.
The study protocol was reviewed and approved by the Institutional Research Board at Baylor College of Medicine in Houston, Texas, USA.
Statistical analysis
The number of acid reflux episodes, the number of long acid reflux episodes (>5 min) and the time (and percentages of time) when pH was <4 for both pH electrodes were analysed for total, upright, supine and postprandial time periods at the distal probe. These measures were analysed as continuous variables. We also analysed the DeMeester Summary Score, as calculated by the software, as a categorical variable dichotomised at ⩾14.4 signifying the presence of GERD.
Associations between each of the measures of oesophageal acid exposure and several covariates including BMI, waist circumference, weight, age, sex and race were tested. BMI, weight, waist circumference, hip circumference, and waist-to-hip ratio were examined as continuous as well as categorical variables (BMI <25, 25–29.9 and >30 kg/m2, weight and waist circumference as tertiles). Linear regression models were conducted to examine the associations between each covariate of interest (as predictor variables) and the continuous variables (as outcome variables; tables 1 and 2). Multivariable linear regression models were used to adjust for other significant covariates (table 3). Logistic regression models were conducted when the dichotomised DeMeester score was the outcome of interest. All data were analysed with STATA V.8.0 statistical software. Lastly, Pearson’s correlation coefficient was calculated for continuous variables. The main results pertain to the findings of the linear regression models; these are more meaningful tests in this context than correlation coefficients as we are not interested in a bidirectional association (eg, not interested in knowing whether changes in the oesophageal pH measurements result in changes in body weight).
Associations between several anthropometric measurements treated as continuous variables and several parameters of oesophageal acid exposure measured at the distal probe
The associations between body mass index and waist circumference as categorical variables and several parameters of oesophageal acid exposure recorded at the distal probe (n = 204, two outliers excluded)
The association between body mass index as a categorical variable and oesophageal pH adjusting for waist circumference as a continuous variable (n = 204, two outliers excluded)
RESULTS
A total of 325 patients were prospectively enrolled in the study. The primary analyses were conducted on information from 206 patients who were not taking antisecretory drugs at the time of the study. The mean age of these patients was 51.4 years. Of these, 9 (4.4%) were Asians, 24 (11.8%) African-Americans, 144 (70.6%) Caucasians, 26 (12.8%) Hispanics and 3 (1.0%) were of other race/ethnicity. The majority (63%) were women. Table 4 shows the anthropometric measurements of the study patients. All these measurements reflected a wide range of values and were normally distributed. The indications for pH-metry were heartburn (63%), regurgitation (15%), dysphagia (28%), cough (15%), hoarseness (18%) and other miscellaneous indications (8%).
Anthropometric measurements in 206 patients
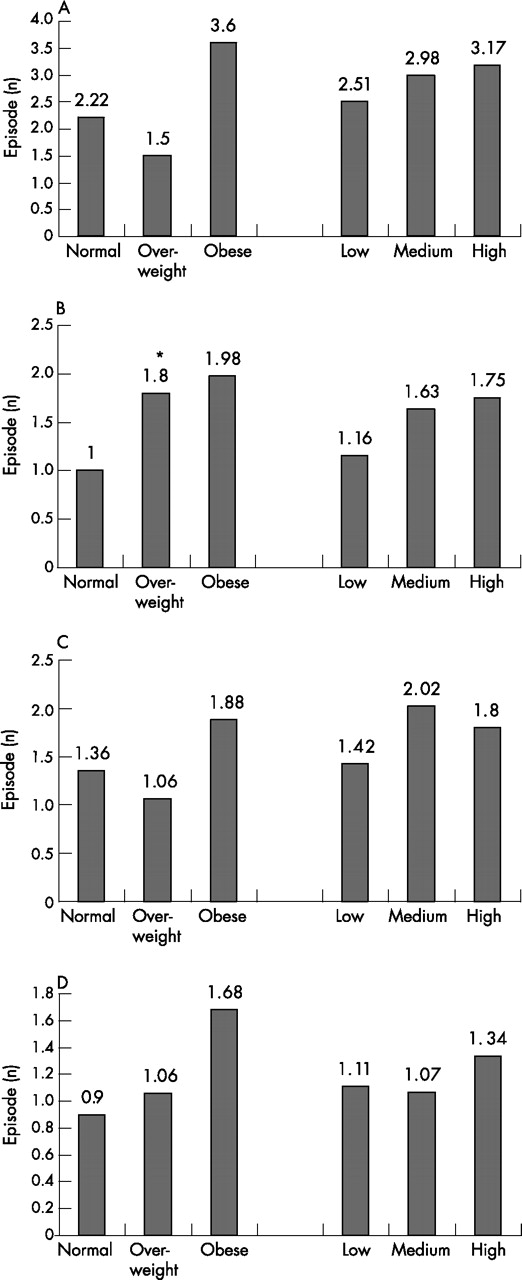
The mean number of acid reflux episodes (total, postprandial, upright and supine) was significantly higher in patients with obesity than those with normal BMI (fig 1A–D). The total number of acid reflux episodes was 48% higher in patients with obesity than those with normal BMI. The number of long reflux episodes was higher in patients with obesity than in those with normal BMI (fig 2 A–D); this increase reached significance only for postprandial episodes (p = 0.04). The time (and % time) with pH <4 was also higher in patients with obesity than in those with normal BMI, and these differences were significant for postprandial measurements (p = 0.03; not shown in the figure). The percentage time with pH<4 was 7.7 (SD 9.4 in patients with obesity as compared with 5.0 (6.0) in patients with normal BMI. Despite a trend of higher oesophageal acid exposure in patients with the highest tertile for waist circumference, these differences were not significant (figs 1 and 2).

The number of reflux episodes shown for groups of patients with different categories of body mass index (normal, overweight, obese) and waist circumference (low, medium, high). (A) Total reflux episodes; (B) postprandial episodes; (C) upright episodes; and (D) supine episodes. *p Value for differences <0.05.

The number of long reflux episodes shown for groups of patients with different categories of body mass index (normal, overweight, obese) and waist circumference (low, medium, high). (A) Total reflux episodes; (B) postprandial episodes; (C) upright episodes; and (D) supine episodes. *p Value for differences <0.0.
There was a significant positive correlation between BMI as a continuous variable and all measures of oesophageal acid exposure. For example, for each whole unit increase in BMI, there were 2.76 more episodes of acid reflux during the postprandial time period (p<0.001). Also during the postprandial time period, for each unit increase in BMI there were 1.89 more min with a pH <4 (p<0.001). In general, the associations were higher for postprandial measurements.
There were also significant associations for weight and waist circumference when examined as continuous variables, especially during the postprandial time period. Table 1 shows the results of unadjusted linear regression models expressed as parameter estimate (PE), SE and p values. PE represents the change in the value of the outcome variable that results from one unit increase in the predictor variable. A PE value larger than the SE is usually associated with a significant p value. For example, there was an increase of 0.81 episode (PE) of acid reflux for a weight increase of 1 kg (predictor variable; p<0.001). Similarly, there were significant associations between several parameters of oesophageal acid exposure and waist circumference. For example, for each centimeter increase in waist circumference, there was an increase of 0.85 (PE) episode of acid reflux (p = 0.002) during the postprandial time period. However, these associations were stronger and more consistent for BMI than for waist circumference or for weight (table 1). These associations were also stronger for readings obtained at the distal probe than those at the proximal probe; for the latter, only the number of reflux episodes was significantly associated with BMI (data not shown). The corresponding Pearson’s correlation coefficient calculations had, as expected, the exact p values as the linear regression analyses. For BMI, the r values ranged from 0.11 to 0.27, with the highest values for total and postprandial reflux episodes being 0.21 and 0.27, respectively. The correlation coefficients for waist circumference ranged from 0.10 to 0.22, with the highest r values for total and postprandial reflux episodes being 0.16 and 0.21, respectively.
To examine dose–response relationship, BMI was examined as a categorical variable, significant associations with all measurements of oesophageal acid exposure were observed only for obesity (BMI>30 kg/m2), but not for overweight (BMI 25–29.9 kg/m2) when compared with normal (BMI<24.9 kg/m2; table 2). For example, during the postprandial time period, obese subjects had 33 more episodes of acid reflux than those with a normal BMI (p = 0.001). Also, during the postprandial time period, patients with obesity had 25.6 more minutes with a pH <4 than those with normal BMI (p = 0.009). On the other hand, when examined as categorical variables (tertiles), there were no significant associations between weight or waist circumference and any of the oesophageal acid exposure measures indicating the absence of a linear dose–response relationship (table 1).
There were no significant associations between age, race and sex and any of the parameters of oesophageal acid exposure. Although there was a trend of higher oesophageal acid exposure in men than in women, the two most significant were the upright episodes of long reflux (p = 0.11) and postprandial percentage time (p = 0.17), females having lower values in each case. Therefore, we did not adjust for these variables in multivariable linear analyses.
A DeMeester score ⩾14.4 indicating the presence of GERD as previously established10 was also analysed. A total of 119 (58.0%) patients had an abnormally high DeMeester score. The proportion of patients with obesity was greater among those with a high DeMeester score than those with a normal score (29.4% vs 17.4%; p = 0.048). Although waist circumference was higher in those with abnormal DeMeester score, the difference from those with normal scores just fell short of significance (p = 0.06). The univariable logistic regression model showed that obesity (BMI>30 kg/m2) was associated with a 2.5-fold increased likelihood of having an abnormal DeMesster score (odds ratio (OR) = 2.53, 95% CI 1.18 to 5.41; p = 0.016) compared with normal BMI. This association was still present when controlling for age and race (OR = 2.91, 95% CI 1.24 to 6.81; p = 0.014). Over-weight versus normal BMI was not significant in both the univariable or multivariable models.
Finally, we wanted to examine the possibility that waist circumference potentially lies in the causative pathway of BMI (rather than a confounder). Therefore, we constructed multivariable linear regression models in which both BMI (as categorical variable) and waist circumference (as a continuous variable) were examined simultaneously in the model. BMI>30 kg/m2 was no longer significantly associated with any indicator of oesophageal acid exposure in these models (table 3). Additionally, when waist circumference (both as a continuous and categorical variable) was included in the multivariable logistic regression model for the DeMeester score analysis, obesity was also no longer significant.
DISCUSSION
This study showed a significant association between obesity and several parameters of increased oesophageal acid exposure. Obesity (BMI>30 kg/m2) was associated with a significant increase in the number of reflux episodes, long reflux episodes, time with pH<4 and percentage time with pH<4, especially in the postprandial period, but almost in each time period. However, when adjusted for waist circumference by including it in the same model, the association between obesity and all measures of oesophageal acid exposure became attenuated. Assuming that waist circumference lies in the causal pathway between obesity and oesophageal acid exposure, the findings of the model suggest that obesity operates to increase the risk of GERD at least partly by increased abdominal obesity.
The study provides strong preliminary evidence for the presence of an association between obesity and oesophageal acid exposure. These findings should be examined and extended by future studies. Oesophageal pH-metry can be subjected to measurement errors related to placement of the probe and instrument calibration. However, all procedures were conducted using a similar technique. Moreover, potential measurement error is likely to be random as there is no reason for a systematic differential error in measuring oesophageal acid based on BMI or waist circumferences. Another limitation is the absence of systematic collection of GERD symptoms or endoscopic examination. Although a prospective cohort design is more powerful than the cross-sectional design used in this study to establish the causal relationship between BMI and oesophageal acid exposure, reverse causality is highly unlikely in this study (increased oesophageal exposure is not likely to cause obesity). As our main aim was to examine the objective evidence for GERD (ie, oesophageal acid exposure) in a representative sample while keeping the respondents’ burden to a minimum, we did not administer structured questionnaires or systematically perform an upper endoscopy. This has limited our ability to examine potentially important factors such as the presence and size of hiatus hernia. Nevertheless, the study had several advantages such as the prospective design including the measurement of weight, height and abdominal circumference, the consecutive enrolment to reduce the impact of selection bias, and the large sample size that allowed us to adequately examine these associations.
The increased oesophageal acid exposure observed in patients with obesity may have been clinically significant. For example, the mean percentage time with pH<4, which is generally regarded as one of the most useful indicators of oesophageal acid exposure, was 7.7%; this value is 47% higher than patients with normal BMI in this study and is also higher than the upper limit recorded for normal controls in several studies (range 3.4–7.2).
The observed positive correlation between BMI and oesophageal acid exposure could be mediated by abdominal obesity, which results in an increased mechanical pressure on the stomach, thus promoting reflux. The particularly strong association with postprandial reflux may indicate diet-related effects. A similar effect has been documented in patients with ascites11,12 and in pregnancy.13–15 Although it has been speculated that these associations are due to changes in intra-abdominal pressure, the data have been conflicting.2,14–18 Haslam et al18 reported the absence of correlation between intragastric pressure and BMI, whereas El-Serag et al2 reported weak but significant correlation. The difficulty in establishing this relationship is probably due to methodological limitations associated with water-perfused manometric techniques.
Recently, a study was conducted using high-resolution manometry methodology to parameterise the pressure morphology and function of the oesophagogastric junction in obesity.3 The results of this study revealed that gastro-oesophageal pressure gradients are altered with obesity in a way that would promote retrograde flow of gastric juice into the oesophagus. Both intragastric pressure and the gastro-oesophageal pressure gradient were strongly correlated with both BMI and waist circumference. When both BMI and waist circumference were analysed simultaneously in a regression model, waist circumference was independently associated with altered pressure gradients, whereas the relationship between BMI and pressure became non-significant or greatly reduced. In addition to abnormal pressure gradients, high-resolution manometry also revealed that obesity was associated with hiatus hernia. There was a significant correlation between BMI and waist circumference and axial separation of the intrinsic lower oesophageal sphincter and crural diaphragm, and it was postulated that this was a manifestation of pressure stress due to increased intragastric pressure. These findings are consistent with our current data analysing the relationship between obesity and ambulatory pH monitoring data, which suggests that waist circumference is the mediator in the causal relationship between obesity and GERD.
The magnitude of associations and correlations between BMI and oesophageal acid exposure were not very large. Some of these associations (eg, differences in DeMeester score) are unlikely to be clinically significant. Thus, obesity may not be a sufficient or necessary causal factor for GERD in most cases. However, even if obesity just increases the probability of a reflux (ie, probabilistic factor), there are serious implications of this finding given the high prevalence of obesity.19–23
The visceral fat component of abdominal obesity has been associated with increased risk of several disorders such as diabetes,24,25 ischaemic heart disease26 and malignancies such as colorectal cancer.27,28 Apart from mechanical pressure, visceral fat is metabolically active,25 and has been strongly associated with serum levels of adipocytokines including interleukin 6 and tumour necrosis factor α, which may play a role in GERD or consequent carcinogenesis. Lastly, the association between abdominal obesity and GERD could explain some of the epidemiological features of Barrett’s oesophagus and oesophageal adenocarcinoma. For example, the distribution of body fat tends to be more visceral than truncal in high-risk groups of patients having Barrett’s oesophagus, Caucasians (compared with African-Americans) and men (compared with women).
In summary, this prospective study of 206 consecutive patients suggests a modest association between obesity and intraoesophageal acid exposure. This association seems to be mediated mostly by waist circumference.
REFERENCES
Footnotes
-
Published Online First 23 November 2006
-
Competing interests: None.