Article Text

Abstract
Objective: Nutrient feedback from the small intestine modulates upper gastrointestinal function and energy intake; however, the molecular mechanism of nutrient detection is unknown. In the tongue, sugars are detected via taste T1R2 and T1R3 receptors and signalled via the taste G-protein α-gustducin (Gαgust) and the transient receptor potential ion channel, TRPM5. These taste molecules are also present in the rodent small intestine, and may regulate gastrointestinal function.
Subjects and methods: Absolute transcript levels for T1R2, T1R3, Gαgust and TRPM5 were quantified in gastrointestinal mucosal biopsies from subjects with and without type 2 diabetes; immunohistochemistry was used to locate Gαgust. Effects of luminal glucose on jejunal expression of taste molecules were also quantified in mice.
Results: T1R2, T1R3, Gαgust and TRPM5 were preferentially expressed in the proximal small intestine in humans, with immunolabelling for Gαgust localised to solitary cells dispersed throughout the duodenal villous epithelium. Expression of T1R2, T1R3, TRPM5 (all p<0.05) and Gαgust (p<0.001) inversely correlated with blood glucose concentration in type 2 diabetes subjects but, as a group, did not differ from control subjects. Transcript levels of T1R2 were reduced by 84% following jejunal glucose perfusion in mice (p<0.05).
Conclusions: Taste molecules are expressed in nutrient detection regions of the proximal small intestine in humans, consistent with a role in “tasting”. This taste molecule expression is decreased in diabetic subjects with elevated blood glucose concentration, and decreased by luminal glucose in mice, indicating that intestinal “taste” signalling is under dynamic metabolic and luminal control.
Statistics from Altmetric.com
Exposure of the small intestine to carbohydrate-containing nutrients generates signals that regulate absorption, slow gastric emptying, suppress appetite and cause sensations such as fullness.1–4 Some aspects of this feedback are mediated through release of gut hormones such as 5-hydroxytryptamine (5-HT) and glucagon-like peptide-1 (GLP-1) (for a review, see Cummings and Overduin5). However, knowledge of the primary molecular mechanism by which the small intestine senses nutrients, including glucose, is limited.
Vagal sensory afferent nerve fibres in the small intestine terminate below the epithelial layer,6 while mediators are released from specialised cells within the epithelium, suggesting that the apical epithelial membrane in contact with the luminal contents is likely to be the site of initial nutrient detection. In a similar anatomical arrangement, specialised epithelial cells in taste buds on the tongue recognise different taste modalities via specific signal mechanisms, resulting in neurotransmitter release and activation of lingual afferent nerves. On the tongue, G-protein-coupled receptors T1R2 and T1R3 form a heterodimer responsive to sweet tastants, while other taste modalities—umami and bitter—are detected by T1R1/T1R3 and T2R receptors, respectively.7–9 Subsequent activation of a common taste-specific G-protein via the alpha subunit, α-gustducin (Gαgust), then initiates a transduction cascade through phospholipase C β2, resulting in release of intracellular Ca2+, leading to gating of the taste transduction channel TRPM5 and depolarisation of the taste cell.10 11
Taste transduction on the tongue and nutrient sensing in the small intestine may share common molecular mechanisms. It is now well established that T1Rs, T2Rs and Gαgust taste molecules are expressed in the gastrointestinal mucosa of rodents,12 13 where Gαgust has been localised to solitary epithelial cells.14 The density of Gαgust cells shows regional specificity in the mouse small intestine,15 with higher numbers of taste cells in the mid-jejunum, where carbohydrate-induced reflexes are likely to be initiated.16 Quantitative molecular approaches have also demonstrated that T1R, T2R and Gαgust are co-expressed within duodenal epithelial cells that express TRPM5 in mice, suggesting that a complete taste transduction cascade may operate within these cells.17
Immunocytochemical studies in the human gastrointestinal tract have recently identified bitter T2R receptors and Gαgust in the colon,18 and taste molecules T1R2, T1R3, Gαgust and TRPM5 in epithelial cells in the duodenum.19 The relative expression of T1Rs, Gαgust and TRPM5 has also been shown throughout the human intestine.17 However, a quantitative regional expression study of taste molecules in the upper gastrointestinal tract in individual subjects has not been undertaken, nor is there any information on whether their expression is altered in diseases that are associated with gastrointestinal sensory and motor dysfunction, such as diabetes. Acute changes in the blood glucose concentration in both healthy subjects and those with type 2 diabetes are also known to affect gut motor function and gastrointestinal symptoms20–24; therefore, the effect of hyperglycaemia on intestinal taste molecule expression would be of interest. These are critical questions, as the region and length of small intestine exposed to carbohydrate are major determinants of nutrient feedback and gut hormone release in humans,25 and may relate directly to taste molecule expression. Finally, the effect of luminal glucose exposure on expression of intestinal taste molecules is unknown. This study therefore aimed to characterise the expression of taste molecules in regions of the human upper gastrointestinal tract, and to evaluate changes in their expression in subjects with type 2 diabetes and in the jejunum of mice following acute glucose perfusion.
METHODS
Human studies were approved by the Human Research Ethics Committee of the Royal Adelaide Hospital, Adelaide, Australia, and each subject gave written, informed consent. Animal studies were performed on adult male C57BL/6 mice aged 7–10 weeks which had free access to water and a standard rodent diet. Mice were fasted overnight (18 h) in wire-bottomed cages prior to experimentation. Animal studies were performed in accordance with the guidelines of the Animal Ethics Committee of the Institute of Medical & Veterinary Science (Adelaide, Australia) and the University of Adelaide.
Collection of human upper gastrointestinal biopsies
Enteroscopy
Six non-diabetic subjects (mean (SE) age 63.7 (6.1) years, body mass index (BMI) 30.5 (2.7) kg/m2) were recruited amongst patients referred to the Endoscopy Unit of the Royal Adelaide Hospital for push enteroscopy, in most cases for the investigation of bleeding of obscure origin. Only patients in whom the small intestinal mucosa was macroscopically and histologically normal were included. Push enteroscopy was performed under conscious sedation with intravenous midazolam and fentanyl, after at least 8 h fasting. The enteroscope was passed as far distally in the jejunum as possible (mean straightened depth 167 (25) cm from the incisors) and two mucosal biopsies were taken at this level using standard biopsy forceps (designated “mid-jejunum” or “m”). The enteroscope was then withdrawn, and two further biopsies were taken at approximately the ligament of Treitz (proximal jejunum, “p”) and, in an identical manner, from the second part of the duodenum, gastric antrum, body and fundus, and the distal oesophagus. Mucosal biopsies were transferred immediately after collection into the RNA stabilisation reagent RNAlater (Qiagen, Sydney, NSW, Australia) and kept overnight at 4°C before storage at −20°C until use.
Endoscopy
Eleven subjects with type 2 diabetes (mean age 72.0 (1.9) years, BMI 33.4 (1.8) kg/m2) were recruited amongst patients referred for diagnostic endoscopy, in most cases to investigate iron deficiency. Only patients in whom the small intestinal mucosa was macroscopically and histologically normal were included. The mean duration of diabetes was 13.1 (3.0) years, and the majority were taking metformin, with or without additional oral hypoglycaemic agents or insulin. Five had microvascular complications (all with peripheral neuropathy, nephropathy without elevated creatinine in four, and retinopathy in one), and all subjects but one had evidence of macrovascular disease. As a group, the diabetic subjects had few upper gastrointestinal symptoms, based on a standard questionnaire that rated anorexia, nausea, early satiation, upper abdominal discomfort, vomiting and pain each on a scale of 0 (none) to 3 (severe), with scores added to derive a total symptom score (mean 2.9 (0.9) from a maximum possible score of 18).26 Their glycated haemoglobin (HbA1c) was 7.3% (0.2%), and the blood glucose concentration measured by glucometer (Medisense Precision QID; Abbott Laboratories, Bedford, Massachusetts, USA) immediately prior to endoscopy was 6.7 (0.5) mmol/l. At endoscopy, two mucosal biopsies were taken from the second part of the duodenum, as well as from the gastric antrum, body and fundus, and the distal oesophagus, and collected into RNAlater (Qiagen). Comparative molecular and immunohistochemical studies were subsequently performed in duodenal biopsies, due to the routine availability of endoscopy samples compared with enteroscopy samples, and based on data from enteroscopy subjects showing similar levels of taste molecule transcripts in duodenum and jejunum biopsies.
Six non-diabetic subjects were also recruited from patients referred for diagnostic endoscopy; in these subjects the indication was haematoemesis (1 subject), dysphagia (1), dyspepsia (1), assessment of gastric ulcer healing (1) and follow-up for Barrett’s oesophagitis (2). Biopsy samples were taken from small intestinal mucosa that was macroscopically, and subsequently confirmed to be histologically, normal. Molecular analyses of duodenal biopsies from these six enteroscopy and six endoscopy subjects were pooled, representing a non-diabetic group of 57.3 (5.1) years mean age and BMI of 27.6 (1.8) kg/m2. The number of control and diabetic subjects recruited into this study was based on power calculations and variance estimates derived from our past data on taste molecule expression in the mouse small intestine27 and pilot data from human gastrointestinal biopsies.28
Glucose exposure protocol for mouse jejunal mucosa samples
For in vivo experiments, mice were anesthetised with isoflurane (1–2% in oxygen), a jugular cannula was inserted for sampling of blood, a mid-line laparotomy performed and a loop of mid-jejunum was cannulated at 4 and 10 cm from the ligament of Treitz. A jejunal perfusion protocol in rats29 was modified for use in mice in which 1 ml of saline or saline containing 25% glucose or 25% 2-deoxyglucose (a non-metabolisable non-sweet osmotic control)19 was perfused in single-pass mode over 15 min. Blood glucose levels were monitored at 5 min intervals starting 10 min prior to perfusion using a glucometer (Medisense Precision QID) to confirm that the blood glucose concentration did not rise during glucose perfusion. Mice were humanely killed postperfusion by anaesthetic overdose (5% isoflurane) and the perfused mid-jejunum segment was then removed, cut longitudinally along the cephalocaudal axis, pinned in a dissection tray, and washed with ice-cold saline. A scalpel blade was used to harvest mucosa, which was then frozen over liquid nitrogen in preparation for RNA extraction and molecular analyses. Mid-jejunal mucosa was chosen for molecular analyses as our previous data in mice indicated that gut taste cells were preferentially located in this region of the mouse small intestine and were rare in the duodenum.15
RNA extraction
Frozen gastrointestinal mucosal biopsies from subjects and mucosal samples from mice were disrupted in a glass mortar and pestle and homogenised in QIAshredder columns (Qiagen). Total cellular RNA was isolated using the RNeasy Mini kit (Qiagen) as per the manufacturer’s instructions, which included an on-column DNase digestion. Eluted RNA was then diluted 1:50 in TE buffer and quantified in triplicate by spectrophotometry (260 nm), and purity assessed by the A260/A280 ratio.
Primers and the generation of reverse transcription-PCR (RT-PCR) products for target gene standard curves
Validated human and mouse primers were purchased as QuantiTect primer assays (Qiagen), or designed using Primer 3.0 software (Applied Biosystems, Foster City, California, USA), based on target sequences obtained from the NCBI nucleotide database (table 1). Primer pairs were designed so that at least one of the pair spanned an exon–exon boundary, and were checked for specificity (NCBI GenBank database).
Additional human primers were designed to amplify target genes outside the regions detected by the quantitative RT-PCR primers (table 2) to create absolute standard curves.
Quantification of gene expression by real-time RT-PCR
Quantitative RT-PCRs (QRT-PCRs) were performed using a Chromo4 (MJ Research, Waltham, Massachusetts, USA) real-time instrument attached to a PTC-200 Peltierthermal cycler (MJ Research) and analysed using Opticon Monitor software (MJ Research). Reverse transcription and PCR were performed using a QuantiTect SYBR Green one-step RT-PCR kit (Qiagen) according to the manufacturer’s specifications under the following conditions: reverse transcription, 50°C for 30 min; initial PCR activation, 95°C for 15 min; PCR cycles, 94°C for 15 s denaturation, 55°C for 30 s annealing and 72°C for 30 s extension, repeated for 40 cycles. A final dissociation stage was run to generate a melting curve from 65 to 95°C for verification of amplification product specificity, and no primer dimers were observed. Sizes of amplified products were determined by 3% agarose gel electrophoresis and ethidium bromide staining. Each assay was performed in quadruplicate and included control PCRs where RNA template was substituted with distilled RNase-free water (no template), and where the reverse transcription step was omitted (–RT).
Copy number calculations and dilution of cDNA standards
Absolute standard curves were generated by performing QRT-PCR using human primers (table 2), followed by gel electrophoresis and extraction of cDNA from bands corresponding to the correct molecular product size using the Ultraclean DNA Purification Kit (MO BIO Laboratories, Inc., West Carlsbad, California, USA). Purified cDNA was then resuspended in TE buffer and concentrations measured in triplicate using a spectrophotometer. The cDNA concentration was converted into copy numbers based on the formula for creation of standard curves.30 Briefly, the mass (m) of a single cDNA molecule was determined by multiplying the fragment size (bp) by a factor derived from the average molecular mass of a double-stranded DNA (dsDNA) molecule (660 g/mol) and Avogadro’s constant (6.02×10²³ bp/mol). Concentrations corresponding to a desired copy number were obtained by the following formula

Stock of the purified cDNA fragments was diluted to the appropriate concentration and a series of six dilutions was created to contain 104–109 molecules in each dilution. Triplicates of each cDNA dilution were inserted into the plate after the reverse transcription step for initial PCR activation, in order to generate a template for standard curve reactions. A standard curve based on the copy numbers of the known standards and threshold cycle (CT) was automatically generated by the Opticon monitor software. The mRNA copy number for each target was calculated from CT values, referenced to the standard curve. All replicates were averaged for final mRNA copy number, which was expressed as copies per 50 ng of total RNA of the sample.
Relative quantification of taste transcripts in mice
Calculations of relative RNA expression were performed using the comparative cycle threshold (CT) method, comparing with the internal reference gene glyceraldehyde phosphate dehydrogenase (GAPDH) using the calculation ΔCT (CT of target transcript – CT of GAPDH).31 Quantitative standard curves were calculated for each target and reference gene using serial dilutions of template RNA, and all assays were validated for linearity of amplification efficiency (ΔCT slope<1). To determine the relative expression of targets, the ΔΔCT was calculated using the formula: ΔΔCT = ΔCT [GAPDH] −ΔCT [target], and the relative fold differences calculated using the formula 2−2ΔΔCT.32 Due to amplification in –RT controls for GAPDH and T1R3 (despite DNase treatment), corrected CT values were calculated using the difference in mean CT for their RNA template and corresponding –RT samples.33 Genomic DNA always represented <2% of the cDNA sample.
Data and statistical analysis
Statistical analysis of human and mouse data was performed with Prism software (version 4.03; Graphpad, San Diego, California, USA). One-way analysis of variance (ANOVA) was used to compare transcript expression between gastrointestinal regions in non-diabetic subjects (Bonferroni post hoc test), and to test differences in blood glucose concentrations from mice experiments (Dunnett post hoc test). Unpaired t tests were used to compare transcript expression in mice experiments and differences in duodenal expression of taste molecules between non-diabetic and diabetic subjects. Correlations between transcript expression and other factors were performed using a Pearson correlation, giving a Pearson correlation coefficient (r). A p value <0.05 was considered significant. Data are expressed as mean (SE).
Immunohistochemistry
Separate duodenal biopsies from two diabetic subjects were collected in 10% neutral buffered formalin and fixed at room temperature for 1–2 h. Biopsies were then given several washes in 0.1 M phosphate-buffered saline (PBS) pH 7.4 before cryoprotection in 30% sucrose/PBS. Biopsies were embedded in cryomoulds and frozen before being sectioned at 10 μm on a cryostat (CRYOCUT 1800 Leica Biosystems, Nussloch, Germany) and thaw-mounted directly onto gelatin-coated slides. Immunoreactivity for Gαgust was detected with a C-terminus-directed polyclonal rabbit antibody (1:200, SC-7782, Santa Cruz Biotechnology, California, USA). Sections were air dried at room temperature for 15 min before several washes in PBS-T (PBS+0.2% Triton X-100, Sigma-Aldrich, St Louis, Missouri, USA) at pH 7.4. Sections were incubated with blocking solution (2% normal goat serum, 1% bovine serum albumin (BSA), 0.1% Triton X-100, 0.05% Tween-20, 0.1% gelatine, 1× PBS) for 1 h at room temperature. Primary antibody was diluted in blocking solution and incubated overnight at 4°C. Negative controls were obtained by omitting the primary antibody from the incubation. Sections were then washed in PBS-T and incubated with an anti-rabbit Alexa Fluor 546 secondary antibody (1:200 in PBS-T) for 1 h at room temperature. Sections were washed again in PBS-T, mounted in ProLong Antifade reagent (Invitrogen) and coverslipped. Sections were visualised and imaged on an epifluorescence microscope (BX-51, Olympus, Australia) and images acquired on a monochrome CCD digital camera system (Photometrics CoolSNAPfx, Roper Scientific,Tuscon, AZ) using V++ Precision Digital imaging System software (Digital Optics, Auckland, New Zealand).
RESULTS
Taste molecules are expressed in the human upper gastrointestinal tract
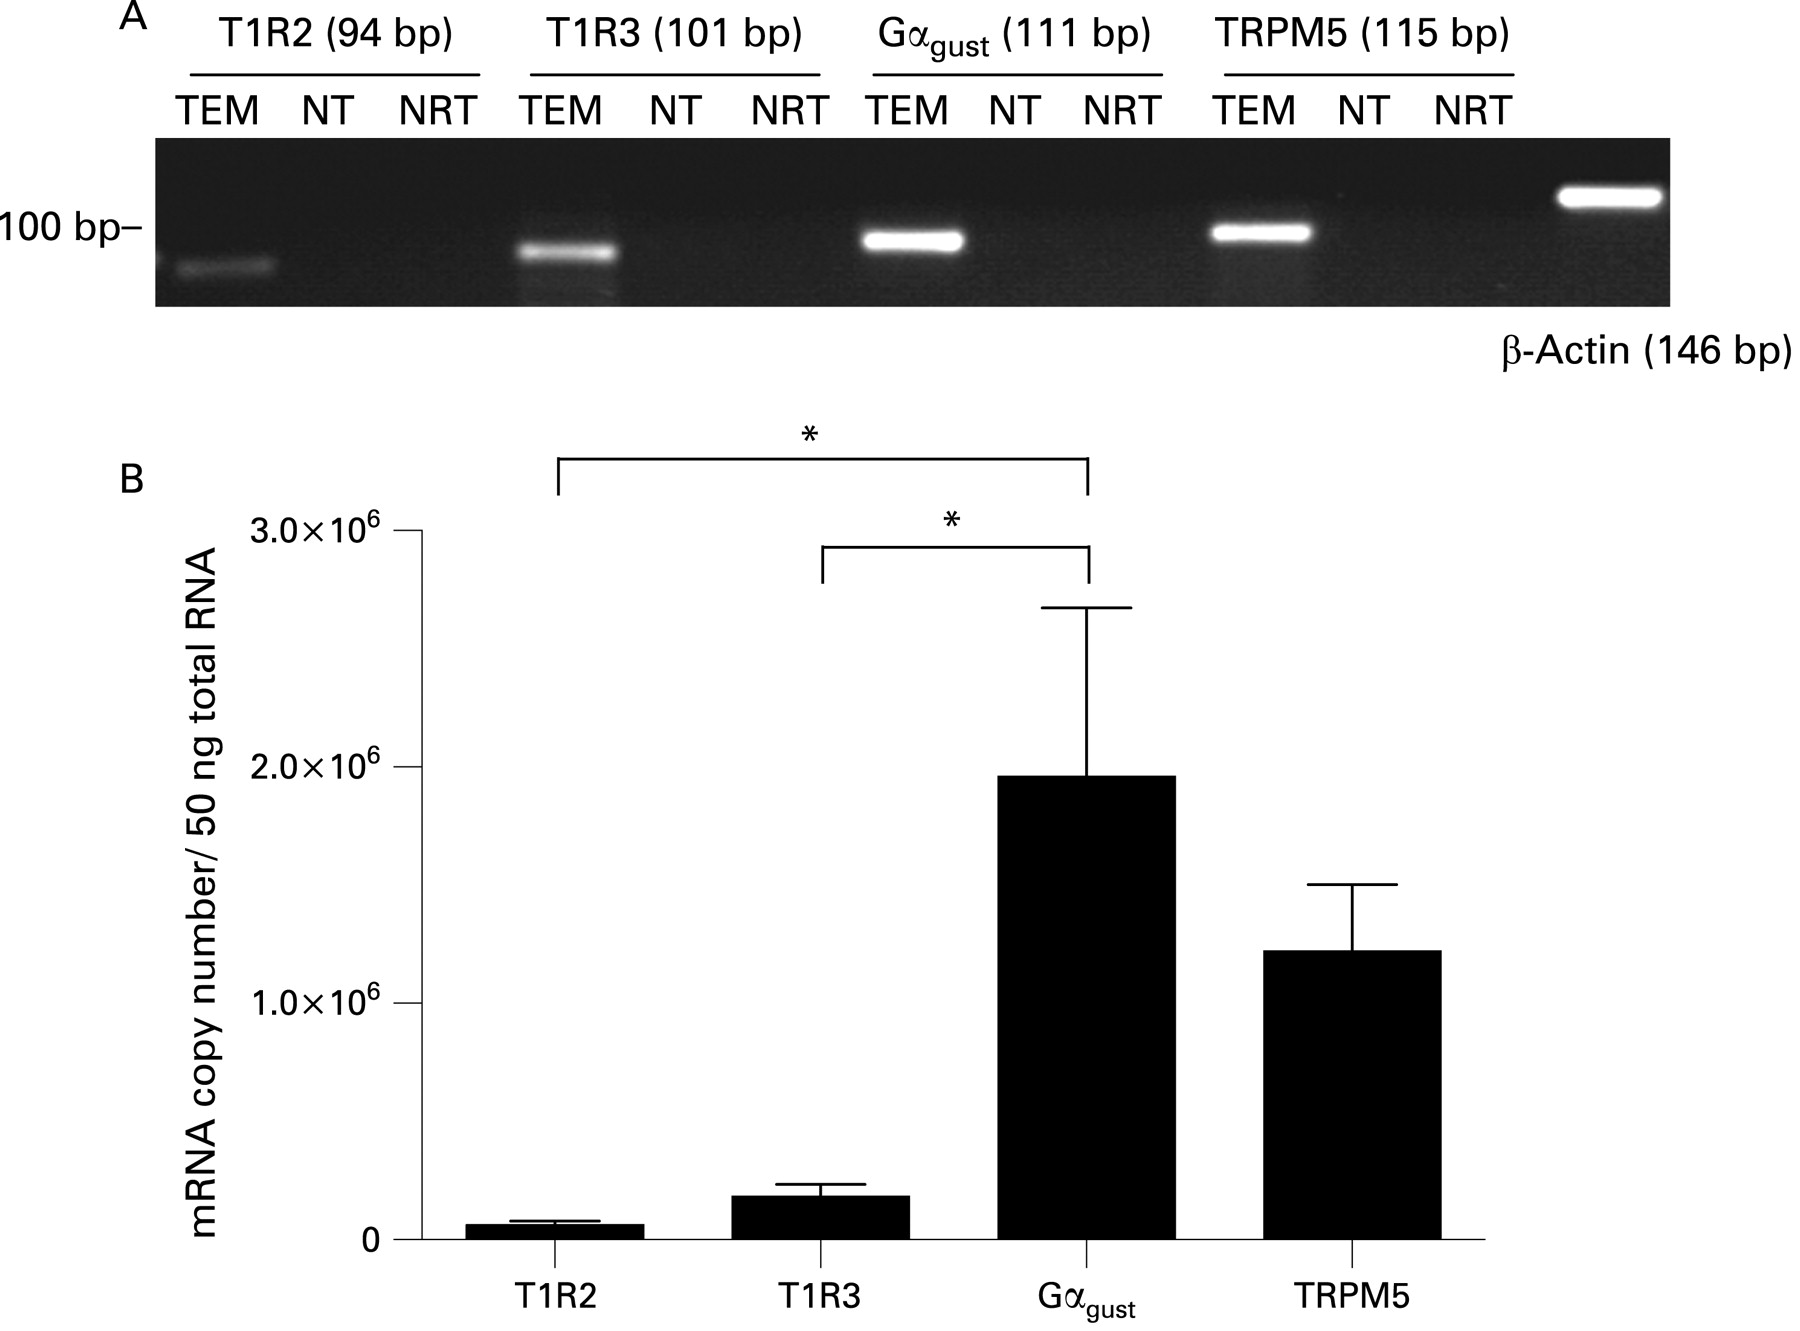
QRT-PCR analysis demonstrated the presence of transcripts for taste molecules T1R2, T1R3, Gαgust and TRPM5 in the mucosa of the human upper gastrointestinal tract. Single bands corresponding to the predicted product size for each primer assay, as well as β-actin, were confirmed by gel electrophoresis (fig 1A). Absolute transcript levels for T1R2, T1R3, Gαgust and TRPM5 are compared directly in human duodenal biopsies in fig 1B (and can be compared for all regions in fig 2). Gαgust and TRPM5 transcripts were present in greater quantities than those of T1R2 and T1R3. Gαgust transcript levels were 13.4 (4.8)-fold higher than those of T1R3 in the human duodenal mucosa, while Gαgust was 33.4 (6.3) times more abundant than T1R2 (p<0.05 for each) at this site. TRPM5 transcripts were 11.6 (3.8) and 27.4 (5.9)-fold higher than those of T1R3 or T1R2, respectively, in the duodenal mucosa. T1R2 was the least expressed taste molecule.

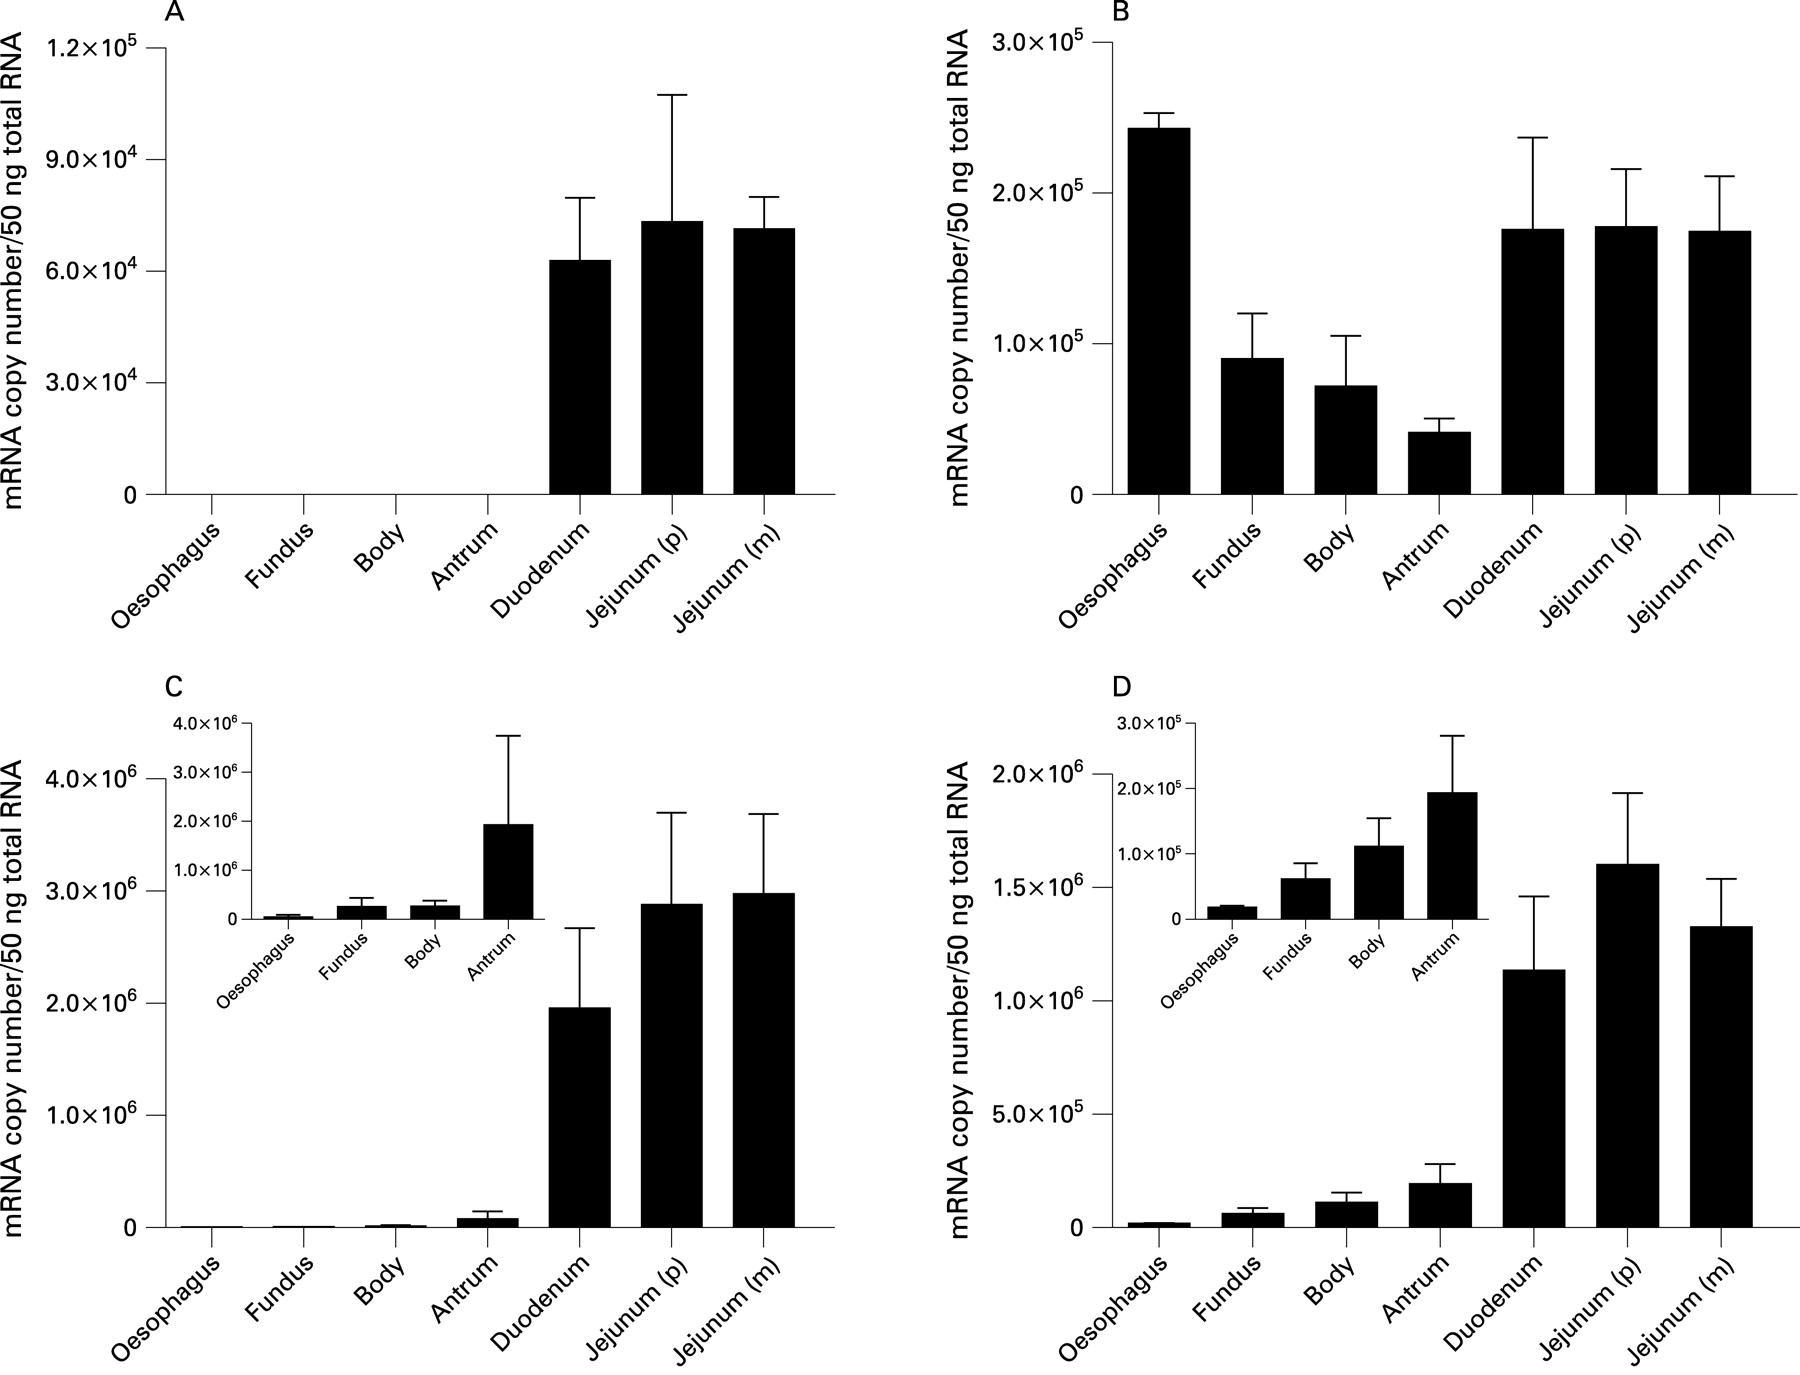
Taste molecules show regional specificity of expression in the upper gastrointestinal tract
Analysis of taste molecule expression by QRT-PCR revealed that their expression in the upper gastrointestinal tract was region specific. The sweet taste-specific receptor, T1R2, was specifically present in the duodenum and jejunum, and showed comparable expression in duodenum and jejunal biopsies. In contrast, T1R2 transcripts were not detected in any oesophageal or gastric biopsy (fig 2A). The sweet and umami receptor, T1R3, was expressed in all regions of the upper gastrointestinal tract, but predominantly in distal oesophagus, duodenum and jejunum (fig 2B). Transcript levels of Gαgust and TRPM5 were present at significantly lower levels in distal oesophagus and stomach than in duodenum and jejunum (p<0.05, fig 2C,D).
Immunoreactivity for Gαgust in individual epithelial cells of the human duodenum
Immunolabelling with a primary antibody directed against Gαgust identified a population of epithelial cells in the human duodenum, as shown in fig 3. These occurred singly and were dispersed throughout the villous epithelium (fig 3A–C), with rare cells identified in duodenal glands (fig 3D). Immunolabelled cells were of the open cell type (with the apical tip accessible to the lumen), and showed a homogenous distribution of label throughout the cytoplasm. No immunohistochemical data were obtained for T1R2, T1R3 or TRPM5 because available antibodies were of poor quality.

Expression of taste molecules in the duodenum of subjects with and without type 2 diabetes
Levels of taste molecule transcripts in the duodenum of diabetic subjects, as a group, did not differ significantly from those in non-diabetic subjects (fig 4), nor did levels in either subject group significantly correlate with age, gender or BMI. In subjects with diabetes, neither the duration of diabetes nor HbA1c levels at endoscopy correlated with expression levels of taste molecules.

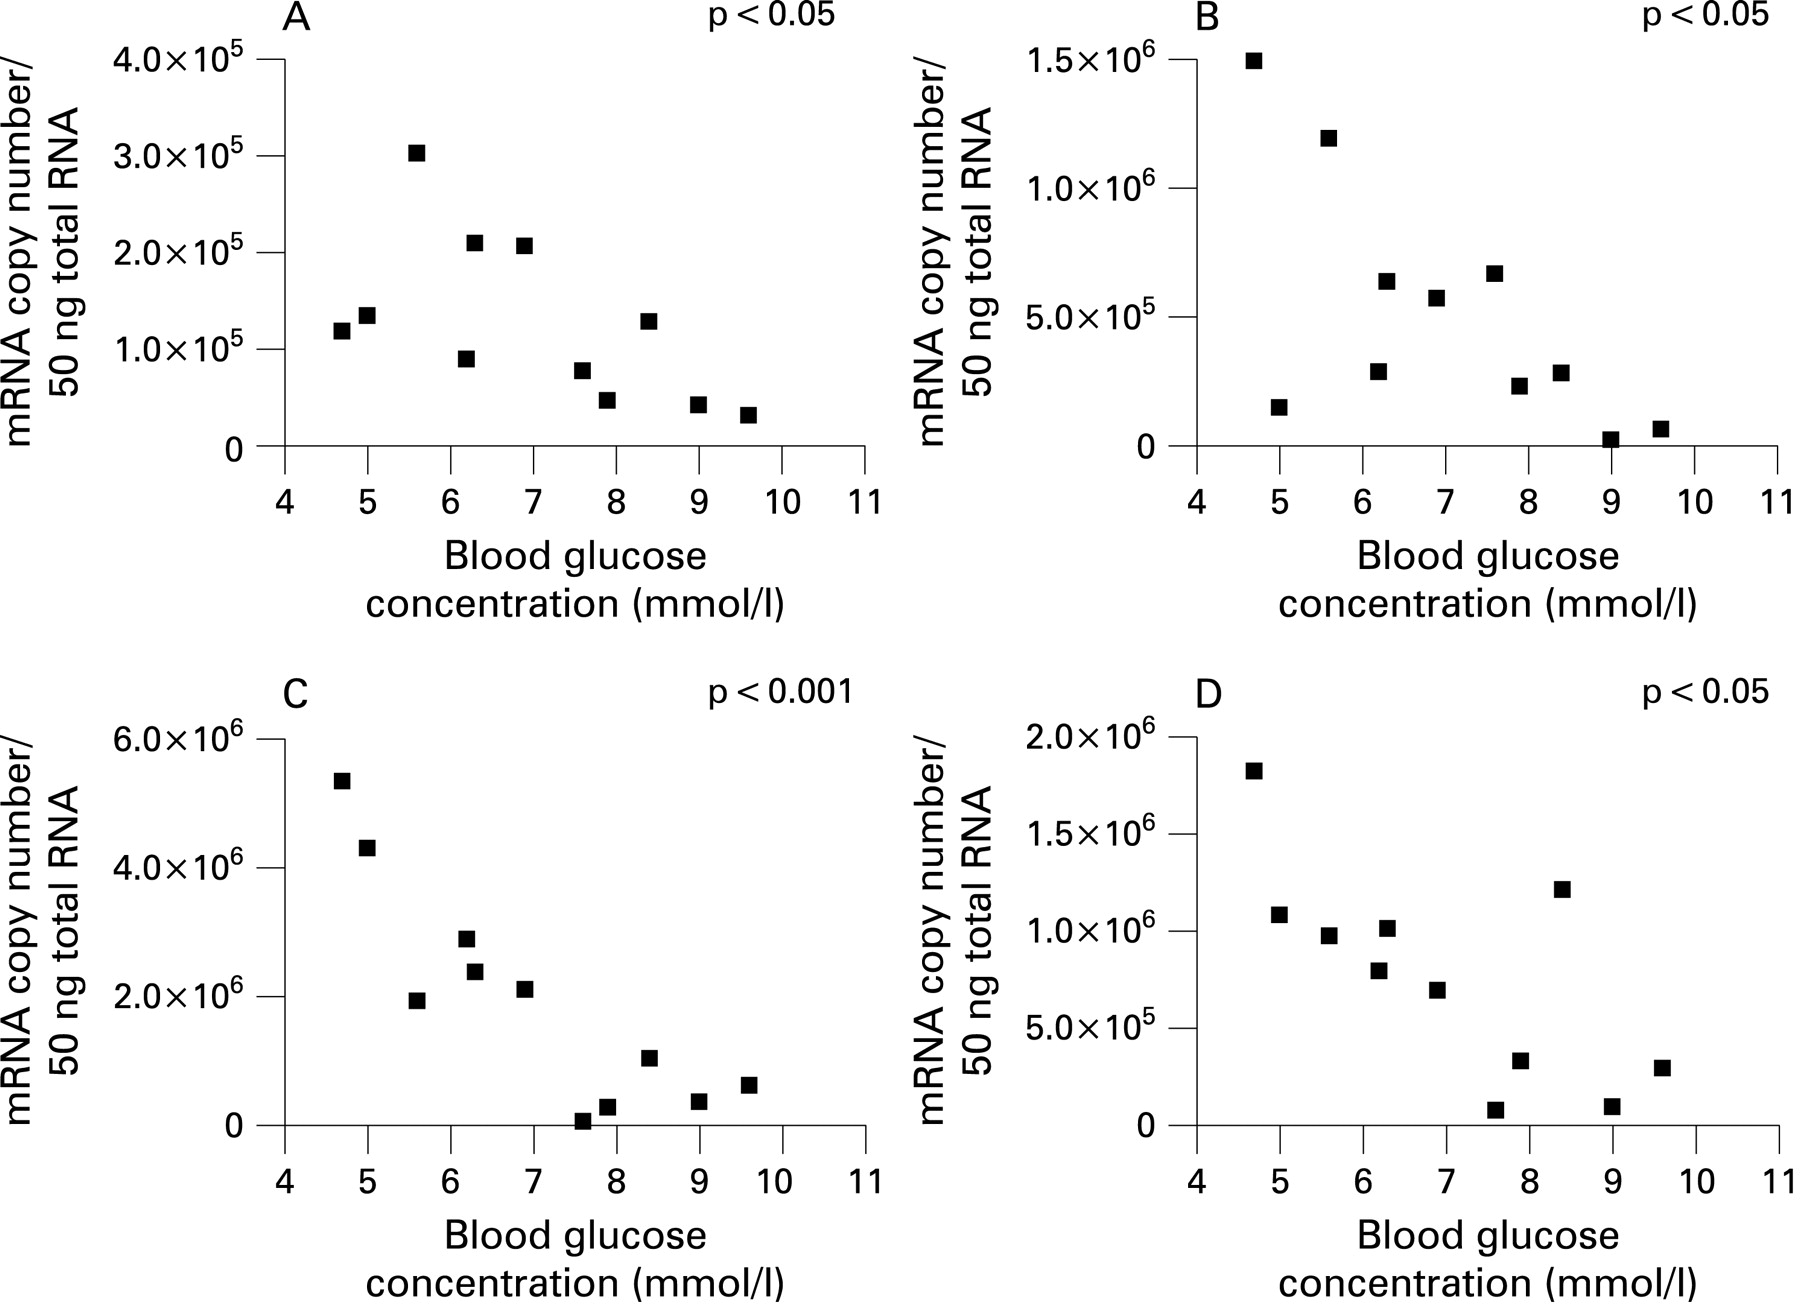
In contrast, taste molecule expression in diabetic subjects showed a significant inverse correlation with the blood glucose concentration at the time of endoscopy (fig 5), indicating that expression of taste molecules was reduced in diabetic subjects with higher fasting blood glucose concentrations. This relationship was apparent for all taste molecules tested, T1R2 (Pearson r = −0.6028, p<0.05), T1R3 (r = −0.6565, p<0.05), Gαgust (r = −0.8635, p<0.001) and TRPM5 (r = −0.7252, p<0.05).

Modulation of jejunal taste molecule expression by luminal glucose
Taste molecules T1R2, T1R3, Gαgust and TRPM5 were detected by QRT-PCR in the mucosa of the mouse jejunum. Single bands corresponding to the predicted product size for each primer assay were confirmed by gel electrophoresis. TRPM5 transcripts were the most abundant, expressed at levels 3.5-fold and 2.7-fold higher than T1R2 and T1R3, respectively (p<0.05). Gαgust was the least expressed transcript.
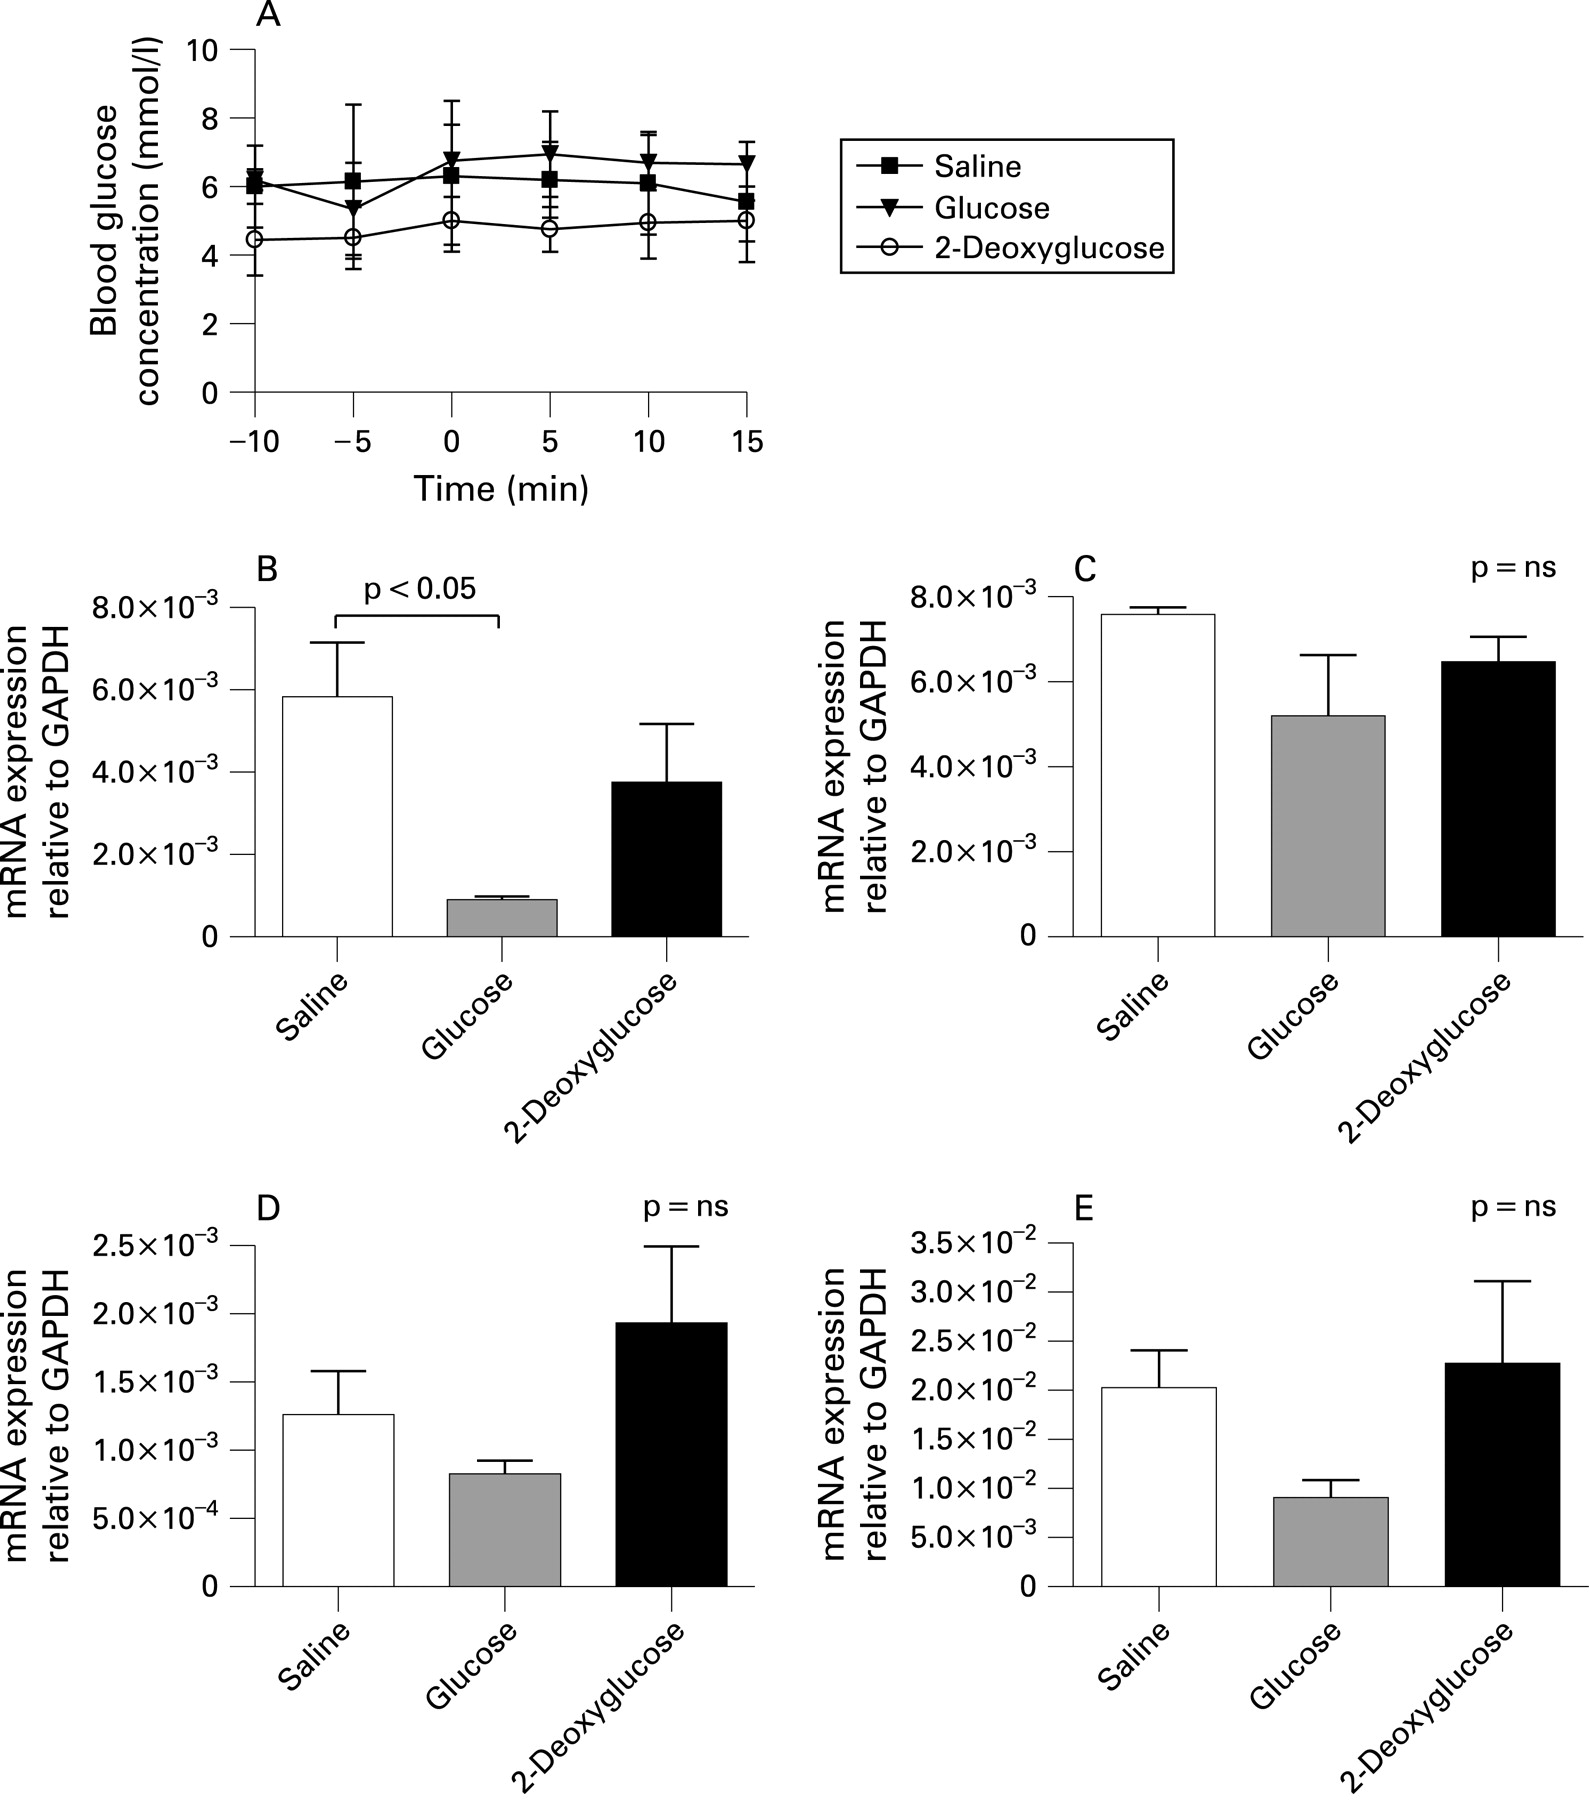
Relative expression of T1R2 was markedly reduced in the mouse jejunum following 15 min glucose perfusion (84% reduction; p<0.05, fig 6B). In contrast, transcript levels for T1R3, Gαgust and TRPM5 were not significantly altered by luminal glucose, although a strong trend was evident for TRPM5 (55% reduction; p = 0.09, fig 6C–E). There were no significant differences in jejunal expression of taste molecules in mice perfused with 2-deoxyglucose. Blood glucose levels were not significantly changed during these experiments (fig 6A), indicating a specific effect of luminal glucose on jejunal expression of T1R2.
DISCUSSION
This study has established that taste molecules T1R2, T1R3, Gαgust and TRPM5 are expressed in the upper gastrointestinal mucosa in humans, strongly supporting the concept that a taste pathway, similar to that in the tongue, exists in the gut. Moreover, quantification of absolute copy numbers of these transcripts has revealed substantial regional specialisation, with predominant expression in the proximal small intestine, a key site for nutrient detection. These taste molecules are, therefore, likely to represent the sensory apparatus for feedback control of gastrointestinal function in response to luminal nutrients. We have further shown that the expression of T1R2, T1R3 and TRPM5 is inversely related to the blood glucose concentration in subjects with type 2 diabetes, suggesting that the signalling of nutrient from the gut lumen is under dynamic metabolic control. Finally, we have shown that short-term perfusion of the mouse jejunum with glucose significantly decreases mucosal expression of T1R2, highlighting a role for luminal glucose in transcriptional control of the sweet taste receptor.
The differences in expression of taste molecules between human gastric and small intestinal mucosa are consistent with the different roles of these gut regions in the processing of ingested material. Our quantitative expression data show that Gαgust and TRPM5 transcripts are present at higher levels in proximal intestine than transcripts for T1R2 and T1R3. On the tongue, T2R and T1R receptors are expressed in mutually exclusive populations of taste cells, with the T1R cell population subdivided into those that express a T1R1+T1R3 heterodimer and function as umami taste cells, and those that express a T1R2+T1R3 heterodimer and function as broadly tuned sweet taste cells.7 34 All three taste cell types share a common Gαgust/TRPM5 signalling pathway.35 As a consequence, the higher copy number of Gαgust and TRPM5 transcripts in the proximal intestine may reflect their additional expression in bitter13 and/or umami gut taste cells, or differences in post-transcriptional processing of molecules involved in taste transduction. In a similar manner, T1R3 was also present at a higher copy number than T1R2 in the proximal small intestine, which may reflect additional expression of T1R3 in umami and sweet taste gut cells.
A seemingly anomalous observation was the high level expression of T1R3 transcript in the distal oesophagus, in contrast to other taste molecules. T1R2 expression was not detected in this region, suggesting that oesophageal T1R3 is not involved in carbohydrate detection. While we did not assess the expression of T1R1, it is conceivable that T1R1+T1R3 heterodimers in the distal oesophagus might function as an l-amino acid sensor, as they do in the tongue, with a potential role in sensing refluxed gastric material; however, this hypothesis would, of necessity, be the subject of a separate investigation.
Gαgust immunoreactivity was identified in single scattered epithelial cells in duodenal biopsies, equivalent to results reported in postmortem human duodenal tissue19 and colonic mucosa.18 Gαgust-immunopositive cells were a small population in the epithelium of duodenal biopsies. We have reported a higher frequency of Gαgust-expressing cells in the jejunum than the duodenum in mice using immunohistochemistry15; whether this is also the case in humans will require further studies. However, our quantitative analysis of Gαgust transcript expression shows higher levels in jejunum compared with duodenum. Based on mRNA levels of the other taste receptor molecules T1R2 and T1R3 relative to Gαgust, it is likely that some of these Gαgust-immunopositive cells are sweet sensing, but this could not be confirmed by T1R2 co-expression immunohistochemistry, due to a limitation in available antibodies.
Although key taste molecules were identified in the upper gastrointestinal tract in the current study, it is yet to be determined precisely how the nutrient-sensing mechanism operates, including the mediators released and nerve pathways activated by taste cells. Jang and colleagues recently identified a role for Gαgust in release of GLP-1 from intestinal L-cells.19 GLP-1 is released from the gut in response to dietary carbohydrates, and acts to increase satiety, stimulate insulin release, suppress glucagon and slow gastric emptying.36–38 Impaired GLP-1 release in response to ingested glucose occurs in Gαgust knockout mice,19 and Gαgust co-localises with GLP-1 in epithelial cells of the proximal and distal intestine in humans.18 Gut peptide secretion therefore appears to be at least one mechanism though which taste receptors in the intestine can generate feedback in response to luminal nutrients. However, a minority of Gαgust-expressing epithelial cells in the human and mouse small intestine co-express GLP-1,15 19 suggesting that this chemosensory transduction mechanism may involve the release of other regulatory peptides or mediators in additional cell populations.
Our study is the first to investigate expression of intestinal taste molecules in human disease, and provides novel evidence of variation in taste molecule expression according to the metabolic profile in subjects with type 2 diabetes. Specifically, duodenal expression of taste molecule transcripts for T1R2, T1R3, Gαgust and TRPM5 in diabetic subjects was inversely correlated with their blood glucose concentration at endoscopy. Expression of taste molecules did not correlate with HbA1c or with other symptom or disease measures in the diabetic subject group, nor did expression in either subject group correlate significantly with age, gender or BMI. This indicates that transcription of taste molecules in the gut mucosa is likely to be under direct and dynamic regulation by the blood glucose concentration.
In contrast, as a group, taste molecules in the duodenum of type 2 diabetic subjects were expressed at similar levels to those in control subjects. This finding may reflect the relatively modest range of blood glucose concentrations in these type 2 diabetic subjects which, although elevated for fasting values, were within the normal postprandial range. Equally, this may reflect the fact that expression of taste molecules was variable within the non-diabetic subjects, who themselves had a range of co-morbidities.
Our findings on the correlation between blood glucose concentration and taste molecule expression beg the question of whether the expression of taste molecules in the human intestine can be modulated directly by luminal stimuli. Chronic changes in luminal glucose exposure are known to modify the gastrointestinal response to glucose—for example, a chronic increase in dietary carbohydrate reduces satiety and accelerates gastric emptying in response to subsequent carbohydrate intake in normal subjects,39 while starvation is associated with delayed gastric emptying of glucose.40 To test whether luminal glucose directly regulates taste molecule expression, we performed an in vivo glucose perfusion study in mice, since this was not feasible in our patient population. We showed that jejunal expression of T1R2 was markedly decreased by acute glucose perfusion, in the absence of changes in blood glucose concentration. In contrast, expression of T1R3, Gαgust and TRPM5 was not significantly altered, indicating a specific effect of luminal glucose on expression of its cognate taste receptor. This finding supports, in part, in vivo data in rats showing that T1R2, T1R3 and Gαgust traffic away from the jejunal brush border membrane in response to short-term exposure to natural or artificial sugars.41 It appears, therefore, that the regulation of gut taste mechanisms by glucose is dynamic, and influenced by both blood glucose concentration and luminal glucose exposure.
Since there is functional evidence that taste molecules are linked to GLP-1 release,19 a maladaptive consequence of their downregulation could be to impair GLP-1 secretion. This would be consistent with the observation that patients with type 2 diabetes have a diminished GLP-1 response to a meal when compared with healthy subjects.42 However, as our subjects were studied only in the fasting state, we cannot provide any information about their incretin responses.
In conclusion, we have demonstrated region-specific expression of taste molecules in the human gut. Furthermore, we have provided evidence for their regulation by blood glucose concentration in type 2 diabetic subjects and by jejunal glucose exposure in mice. This suggests not only that the gut “tastes” its contents in a similar way to the tongue, but also that expression of intestinal taste molecules is under dynamic control by metabolic and luminal factors.
Acknowledgments
The authors wish to thank Dr Mark Schoeman and the Endoscopy Unit staff, Department of Gastroenterology and Hepatology, Royal Adelaide Hospital, for their assistance with the study.
REFERENCES
Footnotes
-
RLY and KS contributed equally to this work.
-
Funding: This work was supported by funds received from the Royal Adelaide Hospital, Institute of Medical & Veterinary Sciences and the University of Adelaide. Richard L. Young was supported by a National Health and Medical Research Council of Australia (NHMRC) Centre for Clinical Research Excellence in Nutritional Physiology, Interventions and Outcomes Postdoctoral Fellowship. Stuart M Brierley was supported by an NHMRC Australian Biomedical Fellowship. L. Ashley Blackshaw was supported by an NHMRC Senior Research Fellowship.
-
Competing interests: None.
-
Ethics approval: Human studies were approved by the Human Research Ethics Committee of the Royal Adelaide Hospital, Adelaide, Australia, and each subject gave written, informed consent. Animal studies were performed in accordance with the guidelines of the Animal Ethics Committee of the Institute of Medical & Veterinary Science (Adelaide, Australia) and the University of Adelaide.
-
Preliminary accounts of this work were presented at the Digestive Disease Week meetings of the American Gastroenterological Association in Washington, DC (2007)28 and San Diego, CA (2008).43
Linked Articles
- Digest
- Commentary