Article Text

Abstract
Background and aims: Approximately 10% of adults experience gastro-oesophageal reflux symptoms with a variable oesophageal response. A total of 60% have no endoscopic abnormality, 30% have oesophagitis, and 10% have Barrett's oesophagus. We investigated whether the inflammatory cell infiltrate and cytokine profiles of these clinical phenotypes merely vary in severity or are fundamentally different.
Methods: Patients with reflux symptoms and a normal oesophagus (n=18), oesophagitis (n=26), and Barrett's oesophagus (n=22 newly diagnosed, n=28 surveillance) were recruited. Endoscopic and histopathological degrees of inflammation were scored. Cytokine expression was determined by competitive reverse transcriptase-polymerase chain reaction and immunohistochemistry.
Results: In oesophagitis, endoscopic and histopathological grades of inflammation correlated highly. mRNA expression of proinflammatory interleukin (IL)-1β, IL-8, and interferon γ (IFN-γ) were increased 3–10-fold compared with non-inflamed squamous or Barrett's oesophageal samples. There was a modest increase in anti-inflammatory IL-10 but no increase in IL-4. In Barrett's oesophagus, 29/50 had no endoscopic evidence of inflammation and histopathological inflammation was mild in 17/50 and moderate in 24/50, independent of acid suppressants. Expression of IL-1β, IL-8, and IFN-γ was similar to non-inflamed squamous mucosa. IL-10 was increased 1.6-fold similar to oesophagitis. IL-4 was increased fourfold, with 100-fold increase in IL-4/T cell receptor expression, compared with squamous oesophagus or oesophagitis.
Conclusions: Barrett's oesophagus is characterised by a distinct Th-2 predominant cytokine profile compared with the proinflammatory nature of oesophagitis. The specific oesophageal immune responses may influence disease development and progression.
- Barrett's oesophagus
- oesophagitis
- gastro-oesophageal reflux disease
- inflammation
- cytokines
- GORD, gastro-oesophageal reflux disease
- TCR, T cell receptor
- PPI, proton pump inhibitor
- RT-PCR, reverse transcriptase-polymerase chain reaction
- IFN-γ, interferon γ
- IL, interleukin
- PPI, proton pump inhibitor
Statistics from Altmetric.com
- GORD, gastro-oesophageal reflux disease
- TCR, T cell receptor
- PPI, proton pump inhibitor
- RT-PCR, reverse transcriptase-polymerase chain reaction
- IFN-γ, interferon γ
- IL, interleukin
- PPI, proton pump inhibitor
Gastro-oesophageal reflux disease (GORD) is an important public health problem. Heartburn is common with an estimated 10% of adults in the USA experiencing daily heartburn with significant detrimental effects on their quality of life.1,2 As a consequence, the widespread prescription of acid suppressant therapy accounts for a substantial part of the health care drug budget.2 Furthermore, it has recently been shown that chronic heartburn symptoms are an independent risk factor for the development of oesophageal adenocarcinoma.3 This is particularly important as this cancer is increasing in incidence faster than any other solid tumour in the Western world4 and has a very poor prognosis unless diagnosed early.5
As a result of the requirement for long term medication and the possibility of associated malignancy, patients with persistent reflux symptoms are frequently referred for endoscopy. The endoscopic findings are highly variable and unpredictable.6 Approximately 60% of patients have no abnormality, 30% have oesophagitis, and 10% have a metaplastic columnar lined epithelium containing goblet cells, so called Barrett's oesophagus.7–10 These diverse oesophageal responses to gastro-oesophageal reflux are poorly understood. Although the degree of reflux exposure may in part be responsible,11–13 there is considerable overlap between the magnitude of gastro-oesophageal reflux assessed by 24 hour ambulatory oesophageal pH and bilitec studies, and the type and degree of oesophageal damage.14–19 Hence although Barrett's oesophagus is commonly considered to be the end stage of an oesophagitis continuum (grade V in the revised Savary-Miller classification of oesophagitis20), oesophagitis is not an independent risk factor for the development of Barrett's oesophagus.21,22 Furthermore, it is apparent to endoscopists that Barrett's oesophagus is often remarkably free from the acute inflammatory changes associated with oesophagitis even when patients are not on acid suppressant medication. However, the inflammatory profile of Barrett's oesophagus has not been formally characterised.
We hypothesise that the immune profiles of the varied oesophageal responses to GORD may give important insights into their aetiopathogenesis, as has been described in other conditions in which a diverse phenotypic response occurs in reply to a common antigenic stimulus. For example, the specific CD-4+ T cell response to Mycobacterium leprae is characterised by an interferon γ (IFN-γ) and interleukin (IL)-2 predominant Th-1 response in granulomatous leprosy whereas lepromatous leprosy is driven by an IL-4 anti-inflammatory Th-2 response.23 Similarly, whether patients develop Crohn's disease or ulcerative colitis may be determined in part by the specific cytokine profiles.24–26 Furthermore, it has recently emerged that whether patients with gastric Helicobacter pylori infection develop duodenal ulcer disease as opposed to intestinal metaplasia and ultimately gastric cancer is associated with specific IL-1β polymorphisms which influence IL-1β expression in the gastric mucosa.27
The aim of this study was to characterise the nature of the T cell and cytokine responses in patients with GORD who have either Barrett's oesophagus, oesophagitis, or normal squamous oesophageal mucosa. The cytokines studied were IL-8 and IL-1β (proinflammatory neutrophil chemoattractants), IFN-γ (Th-1 cytokine), IL-4, and IL-10 (Th-2 cytokines). We did not examine growth factors that have been previously examined with regard to the metaplasia-dysplasia sequence (tumour necrosis factor α, transforming growth factor β, epidermal growth factor).28,29 We hypothesised that by studying these specific cytokines for the first time, we might shed light on the pathogenesis of diverse oesophageal phenotypes and the propensity to develop specific complications.
MATERIALS AND METHODS
Patients and tissue collection
Patients were recruited prospectively from Havering Hospitals and St Bart's and the London NHS Trusts following approval by the local research ethics committees. Patients had an endoscopic and histopathological diagnosis of either: Barrett's oesophagus (columnar lined segments >3 cm containing specialised intestinal metaplasia), oesophagitis, or reflux symptoms but a normal non-inflamed squamous mucosa. Patients with Barrett's oesophagus included newly diagnosed patients and those undergoing surveillance endoscopy for cancer who were routinely taking proton pump inhibitors (PPIs). For all patients the endoscopist recorded the current severity of the reflux symptoms as well as the dose and type of any acid suppressant medication taken in the month prior to endoscopy. At endoscopy, the length of oesophagitis or Barrett's oesophagus was determined by measuring the proximal and distal extents (in cm) from the teeth. The distal extent was taken from the gastro-oesophageal junction as determined by commencement of the gastric folds.30 In patients with Barrett's oesophagus, the presence and degree of any associated inflammation both within the Barrett's segment and in the normal squamous oesophageal mucosa above Barrett's mucosa was graded according to the revised Savary-Miller classification grades 0–IV.20
In addition to Barrett's oesophagus surveillance biopsies (taken from each quadrant every 2 cm, including squamous mucosa 2 cm above Barrett's segment),31 specific paired biopsies were taken for research. These included one biopsy snap frozen for analysis of cytokine mRNA expression and one formalin fixed biopsy for histopathology and immunohistochemistry. For patients with oesophageal disease, these paired biopsies were taken from the midpoint of the oesophagitis or the Barrett's oesophagus segment, and for patients with macroscopically normal mucosa biopsies from 2 cm above the gastro-oesophageal junction. In addition, biopsies were taken from the gastric antrum and the second part of the duodenum from all patient groups. Any samples from patients with a histopathological diagnosis of gastritis or duodenitis were excluded.
Microscopic grading of inflammation
Biopsies were mounted on cardboard, fixed in 3.7% buffered formalin, sectioned at 3 μm, and stained with haematoxylin and eosin. A single consultant histopathologist (ITS), who was unaware of the endoscopic findings, analysed the sections microscopically.
Squamous oesophageal samples were examined for oesophagitis by the presence of basal layer hyperplasia and papillary elongation based on the criteria of Ismail-Beigi and colleagues.32
The diagnosis of Barrett's oesophagus, characterised by specialised intestinal metaplasia, was verified by alcian blue staining of the goblet cells and the presence and grade of dysplasia were determined.33 For 50 consecutive patients with non-dysplastic Barrett's oesophagus the updated Sydney system was employed to formally assess the histopathological degree of inflammation.34 The Sydney system was used because there is no grading system for inflammation in Barrett's oesophagus. Whereas the standard classification criteria for oesophagitis are not applicable to this glandular epithelium, Barrett's oesophagus has morphological similarities to the gastric epithelium for which the Sydney grading system for inflammation is well established. Inflammation was graded using a visual analogue scale taking into account the degree of neutrophilic and eosinophilic infiltration (0, none; 1, mild; 2, moderate; 3, marked); this scale has been shown to have excellent interobserver agreement.35,36
Immunohistochemistry
Representative slides were chosen at random from patients with Barrett's oesophagus and oesophagitis. Tissue sections were deparaffinised, rehydrated through graded alcohol solutions, and finally with phosphate buffered saline. Endogenous peroxidase activity was blocked with 3% hydrogen peroxide and an antigen retrieval step was performed by microwaving samples at high power for 30 minutes in 0.1 M citrate buffer, pH 6.0. Blocking was performed using 10% normal horse serum for 30 minutes at room temperature. The following primary antibody dilutions were used: CD-45 1:100; IL-8 1:20; IL-10 1:30; IL-1β 1:100; IFN-γ 1:200 (as recommended by the manufacturer, R&D Systems Europe Ltd, Abingdon, UK), all overnight at 4°C. For all experiments a negative control was performed by substitution of the primary antibody with phosphate buffered saline. After washing, biotinylated antimouse IgG (1:250) was added for 30 minutes followed by avidin-biotin complex (ABC; Vector Laboratories, Inc., Burlingame, California) also for 30 minutes at room temperature. Visualisation was performed using the 3,3`-diaminobenzidine method (Vector Laboratories). Sections were counterstained with haematoxylin in the standard fashion and, where possible, slides were also counterstained with alcian blue for 30 minutes to highlight goblet cells in Barrett's specialised intestinal metaplasia. Photographs were taken using Ektachrome Kodak Elite 400 colour slide film from which the prints were generated.
Scoring immunohistochemistry for CD-45
CD-45 labelling was counted in two zones: the epithelium (the lumenal surface and gland cells) and the lamina propria. Three high power fields for at least three tissue sections were examined for three serial biopsies from each patient from which a mean score was generated.
Cell lines used and culture conditions
TE7 cells37 were derived from a patient with Barrett's associated adenocarcinomas and have been used as an in vitro model for Barrett's oesophagus.38 OE-21 cells were subcloned from an oesophageal squamous cell carcinoma and have a multilayered, stratified, non-keratinising phenotype (gift from Janusz Jankowski, Epithelial Laboratory, Department of Medicine, University of Birmingham, UK). Both cell lines were cultured in RPMI-1640 medium supplemented with 10% fetal bovine calf serum, 100 units/ml penicillin, 100 mg/ml streptomycin, and 1 mM glutamine, and grown in monolayers in 10 cm tissue culture dishes.
Competitive RT-PCR for a panel of cytokines
Preliminary analysis of a panel of cytokines enabled us to select those molecules which were in the detectable range and which were representative of chemokines Th-1 and Th-2 immune responses. mRNA expression of the T cell receptor (TCR), the proinflammatory cytokines (IL-1β, IL-8, and the Th-1 cytokine IFN-γ), and the anti-inflammatory Th-2 cytokines (IL-4 and IL-10) were quantified by competitive reverse transcriptase-polymerase chain reaction (RT-PCR) using a standard RNA molecule encoded by the plasmid pHCQ1 (gift from Dr M Kagnoff, La Jolla, California, USA), as described previously (primer sequences and reaction conditions are fully described in these references).39,40 Briefly, total RNA isolation from whole mucosal biopsies was performed using a monophasic solution of phenol and guanidine thiocyanate (Life Technologies, Paisley, UK), as recommended by the suppliers. Serial 10-fold dilutions of the standard (10 pg to 0.01 fg) were cotranscribed with total cellular RNA (1–5 μg) at 42°C for 50 minutes in 20 μl of reaction buffer containing 50 mM Tris, pH 8.3, 75 mM KCl, 3 mM MgCl2, 3 mmol/l DTT using 100 units of Moloney murine leukaemia virus RT, 500 μmol/l dNTP mix, and 0.5 μg oligo dT. PCR amplification was routinely carried out in 50 μl of reaction volume (10 mM Tris, pH 8.3, 50 mM KCl, 1.5 mM MgCl2, 200 μM of dNTPs, 20 pmol each of 5` and 3` primers, and 0.5 U of Taq polymerase). The amplification cycle consisted of 35 cycles of one minute denaturation at 95°C and 2.5 minutes annealing and extension at 60°C (IL-1β, IL-8, IFN-γ), 65°C (IL-4), or 72°C (IL-10). The temperature profile for amplification of TCR consisted of 35 cycles of one minute denaturation at 94°C, one minute annealing at 56°C, and one minute extension at 72°C. PCR products were analysed on 1% agarose gel and the bands visualised by ethidium bromide staining. All reagents for RT-PCR were purchased from Life Technologies.
The bands were quantified by densitometry using Kodak Electrophoresis Documentation and Analysis System 120 (EDAS) software (Eastmen Kodak Company, Rochester, New York, USA). The ratios of the band intensities of the PCR products from the standard RNA and target RNA were plotted against the starting number of standard RNA molecules using a double logarithmic scale, as previously described.39 In this way, the point at which the starting number of standard RNA transcripts is equal to the starting amount of cellular target RNA transcripts can be determined. This technique allows us to quantify the number of transcripts in a tissue to as low as 1000 transcripts per μg total RNA.
For those cytokines (IFN-γ and IL-4) that are produced entirely by T cells, we enhanced the discriminatory capacity of the PCR results by normalising the PCR comparisons to TCR mRNA.23
Statistical analysis
Data are expressed as mean (SEM). The χ2 test was used to compare the effect of clinical variables on endoscopic and histopathological grades of inflammation. The kappa statistic for inter-rater agreement was used to compare the endoscopic and histopathological grading of inflammation. Analysis of variance was used to compare values between multiple tissue types (ANOVA), and the Mann-Whitney test was used to identify specific differences. p<0.05 was required for significance.41,42
RESULTS
Patient demographics
The mean age of the three patient groups was not statistically different but there was a difference in sex ratio such that female patients predominated in the group with reflux symptoms who had a normal oesophagus whereas patients with Barrett's oesophagus were predominantly male, consistent with previous reports (table 1).43 For patients with Barrett's oesophagus, acid suppression achieved with PPI medication was effective at relieving symptoms (p<0.05) (table 1).
Demographic data for the four patient groups
Endoscopic and histopathological inflammatory responses
By definition, the group with a normal oesophagus had no endoscopic or histopathological evidence of inflammation. In the oesophagitis group there was a range of endoscopic grades of oesophagitis and all cases were confirmed histopathologically with an inter-rater reliability score κ=0.53 (table 2). Five patients had non-healing oesophagitis (two associated with a stricture) despite receiving a PPI.
Degree of endoscopic and histopathological inflammation
Since 56% of patients with Barrett's oesophagus were receiving a PPI, the degree of inflammation was analysed separately according to their medication (table 2). The group not on a PPI included 17 patients on no acid suppressants for one month and five patients taking a H2 receptor antagonist who continued to have heartburn symptoms and who were unlikely to be adequately acid suppressed.44 The notable finding was that there was no endoscopic evidence of inflammation within the Barrett's segment in approximately 60% (29/50) of patients whether or not they were receiving a PPI (18/28 on a PPI, 11/22 not on a PPI). The degree of light microscopic inflammation tended to be greater than the endoscopic grade of inflammation, similar to studies in oesophagitis.45 The lack of correlation between the histopathological score of inflammation and macroscopic appearances is reflected in the inter-rater reliability score κ=0.20 (NS). Overall, the histopathological degree of inflammation was either mild or moderate in the majority of patients with less than 10% (4/50) having evidence of severe (grade 4) inflammation (table 2). Interestingly, even in the absence of inflammation within Barrett's oesophagus, 60% of patients had histopathological evidence of oesophagitis above the Barrett's segment.
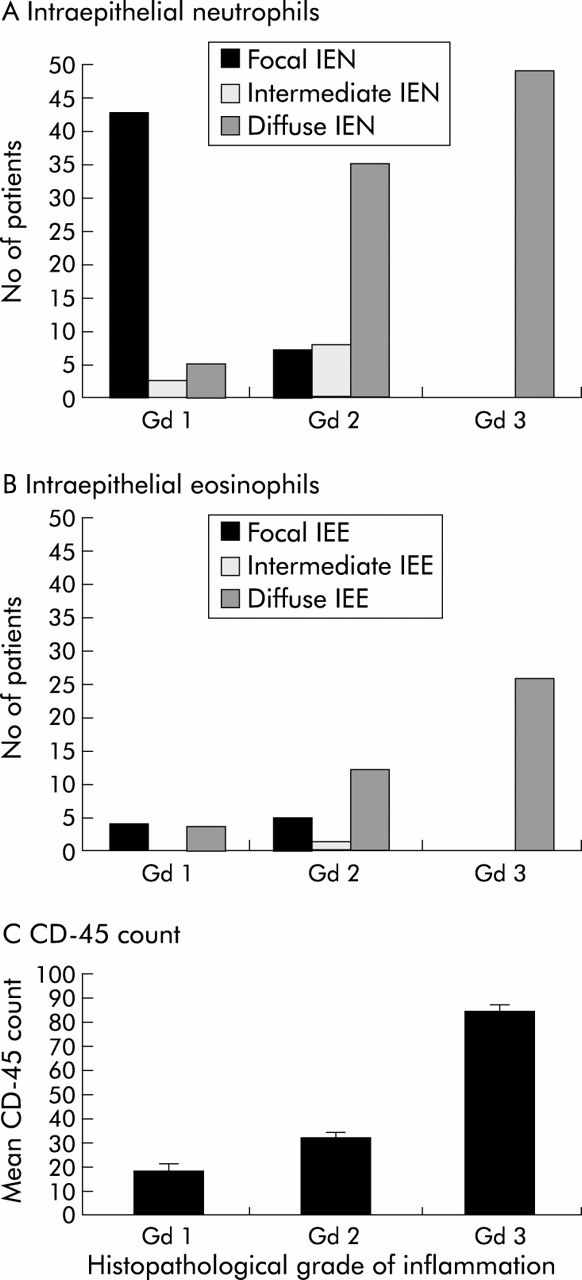
The intraepithelial cell infiltrate in Barrett's oesophagus consisted of T lymphocytes, neutrophils, and some eosinophils similar to previous reports in oesophagitis.46,47 The total CD-45 count (non-specific inflammatory marker), as well as the number of intraepithelial inflammatory eosinophils and neutrophils correlated with the light microscopic grade of inflammation, suggesting that the histopathological grading system adapted from the Sydney system was objective (p<0.05) (fig 1).

In patients with Barrett's oesophagus, the relationships between histopathological grade (Gd) of inflammation and the degree of intraepithelial neutrophil (IEN) infiltration (A, n=50), intraepithelial eosinophil (IEE) infiltration (B, n=50), and the CD-45 count (C, n=20) are demonstrated. Diffuse IEN, diffuse IEE infiltration, and the CD-45 count exhibited a positive correlation with the degree of light microscopic inflammation (p<0.05).
Characterisation of proinflammatory cytokine profiles between patient groups
The number of TCR transcripts was analysed as a surrogate marker of inflammation. TCR levels were significantly elevated in oesophagitis compared with non-inflamed squamous oesophagus, Barrett's oesophagus, and gastric antrum or duodenum patient controls (p<0.001) (figs 2, 3). A similar pattern of expression was observed for the proinflammatory cytokines IL-1β, IL-8, and IFN-γ (figs 2, 3). The cytokines IL-1β and IL-8 were highly expressed in all grades of oesophagitis in the range of 106 transcripts/μg tissue total RNA with levels that were 3–10-fold higher than those seen in patients with Barrett's oesophagus (IL-1β, p<0.001; IL-8, p<0.005). Levels of IFN-γ, a prototypical Th-1 cytokine which potentiates macrophage function and mediates direct inflammatory effects, were similarly increased in oesophagitis (p<0.05).

Number of molecules of mRNA per μg total RNA for T cell receptor (TCR) (A) and the three proinflammatory cytokines interleukin (IL)-1β (B), IL-8 (C), and interferon γ (IFN-γ) (D). The patient groups examined were: non-inflamed squamous oesophagus (NO), oesophagitis (O), and Barrett's oesophagus (BO). Samples from non-inflamed gastric antrum (GA) and duodenum (D) from each of the three groups were taken as within patient controls. Note that the scale is different for IFN-γ due to the lower levels of cytokine expression. Sample number was 10–20 for all tissue groups studied. *p<0.05, **p<0.005.

Representative gels for T cell receptor (TCR) (A) and the three proinflammatory cytokines interleukin (IL)-1β (B), IL-8 (C), and interferon γ (IFN-γ) (D). In each case one band represents the synthetic/standard RNA in reducing quantities and the other band represents the target cytokine specific RNA. The point of approximate equal competition is indicated by an arrow. The more abundant the cytokine being analysed the greater the amount of synthetic RNA being competed for and hence the point of equal competition is further to the left hand side of the gel. NO, non-inflamed squamous oesophagus; O, oesophagitis; BO, Barrett's oesophagus.
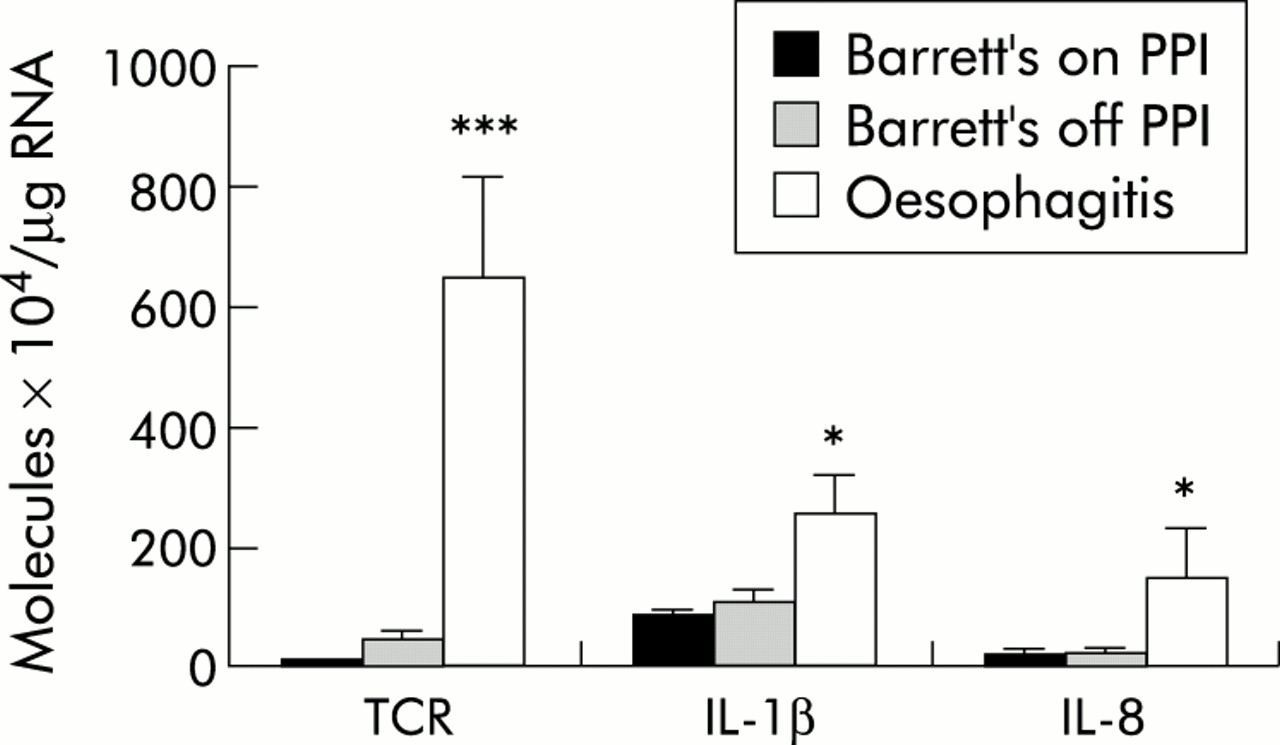
To establish whether the low levels of proinflammatory cytokines observed in Barrett's oesophagus are secondary to reduced acid reflux, cytokine expression was analysed according to whether patients were taking a PPI. There was no significant difference in TCR, IL-1β, or IL-8 levels in Barrett's oesophagus patients receiving or not receiving PPIs. Furthermore, proinflammatory cytokine levels in all Barrett's specimens were significantly less than those seen in oesophagitis specimens (p<0.05) (fig 4).

Levels of proinflammatory cytokine mRNA expression (T cell receptor (TCR), interleukin (IL)-1β, and IL-8) as a function of Barrett's oesophagus patient medication (PPI, proton pump inhibitor). The corresponding cytokine levels in oesophagitis patients are shown for comparison. Sample number was at least eight for all tissue groups studied. *p<0.05, ***p<0.001.
Characterisation of anti-inflammatory cytokine profiles between patient groups
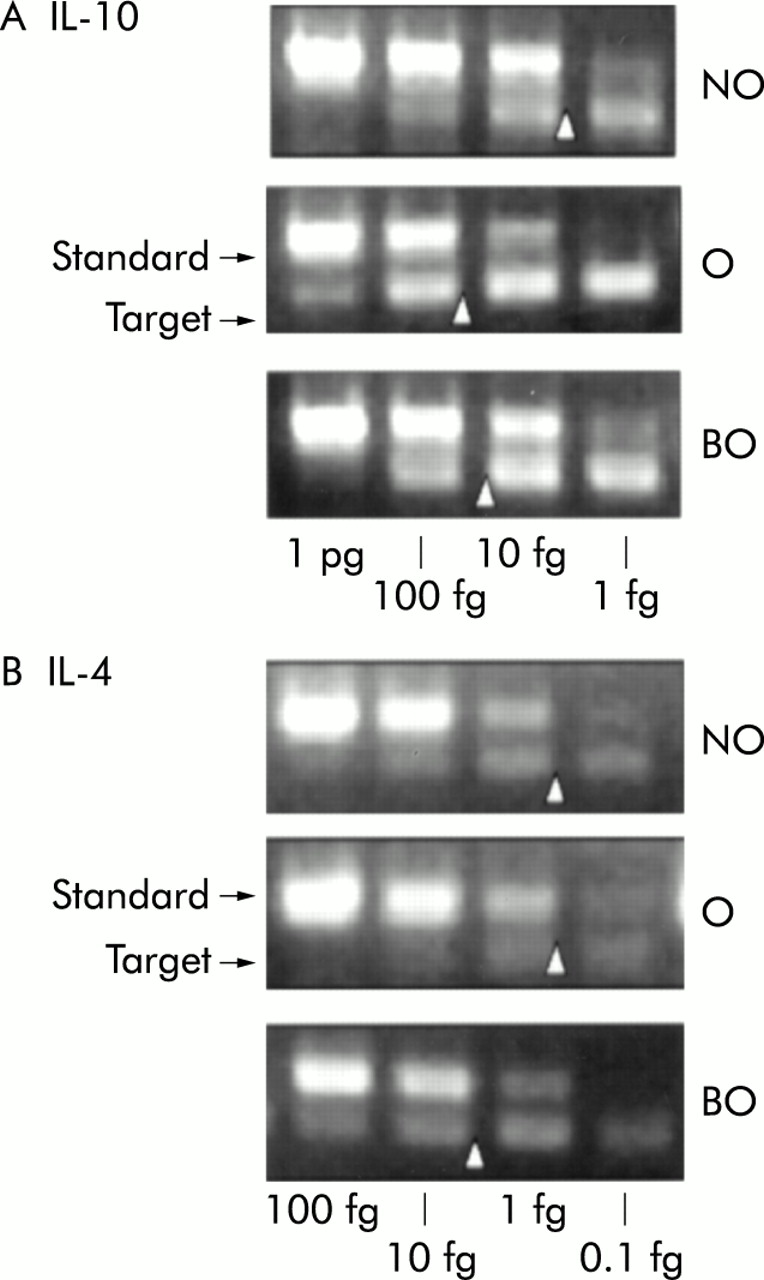
IL-4 and IL-10 are potent anti-inflammatory Th-2 cytokines. Overall, mRNA transcript levels of IL-4 and IL-10 were lower than those observed for the proinflammatory cytokines for all endoscopic samples studied (figs 5, 6). However, there were marked differences between groups. IL-10 levels were similarly increased in oesophagitis and Barrett's oesophagus compared with non-inflamed squamous oesophagus, gastric antrum, and the duodenum (NS). In contrast, IL-4, which is a cytoprotective cytokine48,49 important in altering the balance between Th-1 and Th-2 type responses,50,51 was increased fourfold in Barrett's oesophagus samples compared with non-inflamed and inflamed squamous oesophageal samples (p<0.05). When the cytokines produced exclusively by T cells were normalised for TCR expression, the dichotomy was even more striking with a greater than 100-fold increase in IL-4 expression in Barrett's oesophagus compared with squamous oesophageal samples (p<0.005) (fig 7).
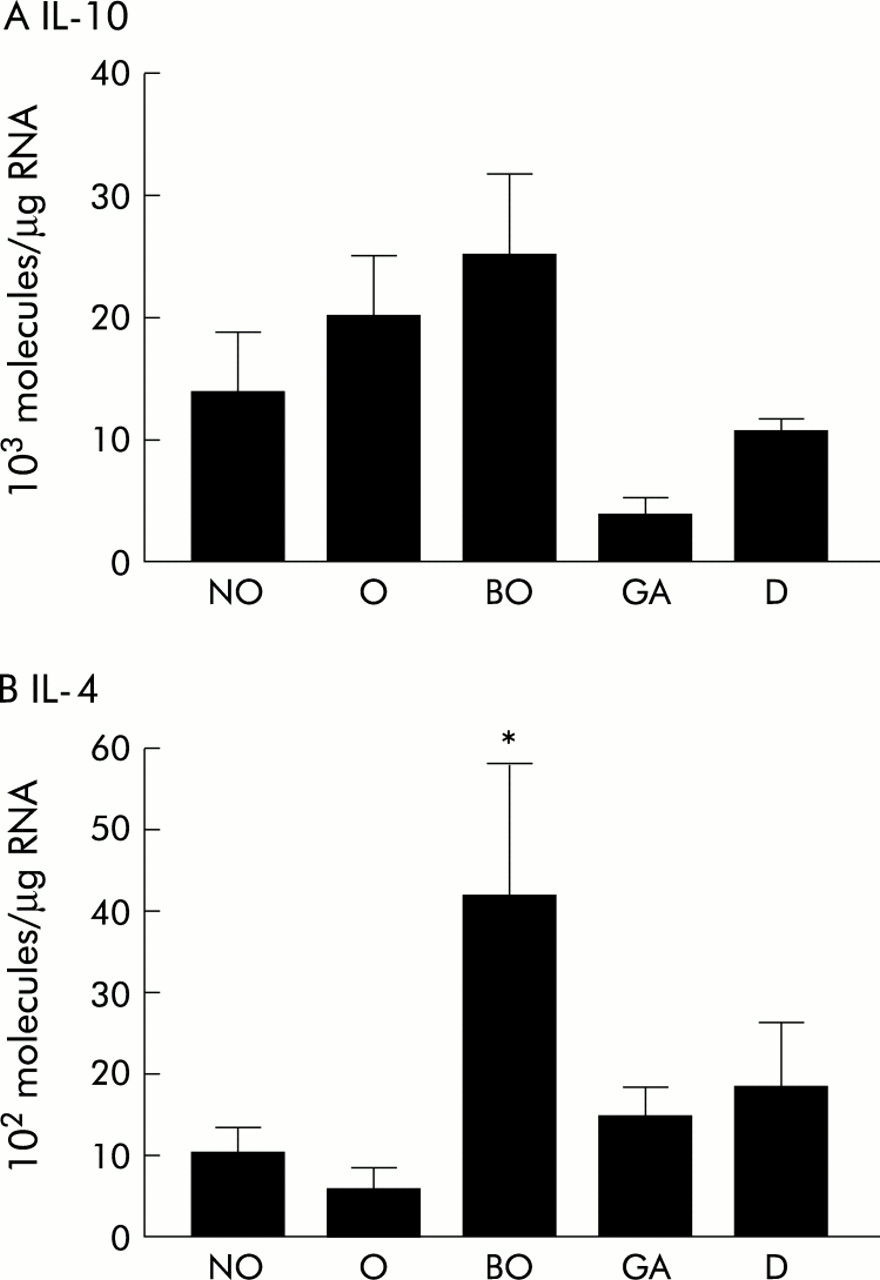
Number of molecules of mRNA per μg total RNA for interleukin (IL)-10 (A) and IL-4 (B) for three patient groups: non-inflamed squamous oesophagus (NO), oesophagitis (O), and Barrett's oesophagus (BO). Gastric antrum (GA) and the duodenum (D) were taken as within patient controls. Sample number was at least 10 for all tissue groups studied. *p<0.05.

Sample gels for interleukin (IL)-10 (A) and IL-4 (B). The amounts of synthetic RNA added to each reaction are shown at the top of the gel and the arrow represents the approximate point of equal competition. NO, non-inflamed squamous oesophagus; O, oesophagitis; BO, Barrett's oesophagus.

Number of molecules of interferon γ (IFN-γ) and interleukin (IL)-4 as a ratio of T cell receptor (TCR) expression for each of the following tissue samples: non-inflamed squamous oesophagus (NO), oesophagitis (O), Barrett's oesophagus (BO), gastric antrum (GA), and duodenum (D). **p<0.005.
Cytokines were also measured in squamous oesophageal samples taken 2 cm above the Barrett's oesophagus segment (data not shown). These biopsies had the cytokine profile of either non-inflamed squamous oesophagus or oesophagitis depending on the degree of inflammation present.
Cellular source of cytokines
Protein was detectable by immunohistochemistry for all of the cytokines examined and the degree of immunostaining between the different tissue types correlated with the relative differences found by competitive RT-PCR (figs 8, 9). However, due to the subjectivity of this method, the degree of immunostaining was not formally quantified but used instead to give an indication of the cellular source of cytokine production. Hence IFN-γ and IL-4 were produced exclusively by T cells in the lamina propria. In contrast, as well as production by inflammatory cells, there was some epithelial expression of IL-1β, IL-8, and IL-10. This was particularly marked in Barrett's epithelial cells for IL-8 (fig 8) and IL-10 (fig 9).

Representative examples of the cellular source of cytokine protein expression is shown by immunohistochemistry. Positive cells stain brown. The counterstain is haematoxylin and alcian blue staining has been used to highlight goblet cells in Barrett's oesophagus (C panels). (A) Expression of the proinflammatory cytokines (interleukin (IL)-1β, IL-8, and interferon γ (IFN-γ)) in oesophagitis (original magnification ×10). (B) High power views (×100) of these same cytokines in oesophagitis. (C) Expression of these cytokines in Barrett's oesophagus (×100). IL-8 was expressed by epithelial cells as well as by inflammatory cells in the lamina propria.
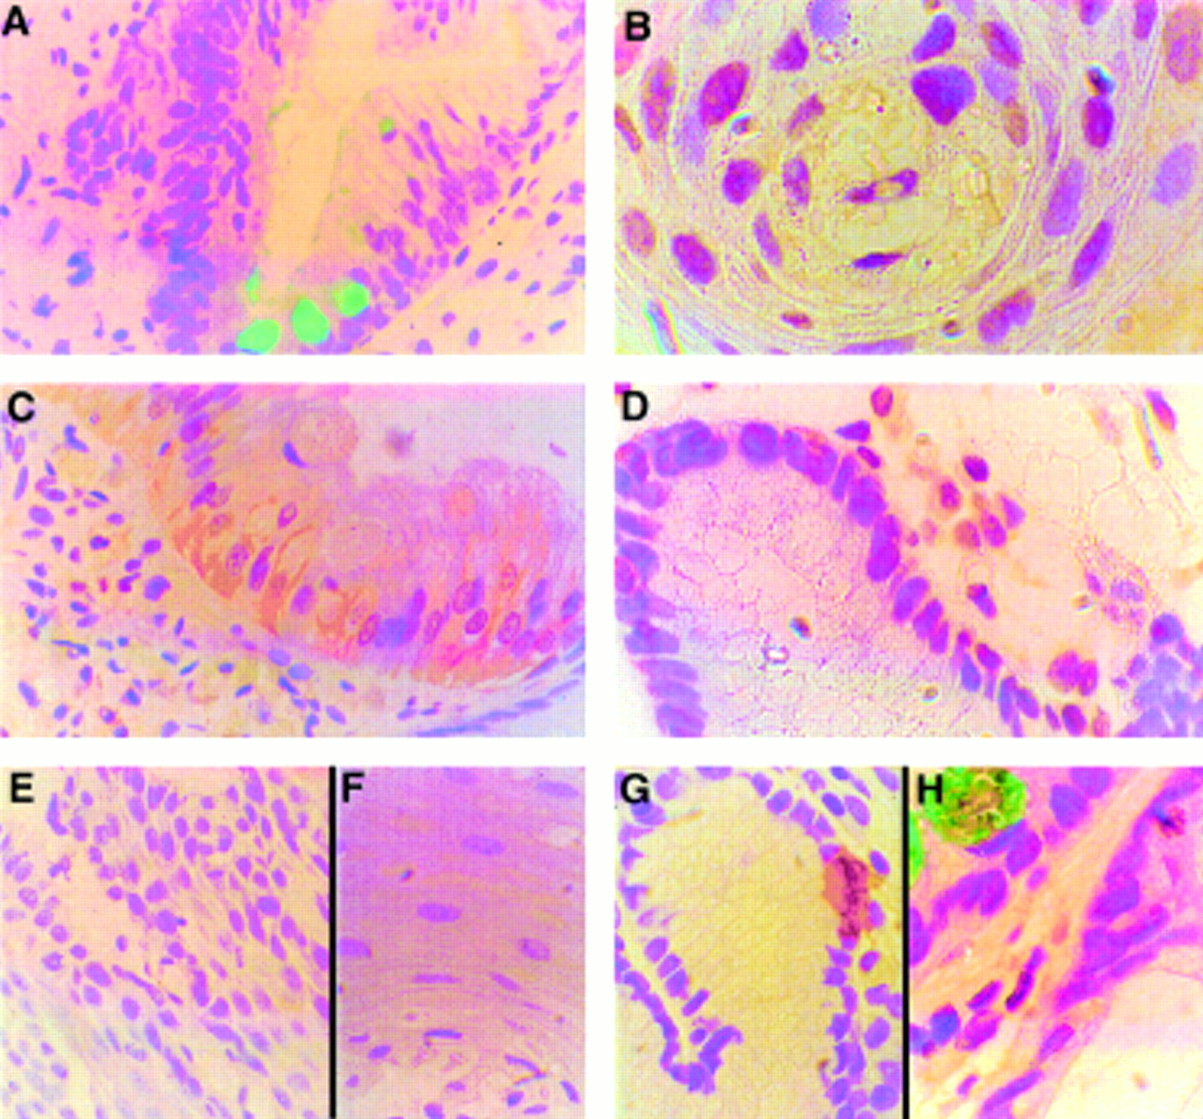
Representative immunohistochemical staining for interleukin (IL)-4 and IL-10. (A) Negative control (original magnification ×40). (B) Positive staining for IL-10 by epithelial and inflammatory cells in oesophagitis (×100). (C) Epithelial cytoplasmic cell expression of IL-10 in Barrett's oesophagus (×40). (D) Inflammatory cell staining for IL-10 in the lamina propria of Barrett's oesophagus. (E, F) Paucity of IL-4 expression in oesophagitis (E ×10 and F ×100 magnification of the same field). (G, H) Inflammatory cell expression of IL-4 in Barrett's oesophagus within the intraepithelial layer (G) and the lamina propria (H) (both ×100).
In order to confirm the epithelial cell layer as a potential source of cytokines, two oesophageal cell lines were examined for cytokine expression using immunofluorescence and competitive RT-PCR. We used OE-21 cells which are a squamous oesophageal carcinoma cell line which has multilayered, stratified, non-keratinising phenotype cells and TE7 Barrett's adenocarcinoma cells (see methods). These epithelial cell lines expressed IL-8 and IL-1β but not IL-10. The proinflammatory cytokine expression of IL-8 and IL-1β was higher in OE-21 (mean value for IL-8: 18×104 mRNA transcripts/μg total RNA and IL-1β: 27×105 mRNA transcripts RNA/μg total RNA) compared with TE7 cells (mean value for IL-8: 63×103 mRNA transcripts/μg total RNA and for IL-1β: 17×104 mRNA transcripts/μg total RNA). These results are in keeping with the high levels of IL-8 and IL-1β in squamous oesophagitis samples compared with Barrett's oesophagus biopsies.
DISCUSSION
In the present study we have demonstrated for the first time that the immunoregulatory environment is qualitatively and quantitatively different in oesophagitis and Barrett's oesophagus, and both differ from normal non-inflamed squamous oesophagus in patients with reflux symptoms. Oesophagitis is characterised by an acute inflammatory response with significantly increased levels of the proinflammatory cytokines (IL-1β, IL-8, and IFN-γ) compared with non-inflamed squamous oesophagus and Barrett's oesophagus. In contrast, in Barrett's oesophagus there is minimal endoscopic evidence of acute inflammation and the cytokines produced by the mild-moderate inflammatory cell infiltrate in the lamina propria are not characterised by a proinflammatory response. Instead, the cytokine profile of Barrett's oesophagus is characterised by a small relative increase in IL-10 compared with non-inflamed oesophagus, and a fourfold increase in IL-4 compared with squamous oesophagus which is highly significant as a proportion of the number of T cell transcripts (summarised in table 3).
Summary of the cytokine profiles by competitive reverse transcriptase-polymerase chain reaction
Effect of medication
Most initial endoscopies for reflux symptoms are performed when patients have been off PPI medication for at least two weeks so that an accurate diagnosis can be made. At subsequent endoscopies when patients are undergoing therapeutic procedures or surveillance for Barrett's oesophagus, patients continue to take their usual medication. For this study we recruited as many patients as possible who were off medication in order to reduce the confounding effect of acid suppression on levels of proinflammatory cytokines. In addition, we compared the inflammatory profile of Barrett's oesophagus patients undergoing surveillance endoscopy (n=28, on medication) as well as newly diagnosed patients (n=22, off medication). Interestingly, all patients with Barrett's oesophagus had low proinflammatory cytokine levels regardless of whether they were taking acid suppressants in the form of PPIs (fig 4).
In contrast, all patients with oesophagitis exhibited high levels of proinflammatory cytokines, including 5/26 patients who were receiving a PPI and 16/26 patients with mild oesophagitis (grades I and II).
Variation in mRNA levels
It is notable that there were considerable variations in mRNA levels between the cytokines studied. Specifically, mRNA levels varied from 106 molecules/μg RNA for IL-1β and IL-8 to 103–104 molecules/μg RNA for IL-4, IL-10, and IFN-γ. Variations in cytokine mRNA levels are in keeping with previous studies52,53 and are not surprising as specific cytokines have different levels of potency, variable half lives, and different gene activation pathways. For example, normal physiological mRNA levels of IL-4 are known to be 102–103 orders of magnitude lower than IL-1β as it is secreted by only 1–2% of T cells and trace amounts of this cytokine have the potential for greatly amplifying responses to a myriad of local stimuli.54,55 Moreover, it has been demonstrated that secretion of IL-4 protein closely follows accumulation of IL-4 mRNA.56 The fact that protein was detectable by immunohistochemistry and ELISA (data not shown) for all of the cytokines that we studied (figs 8, 9), confirms that the mRNA values are within the physiological range.
Clinical implications
The relative increase in IL-4 in Barrett's oesophagus compared with non-inflamed squamous oesophagus suggests that this may be a Th-2 (predominant anti-inflammatory) type response. While this is probably an oversimplification, increased levels of IL-4 have previously been shown to be important in determining the balance between Th-1 and Th-2 cells.57 Furthermore, the specific cytokine profile can have a direct effect on the epithelial cell phenotype both during epithelial tissue development as well as in the adult organ.58–60 For example, IL-4 has been shown to induce goblet cell metaplasia in airway epithelial cells,61 to reduce migration of neutrophils into and across epithelial monolayers,62and also to have a cytoprotective role.50,51
Epithelial metaplasias commonly occur in mucosa that has been damaged as a result of exposure to luminal contents.63 The mechanism for induction of metaplasia may involve local signalling pathways which activate dormant multipotential stem cells.63,64 This hypothesis is in keeping with the recent report that IL-1β polymorphisms are a determining factor for whether there is an intestinal metaplastic response of gastric epithelium to H pylori.27
It has been hypothesised that Barrett's oesophagus metaplasia develops as an adaptive epithelium in response to chronic damage by gastro-oesophageal refluxate.65 Our results support the concept of an adaptive response as IL-4 is a potent anti-inflammatory cytokine with cytoprotective properties.50,51 However, the difference in cytokine profile between Barrett's oesophagus and gastric or duodenal epithelia (table 3, figs 5, 7), suggests that the cytokine profile is not simply a reflection of the development of an intestinal phenotype. However, it is unclear whether the unique cytokine profile of Barrett's oesophagus is a causative factor driving the metaplastic process.
The distinct inflammatory environment in Barrett's oesophagus compared with oesophagitis may also be an important factor for the development of disease complications. For example, it is well recognised that the immunoregulatory environment may be critical in carcinogenesis.66–68 Furthermore, there is evidence from studies examining cytokines in the malignant progression of Barrett's oesophagus that epidermal growth factor and its receptor, as well as transforming growth factor α, may be overexpressed in Barrett's associated carcinoma.69,70
In conclusion, the different characteristics of oesophagitis compared with Barrett's oesophagus in terms of tissue morphology, degree of endoscopic and histopathological inflammation, and the different cytokine profiles imply that these are fundamentally different responses to reflux disease. Consequently, allocation of oesophagitis to grades 1–4 and Barrett's oesophagus to grade 5 in the frequently used Savary-Miller classification of reflux disease is misleading. Further study of the genetic and environmental factors that govern these diverse cytokine responses to reflux will increase our understanding of the aetiopathogenesis of associated oesophageal diseases.
Acknowledgments
This study was supported initially by the Association for International Cancer Research and is currently funded by the Medical Research Council. Dr RC Fitzgerald is an MRC clinician scientist. We are grateful to Cathy Driver for her help with the figures and to Jill Armani for her secretarial support.