Article Text

Abstract
Background and aims: The liver is a major site for the synthesis and actions of platelet activating factor (PAF), a potent hepatic vasoconstrictor and systemic vasodilator. As PAF is implicated in portal hypertension and hyperdynamic circulation associated with liver cirrhosis, we characterised changes in the hepatic PAF system in experimental cirrhosis.
Methods: In rats made cirrhotic by carbon tetrachloride (CCl4) administration for eight weeks, we determined hepatic levels of PAF and its cognate receptor, and the effects of PAF and PAF antagonist (BN52021) on portal and arterial pressure.
Results: Compared with control rats, cirrhotic rats had higher hepatic PAF levels, higher apparent hepatic efflux of PAF, and higher PAF levels in arterial blood (p<0.01, p<0.01, p<0.05, respectively). Relative to controls, cirrhotic livers had elevated hepatic PAF receptors (by mRNA and protein levels and [3H]PAF binding), higher (p<0.01) baseline hepatic portal pressure, and an augmented (p = 0.03) portal pressure response to PAF infusion (1 μg/kg). Portal infusion of BN52021 (5 mg/kg) showed that elevated endogenous PAF was responsible for 23% of the cirrhotic portal pressure increase but made no contribution to systemic hypotension. Finally, increased PAF receptor density was observed in the contractile perisinusoidal stellate cells isolated from cirrhotic livers relative to those from control livers.
Conclusions: In cirrhosis, increased hepatic release of PAF elevates systemic PAF; in combination with upregulated hepatic PAF receptors in stellate cells, this contributes to portal hypertension.
- cirrhosis
- platelet activating factor
- hepatic stellate cells
- endothelin
- portal hypertension
- liver
- PAF, platelet activating factor
- CCl4, carbon tetrachloride
- MAP, mean arterial pressure
- RT-PCR, reverse transcriptase-polymerase chain reaction
- SNK, Student-Newman-Keuls test
- ET-1, endothelin 1
- BSA, bovine serum albumin
- SDS-PAGE, sodium dodecyl sulphate-polyacrylamide gel electrophoresis
- DMSO, dimethylsulphoxide
- PGE2, prostaglandin E2
Statistics from Altmetric.com
- PAF, platelet activating factor
- CCl4, carbon tetrachloride
- MAP, mean arterial pressure
- RT-PCR, reverse transcriptase-polymerase chain reaction
- SNK, Student-Newman-Keuls test
- ET-1, endothelin 1
- BSA, bovine serum albumin
- SDS-PAGE, sodium dodecyl sulphate-polyacrylamide gel electrophoresis
- DMSO, dimethylsulphoxide
- PGE2, prostaglandin E2
Platelet activating factor (PAF: 1-O-alkyl-2-acetyl-sn-glycero-3-phosphocholine), a phospholipid, exerts diverse biological activities in various organs and isolated cells; its actions include platelet secretion and aggregation, bronchoconstriction, synthesis of mediators such as eicosanoids, increased vascular permeability, and systemic hypotension.1–6 PAF acts as a multifunctional soluble proinflammatory agent and as a specific membrane bound adhesion molecule.6–8 While systemic infusion of PAF reduces arterial blood pressure,9,10 PAF administered via the portal vein increases portal venous pressure both in the intact perfused liver11 and in the liver in vivo.12
Portal hypertension and hyperdynamic circulation are prominent features of human13,14 and experimental cirrhosis15; the circulatory responses to intravenous infusion of PAF in normal rats resemble the haemodynamic changes of advanced liver cirrhosis. The PAF content of the intact liver is elevated by various types of injury, including ischaemia-reperfusion,16 obstructive jaundice,17 and endotoxin exposure in vivo; a single injection of endotoxin into the mesenteric vein causes the hepatic PAF content to increase at three hours and return to control levels by 24 hours.18 The hepatic PAF response to endotoxin is important as endotoxaemia is a known consequence of cirrhosis. Endotoxaemia occurs 24 hours after carbon tetrachloride (CCl4) treatment of rats, and the antiendotoxin polymyxin B ameliorates CCl4 induced liver damage and lethality.19 Rats made fibrotic with CCl4 show decreased hepatic capacity to sequester and metabolise endotoxin.20 In human cirrhosis, the plasma endotoxin level is a significant negative factor in predicting short term (three month) survival.21
Other mediators may interact with the hepatic PAF system in cirrhosis. Endothelin 1 (ET-1) is a potent vasoconstrictor, the hepatic concentration of which is increased in human22,23 and experimental24,25 cirrhosis. ET-1 is implicated in the pathogenesis of cirrhosis and its complications22–27; it also stimulates PAF synthesis by Kupffer cells (resident hepatic macrophage28,29).
Villamediana and colleagues15 found that in the cirrhotic rat, PAF levels were elevated in systemic blood but made no measurements of the hepatic PAF system or altered hepatic responses to PAF. Marathe and colleagues30 reported increased hepatic PAF two hours after CCl4 administration but did not determine if the PAF content of the liver was elevated during chronic injury. Thus the contribution of endogenous PAF to hepatic and systemic complications of cirrhosis remains undetermined.
As Kupffer cells from cirrhotic rats have increased basal PAF synthesis compared with controls,29 we hypothesised that increased hepatic synthesis of PAF in cirrhosis contributes to increased systemic levels of PAF, which in turn play a role in the contractile component of portal hypertension. Our results confirm this and show that upregulated hepatic PAF receptors in cirrhosis increase the reactivity of the hepatic vasculature to PAF, exacerbating portal hypertension.
EXPERIMENTAL PROCEDURES
Induction of cirrhosis
Experimental protocols were approved by the University of Pittsburgh Institutional Animal Care and Use Committee as per the NIH guidelines. Cirrhosis was induced in male Sprague-Dawley rats (230–250 g) as described previously24,25 by intraperitoneal injections of CCl4 (0.15 ml/kg twice a week for eight weeks) with drinking water containing phenobarbital (0.4 g/l) ad libitum. Control rats received injections of the vehicle (peanut oil) and phenobarbital water.
Determination of portal venous and systemic arterial pressure
Animals were anaesthetised with pentobarbital 48 hours after the last CCl4 treatment, and femoral arterial blood pressure and portal venous pressure were determined essentially as described previously.25,31 After obtaining stable recordings of portal and arterial blood pressures, 2 ml of blood were drawn from the femoral artery, portal vein, and from the suprahepatic vena cava at the point of entry of the hepatic vein. The liver was then rapidly excised, superficial surfaces thoroughly washed in ice cold phosphate buffered saline containing 0.1 mM EDTA and 0.1 mM EGTA, and portions stored in 10% buffered formalin, OCT compound (Sakura Finetek USA Inc., Torrance, California, USA), or snap frozen in liquid nitrogen and stored at −80°C.
Determination of PAF in liver and blood
For lipid extraction, 100 mg of liver or 1 ml of whole blood were homogenised in 9.5 ml of methanol, chloroform, and water (2:1:0.8, v/v).32,33 The homogenates were kept at room temperature for one hour, mixed with chloroform (2.5 ml) and water (2.5 ml), and after one hour at room temperature, centrifuged (1200 g for 15 minutes). The chloroform layer was aspirated and dried under nitrogen at 35°C. The residue was dissolved in 200 μl of chloroform and applied to the BondElut SI column (Amersham-Pharmacia Biotech, Piscataway, New Jersey, USA). The column was washed with 3 ml of chloroform, 2 ml of chloroform-methanol (6:4, v/v), and 3 ml of chloroform-methanol-28% aqueous ammonia (70:85:7, v/v). PAF was eluted with 2 ml of chloroform-methanol-28% aqueous ammonia (50:50:7, v/v). The eluate was evaporated under nitrogen, and the residue was dissolved in 200 μl of saline containing 0.1% Triton X-100. PAF concentration was determined by [3H]PAF scintillation proximity assay (Amersham-Pharmacia Biotech).
Determination of hepatic PAF binding
Hepatic membranes were prepared as described previously24 and suspended in 50 mM Tris HCl (pH 8.0) containing 5 mM MgCl2, 125 mM choline chloride, 0.1 mM PMSF, 0.1 μg/ml leupeptin, and 1 μg/ml pepstatin. Membranes (100 μg protein) were incubated (final volume 0.3 ml) in 50 mM Tris HCl (pH 7.2) containing 5 mM MgCl2, 125 mM choline chloride, 0.25% bovine serum albumin (BSA), and 0.125–32.0 nM 1-O-[3H]octadecyl-2-O-acetyl-sn-glycero-3-phosphocholine (151 Ci/mmol; Amersham) ±10 μM unlabelled PAF (1-O-hexadecyl-2-O-acetyl-sn-glycero-3-phosphocholine; Bachem Americas, King of Prussia, Pennsylvania, USA) at 30°C for one hour.34,35 The reaction was terminated by addition of 5 ml of ice cold assay buffer, filtration through presoaked Whatman GF/C filters (Whatman, Hillsboro, Oregon, USA), washed thrice, and radioactivity was determined in a β scintillation counter.
Determination of hepatic levels of PAF receptor mRNA
mRNA expression of the PAF receptor was determined by semiquantitative reverse transcriptase-polymerase chain reaction (RT-PCR), as described previously.29,35 The reaction for PAF was carried out as follows: denaturation at 94°C (one minute), annealing at 60°C (30 seconds), and extension at 72°C (30 seconds) for 35 cycles35 as linearity was observed between 20 and 45 cycles. Reaction for β-actin (for normalisation) was carried out for 30 cycles, essentially as described previously.36 The PCR primers used were: PAF 5′-GCCACAACACAGAGGCTTGA-3′ (F) and 5′-TCCATTGCTCTGGGCAGGAA-3′ (R); and β-actin 5′-TTCTACAATGAGCTGCGTGTG-3′ (F) and 5′-TTCATGGATGCCACAGGATTC-3′. The PCR products were resolved in a 2.5% agarose gel and stained with SYBR Green I (FMC Biproduct, Rockland, Maine, USA). The gels were scanned under blue fluorescent light using a phosphorimager and band intensity was quantified using ImageQuaNT software (Molecular Dynamics, Sunnyvale, California, USA).
Western analysis of PAF receptor
The liver was homogenised in lysis buffer (0.1 M NaCl, 10 mM Tris-HCl, 1 mM EDTA) containing 0.5 mM PMSF and 25 μl/ml protease inhibitor cocktail (P-8340; Sigma Chemical Co., St Louis, Missouri, USA) and centrifuged at 500 g for 10 minutes. The supernatant equivalent to 20 μg protein was subjected to sodium dodecyl sulphate-polyacrylamide gel electrophoresis (SDS-PAGE) on a 12% SDS-PAGE and transferred onto Immobilon-P membrane (Millipore Corp., Bedford, Massachusetts, USA). Equal loading was confirmed by staining with Ponceau S. Non-specific binding was blocked by incubation in 1% BSA in phosphate buffered saline for two hours. The membrane was washed and incubated for two hours at room temperature with anti-PAF receptor polyclonal antibody (sc-8744; Santa Cruz Biotechnology, Santa Cruz, California, USA) (1:15 000 dilution). After washing, the membrane was incubated with antigoat IgG (Sigma Chemical Co.) for two hours at room temperature and washed. Detection was achieved using an ECL chemiluminescence kit (Amersham-Pharmacia). The intensity of the bands was determined by densitometry using ImageQuaNT software (Molecular Dynamics). To normalise the data, the membrane was stripped and the level of expression of a non-variant protein Erk 2 was determined using a polyclonal antibody (clone C-14; Santa Cruz). As an internal standard, we used ERK-2, which shows stable expression and has been used for this purpose both in vitro and in vivo.37
Determination of the effect of PAF or BN52021 on portal venous and systemic arterial pressure
After obtaining a stable recording of portal and femoral arterial pressure as described above, 1 ml of a solution (saline/0.25% BSA) containing PAF (1 μg/kg) was infused over one minute from a 975 Harvard apparatus compact infusion pump into the portal vein via a 23 gauge needle/PE50 catheter. Portal venous pressure and femoral arterial pressure were monitored continuously for 15 minutes. A stock solution of BN52021 (25 mg/ml) made in dimethylsulphoxide (DMSO) was diluted in saline and infused at 5 mg/kg (1 ml) as described above for the PAF infusion.
Isolation/culture of stellate cells and determination of PAF receptor
Stellate cells were isolated from cirrhotic and paired control rats by collagenase/protease digestion followed by separation on a Nycodenz gradient, as described previously.36,38 Cells were suspended in DMEM containing antibiotics, 10% fetal bovine serum, and 10% horse serum, plated at a density of 1×10⁶/2 cm2 in uncoated plastic dishes (Falcon), and used the following day.
PAF binding assay was performed as described previously.34,39 Cells were washed and incubated in 50 mM Tris HCl, pH 7.2, containing 5 mM MgCl2, 125 mM choline chloride, 0.25% BSA, and 0.0125–3.2 nM [3H]PAF ± 10 μM unlabelled PAF at 22°C for three hours. The reaction was terminated with addition of ice cold assay buffer, and then cells were washed twice and digested with 5% SDS. Radioactivity was determined in a β-scintillation counter.
For determination of PAF receptor mRNA expression, total RNA was extracted from the overnight culture of stellate cells. Preparation of cDNA and PCR for PAF receptor and β-actin were carried out as described above.
Determination of PGE2
Prostaglandin E2 (PGE2) was extracted from the culture medium and analysed by ELISA using a kit from Amersham-Pharmacia Biotech.
Data analysis
All data are presented as mean (SD). The Student-Newman-Keuls (SNK) test was used for statistical comparisons among multiple groups, and the Student’s t test for comparison between paired groups. A p value <0.05 was considered statistically significant.
RESULTS
General characteristics of cirrhosis
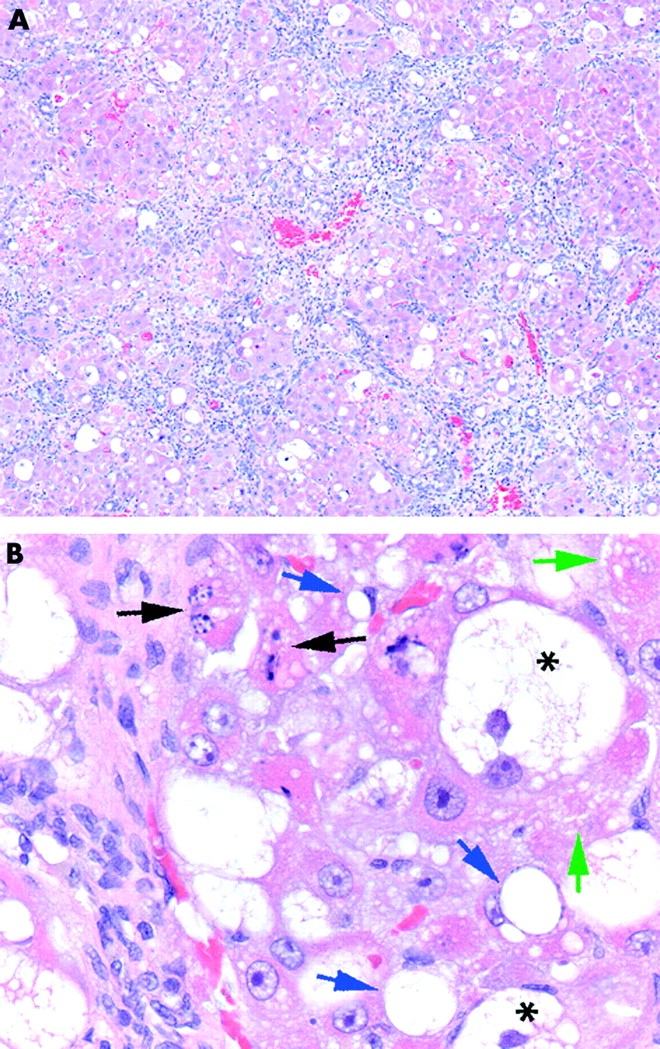
In the first experimental series (six animals per group) control rats showed no changes in liver histology over eight weeks.25,31 CCl4 treated rats developed complete liver cirrhosis accompanied by significant hepatocyte damage and inflammatory infiltration. The liver parenchyma was uniformly divided into small pseudonodules by intensive bridging fibrosis and displayed necroinflammatory damage consisting of inflammatory cell infiltration (mostly macrophages and a small number of neutrophils and lymphocytes). Acidophilic necrosis, apoptosis, hepatocyte hydropy, and fatty degeneration were also observed (fig 1). Liver injury was also illustrated by increased serum alanine aminotransferase levels (from 15 (1.7) to 298 (32) U/dl) and aspartate aminotransferase levels (from 68 (7) to 243 (12) U/dl) in cirrhotic rats.

Morphometric analysis of the cirrhotic liver. After eight weeks of carbon tetrachloride or vehicle treatment, liver tissue was fixed and stained with haematoxylin-eosin. (A) Complete liver cirrhosis with intensive bridging fibrous septum formation is visible. Fibrous septa uniformly affected hepatic tissue, dividing liver parenchyma into small pseudonodules. (B) Liver tissue displayed necroinflammatory damage consisting of inflammatory cell infiltration, both acidophilic necrosis (green arrows) and apoptosis (black arrows), as well as hepatocyte hydropy (*) and fatty degeneration (blue arrows).
The liver/body weight ratio was not significantly different between control and cirrhotic rats whereas spleen weight nearly doubled in cirrhosis (table 1). Mean arterial pressure (MAP) was significantly lower in cirrhotic than in control rats (82 (10) v 114 (9) mm Hg). Portal venous pressure was higher in cirrhotic rats than in control rats (12.2 (0.7) v 5.3 (0.6) mm Hg), indicating portal hypertension.
Changes associated with carbon tetrachloride (CCl4) induced cirrhosis
Effect of cirrhosis on hepatic and circulating PAF and on hepatic PAF receptor levels
Hepatic PAF concentration was unchanged after the first week of CCl4 treatment (control 2.70 (0.75) ng/g; CCl4 treated 2.74 (0.46) ng/g; p>0.05) but was increased after two weeks of CCl4 treatment from 2.64 (0.75) to 3.41 (0.68) ng/g (p<0.05). At two weeks, livers of CCl4 treated rats showed macrophage accumulation in areas of necrosis and partially destroyed hepatic architecture by bridging fibrosis (not shown but see Gandhi and colleagues25). At eight weeks, hepatic PAF increased by 44% in cirrhosis (table 1). In blood sampled from the femoral artery, portal vein, and hepatic vein, concentrations of PAF were all significantly greater in cirrhosis (fig 2). The increased PAF content of portal vein samples indicates that the gut is a significant additional source of PAF in cirrhosis. Calculated liver output (hepatic venous value−portal vein) differences were −0.3 (0.5) and 1.0 (0.6), respectively (p<0.003) for control and cirrhotic rats.
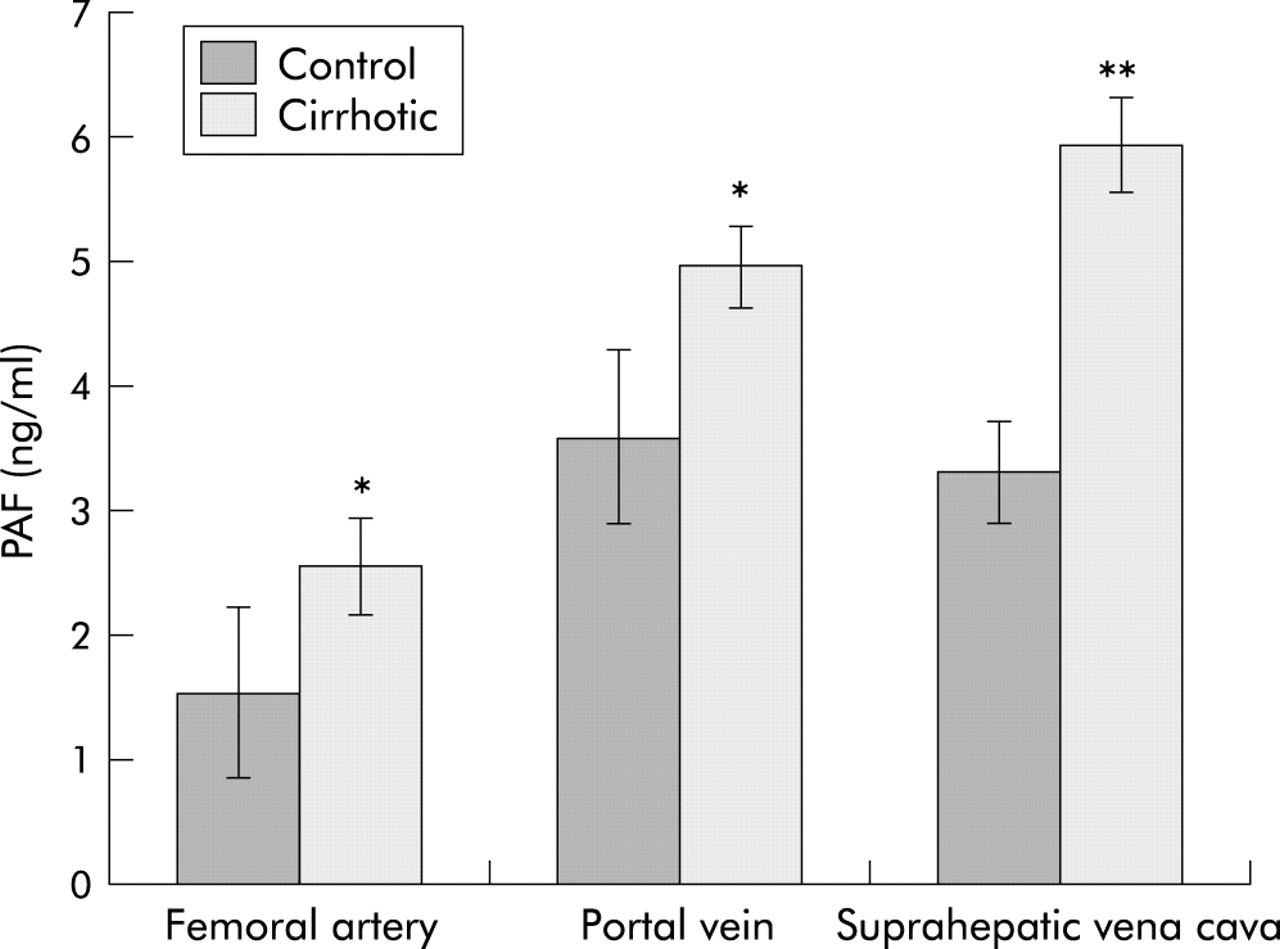
Effect of cirrhosis on circulating platelet activating factor (PAF) levels. Concentrations of PAF in blood drawn from the femoral artery, portal vein, and hepatic vein (suprahepatic vena cava) were determined, as described in the methods section. Values are means (SD) of 6–7 samples each. Differences among groups were significant at p<0.05 except for control portal vein versus control superior vena cava. *p<0.05 versus control; **p<0.01 versus control and p<0.05 versus portal vein.
Binding of [3H]PAF to hepatic membranes was determined in three independent experiments (fig 3A). Specific binding was significantly higher in cirrhotic rats. Binding data from fig 3 were fitted with the NIH Ligand program. The Kd for binding was essentially unchanged by cirrhosis (control 0.66 (0.03) nM; cirrhotic 0.58 (0.06) nM). However, Bmax increased 2.1-fold (control 235 (25) fmol/mg protein; cirrhotic 505 (5) fmol/mg protein). Comparable increases in PAF receptor mRNA transcript (fig 3B) and protein (fig 3C) were observed in the cirrhotic liver.

Effect of cirrhosis on hepatic platelet activating factor (PAF) binding and PAF receptor mRNA and protein. (A) Results of the binding assay to control and cirrhotic membranes. Specific binding was calculated as (total binding−non-specific binding). Values are means (SD) of three separate experiments: differences from control were statistically significant (*p<0.05 or **p<0.01). (B) Reverse transcriptase-polymerase chain reaction (RT-PCR) for PAF receptor (PAFR) mRNA was performed with cDNA prepared from RNA samples of control and cirrhotic rat livers. Expression of β-actin mRNA was assessed using the same amount of cDNA. PCR products of PAF and β-actin from control (CT) and cirrhotic (CR) rat livers are shown. (C) Protein expression of PAF receptor in control (CT) and cirrhotic (CR) liver. Expression of Erk 2 is shown to demonstrate equal loading.
Effect of PAF on portal pressure and arterial pressure in cirrhotic rats
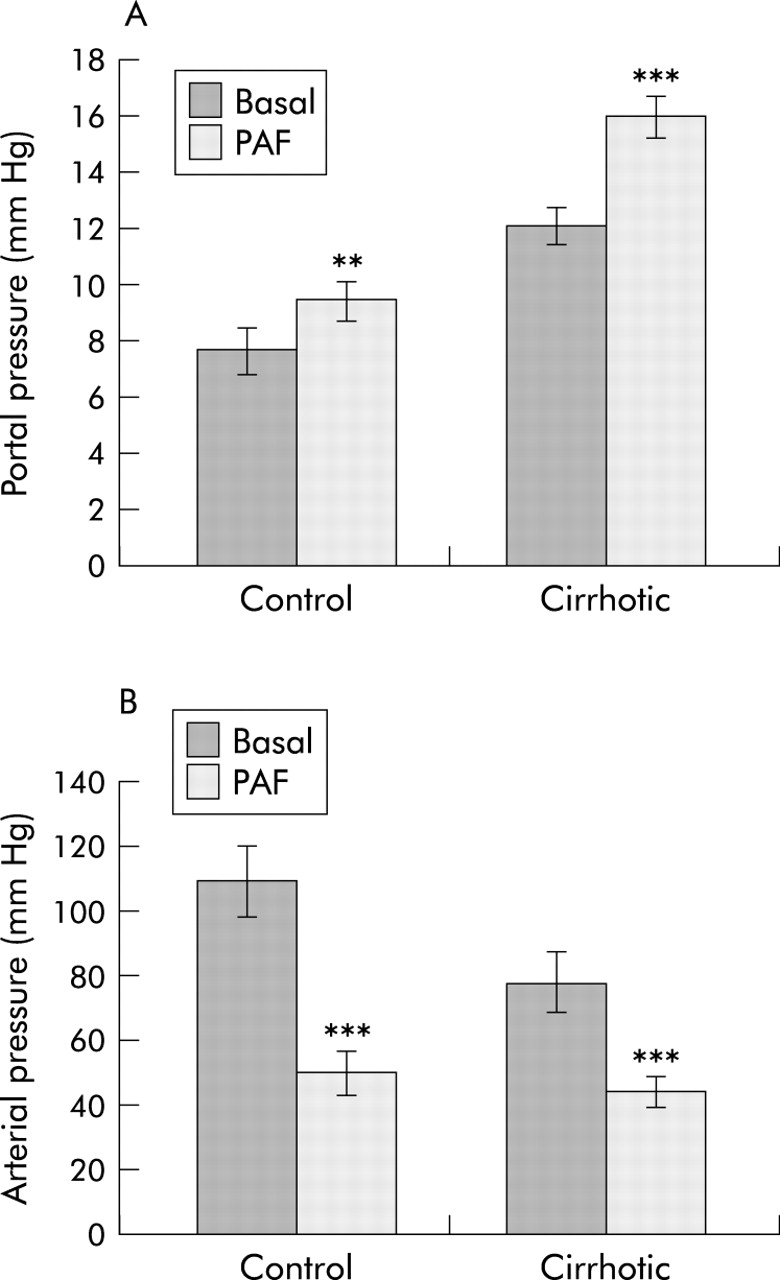
In the second experimental series, 11 cirrhotic rats were used, six infused with PAF and five with BN52021. For each treatment, equal numbers of control rats were used. Combined baseline portal pressures in this series were slightly higher. Infusion of PAF (1 μg/kg) via the portal vein increased (p<0.01) portal pressure in both cirrhotic rats (from 12.1 (0.6) to 16.0 (0.7) mm Hg) and control rats (from 7.7 (0.8) mm Hg to 9.5 (0.7) mm Hg) (fig 4). The PAF response was 4.1 (1.0) mm Hg in cirrhotic animals, significantly (2.3-fold, p<0.01) higher than the control response of 1.8 (0.3) mm Hg. Peak pressures for control and cirrhotic livers occurred respectively 1.1 (0.3) minutes and 1.4 (0.2) minutes after commencing PAF infusion, and pressures had reverted to their respective baselines by 5.1 (0.3) minutes and 4.8 (0.9) minutes.

Effect of cirrhosis on platelet activating factor (PAF) induced changes in arterial and portal pressure. Arterial and portal venous pressure, before (Basal) and after portal administration of PAF (PAF), were measured as described in the methods section. Values are means (SD) of four control determinations and six cirrhotic determinations. **p<0.01, ***p<0.001 versus basal value.
In contrast with the slow transient change in portal venous pressure, MAP fell within 15 seconds of PAF administration and did not recover during the monitoring period. In fig 4B, control plus PAF was not significantly different from cirrhotic plus PAF but all other differences between groups were significant (p<0.01 by the SNK test). The PAF response in cirrhotic rats (32.8 (7.9) mm Hg) was significantly less than that of control rats (59.2 (5.2) mm Hg). Portal infusion of the vehicle (saline/0.25% BSA) did not alter portal or systemic pressure in control or cirrhotic rats.
Effect of PAF antagonist BN52021 on portal and arterial pressure in cirrhotic rats
Administration of BN52021 via the portal vein caused a significant (p<0.01) decrease in portal pressure in cirrhotic rats (from 14.6 (1.6) to 12.3 (0.8) mm Hg; p<0.01) (fig 5). Pressure changes were essentially complete at 2.8 (0.5) minutes after commencing infusion, and were stable for an additional six minutes. In two additional cirrhotic rats with elevated portal pressure, infusion of DMSO vehicle caused no pressure changes. Arterial pressure in cirrhotic rats was unchanged by BN52021 (from 82.6 (6) to 85 (5) mm Hg). In control rats, BN52021 had no effect on either portal or arterial pressure.

Effect of BN52021 on femoral arterial and portal venous pressure of cirrhotic rats. After eight weeks of vehicle or carbon tetrachloride (CCl4) treatment, rats were anaesthetised and their femoral arterial and portal venous pressures determined. Following stabilisation (five minutes), BN52021 (5 mg/kg) was infused via the portal vein for one minute using a 23 gauge needle with the aid of a 975 Harvard compact infusion pump. Values shown are from six rats (mean (SD)) 5–6 minutes after introduction of BN52021 when the pressure stabilised to a constant value. *p<0.05 versus basal value.
PAF receptor in stellate cells
Parallel isolation procedures from control and cirrhotic livers yielded, respectively, quiescent hepatic stellate cells and septal myofibroblasts36: the latter are thought to derive from activated stellate cells (but see Cassiman and Roskams40). In any event, the septal myofibroblasts of fibrotic/cirrhotic liver are highly contractile and contribute to portal hypertension41; these cells contract in response to PAF.42 Scatchard analysis of the binding data (fig 6A) showed a higher Bmax for PAF receptor in stellate cells derived from the cirrhotic liver compared with cells from control livers (6.5 (1.5) v 2.5 (0.6) fmol/μg DNA; p<0.01), with no significant change in receptor affinity (Kd 361 (28) pM v 416 (53) pM). PAF receptor mRNA was also increased in cirrhotic stellate cells (fig 6B). As there is no reliable assay system for normal stellate cell contractility, we measured PAF dependent PGE2 synthesis, which was increased in cirrhotic stellate cells (table 2); basal synthesis was also increased. Exogenous PGE2 inhibits contraction of stellate cells in vitro, suggesting that PAF dependent PGE2 synthesis is a homeostatic mechanism limiting the contractile response.43
Effect of platelet activating factor (PAF) on prostaglandin E2 (PGE2) release by stellate cells

Effect of cirrhosis on platelet activating factor (PAF) binding and PAF receptor mRNA in stellate cells. (A) Results of the binding assay in control and cirrhotic stellate cells. Specific binding was calculated as (total binding−non-specific binding). Values are means (SD) of three separate experiments: differences from control were statistically significant (p<0.05 or p<0.01). (B) Reverse transcriptase-polymerase chain reaction (RT-PCR) for PAF receptor (PAFR) mRNA was performed with cDNA prepared from RNA samples of control and cirrhotic stellate cells. Expression of β-actin mRNA was assessed using the same amount of cDNA. PCR products of PAF and β-actin from control (CT) and cirrhotic (CR) rat livers are shown.
DISCUSSION
In the present study, PAF content of both the liver and systemic (femoral arterial) blood were elevated in cirrhosis, and therefore we asked whether the liver is a sink for systemic PAF or the predominant source of this mediator. In the intact perfused liver, endotoxin infusion causes PAF efflux18 favouring the second alternative. We have confirmed this in vivo: as hepatic venous blood is difficult to sample in cirrhotic rats, we took samples from the suprahepatic vena cava at the site of entry of the hepatic vein where hepatic efflux makes a major contribution to sample composition. In cirrhotic rats, PAF content of blood from the suprahepatic vena cava was increased significantly relative to samples from the portal vein. Thus cirrhotic rats, but not control rats, showed a positive apparent hepatic efflux of PAF.
Hepatic PAF increases within two hours of CCl4 administration30 but returns to control levels by one week (present study). Subsequent CCl4 administration re-establishes (two weeks: present study) and maintains an increased level of hepatic PAF. Potentially, PAF could be increased by a decrease in the activity of plasma PAF-acetylhydrolase, an enzyme predominantly responsible for hydrolysis of PAF to lyso-PAF.44,45 However, plasma PAF-acetylhydrolase activity is similar in normal individuals and in patients with alcohol induced liver cirrhosis46 while patients with primary and secondary biliary cirrhosis have elevated levels both of circulating PAF and of serum PAF-acetylhydrolase activity.47 This suggests that increased synthesis of PAF, and not decreased metabolism by plasma PAF-acetylhydrolase, is the mechanism by which circulating levels of PAF are elevated. Indeed, Kupffer cells (resident hepatic macrophage) isolated from cirrhotic rats release significantly more PAF than those from control rats.29 Hepatic endothelial cells48 and systemic macrophages recruited into the injured liver may also contribute to elevated hepatic PAF levels. Additionally, inability of the cirrhotic liver to metabolise gut derived PAF efficiently may also be a contributory factor as PAF concentration in portal venous blood was also greater in cirrhotic than in control rats.
In rats with secondary biliary cirrhosis, administration of PAF does not increase hepatic blood flow or (specifically) portal tributary blood flow10: thus increased portal pressure is predominantly an indicator of increased portal vascular resistance. In control rats, exogenous PAF significantly increases portal pressure10,12,49 (see also fig 4A); compared with controls, rats with hepatic fibrosis show an augmented (1.9-fold) hepatic vasoconstriction in response to PAF.50 The present study confirms that cirrhotic rats also show an augmented (2.3 fold) portal pressure response to PAF, which is subserved by a 2.1-fold increase in PAF binding in the whole liver.
Reduction in portal pressure by BN52021 measures the contribution of endogenous PAF. In control rats, this contribution to basal pressure is zero but in cirrhotic rats endogenous PAF is responsible for 23% of the cirrhosis dependent increase in portal pressure. Hepatic stellate cells are potential effectors of PAF induced increases in portal pressure: PAF is one of only six mediators currently known to cause coupled Ca2+i increase and contraction in these cells.42 In the present study, stellate cells from cirrhotic liver had a 2.6-fold increase in PAF receptor density and a 1.6-fold increase in PAF induced PGE2 synthesis relative to control cells, matching the augmented sensitivity to PAF of the intact organ. The smooth muscle component of the hepatic vasculature may also contribute51–53 to PAF induced increases in portal pressure.
While PAF induces smooth muscle contraction, paradoxically it induces arterial hypotension in all animal species studied.9,53–56 In the present study, the lowered arterial pressure in cirrhotic animals would be consistent with elevated systemic PAF, except that BN52021 had no significant effect on cirrhotic arterial pressure. This is in agreement with the work of Villamediana and colleagues15 who saw no significant effect of BN52021 on decreased MAP in cirrhotic rats, even though BN52021 normalised both decreased peripheral vascular resistance and increased cardiac output. In our hands, the ability of exogenous PAF to decrease arterial pressure in cirrhotic rats shows that the peripheral PAF system is still functional. Therefore, systemic hypotension in cirrhosis is not directly driven by elevated PAF but likely represents a long term adaptive change.
The hepatic concentration of the potent vasoconstrictor peptide ET-1 increases in human22,23 and experimental24,25 cirrhosis; this increase occurs within 24 hours of CCl4 administration, and progressively thereafter during the development of cirrhosis.25 In the present study, hepatic PAF was not increased after the first week of CCl4 treatment but was increased after two weeks of treatment. As Kupffer cells respond to ET-1 with increased PAF synthesis,28,29 the early elevation of ET-1 in vivo likely contributes to the long term increase in hepatic PAF. Moreover, Kupffer cells from cirrhotic rats are more sensitive to ET-1 showing increased ET-1 binding and increased ET-1-dependent PAF synthesis relative to controls.29
The close relationship between the PAF and endothelin systems in the cirrhotic liver encouraged us to calculate from a previous study25 the contribution of endogenous ET-1 to increased portal pressure in cirrhosis. This contribution (26%, using the ET-1 receptor antagonist TAK-044) is similar to that of PAF (23%, see above). As ET-1 increases PAF synthesis, one possibility is that PAF is the principal downstream mediator of the portal hypertensive effect of endothelin. However, if these two mediators have independent hypertensive effects, then taken together they account for half of the portal pressure increase in cirrhosis. Currently, combinations of ET-1 and PAF are being used to distinguish between these alternatives. If the second alternative is the case, then combined antagonism of ET-1 and PAF receptors may represent a near optimal strategy for decreasing elevated portal pressure in cirrhosis as much of the remaining increase is due to structural changes and is not remediable.
In summary, our results indicate that the cirrhotic liver is a source of elevated circulating PAF, partly as a consequence of changes in the endothelin system. Elevated circulating PAF contributes substantially to portal hypertension but does not contribute directly to arterial hypotension. Portal hypertension is exacerbated by upregulation of hepatic PAF receptors which makes the cirrhotic liver more sensitive to PAF.
Acknowledgments
This work was supported by a grant from NIH (DK 54411) and a VA Merit award. We thank Ms Kristin Anselmi for excellent technical assistance.