Article Text

Abstract
Background and aims: The causative molecular pathways underlying the pathogenesis of coeliac disease are poorly understood. To unravel novel aspects of disease pathogenesis, we used microarrays to determine changes in gene expression of duodenal biopsies.
Methods: cDNA microarrays representing 19 200 genes were used to compare gene expression profiles of duodenal biopsies from 15 coeliac disease patients with villous atrophy (Marsh III) and seven control individuals with normal biopsies (Marsh 0). In addition, the specific effect of gluten was studied by comparing the expression profiles of Marsh III lesions of seven patients exposed to gluten with four patients on a gluten free diet.
Results: Comparing Marsh III with Marsh 0 lesions identified 109 genes that differed significantly (p<0.001) in expression levels between patients and controls. A large number of these genes have functions in proliferation and differentiation pathways and might be important for correct development of crypt-villous units. Alterations in these pathways may lead to the characteristic hyperplasia and villous atrophy seen in coeliac disease. The analyses also revealed 120 differentially expressed genes (p<0.005) when comparing patients on a gluten free diet with those exposed to gluten. These genes further strengthen our observation of increased cell proliferation in the presence of gluten.
Conclusions: Our study provides new candidate genes in the pathogenesis of coeliac disease. Based on our results, we hypothesise that villous atrophy in coeliac disease patients is due to failure in cell differentiation. These genes are involved in pathways not previously implicated in coeliac disease pathogenesis and they may provide new targets for therapy.
- HLA, human leucocyte antigen
- M, Marsh
- Th, T helper
- RT-PCR, reverse transcription-polymerase chain reaction
- IFN, interferon
- IL, interleukin
- APC, antigen presenting cells
- microarray
- cell signalling
- chip
- expression profiling
- gene expression
- coeliac disease
Statistics from Altmetric.com
- HLA, human leucocyte antigen
- M, Marsh
- Th, T helper
- RT-PCR, reverse transcription-polymerase chain reaction
- IFN, interferon
- IL, interleukin
- APC, antigen presenting cells
Coeliac disease (OMIM 212750) is a chronic inflammatory enteropathy caused by lifelong intolerance to gluten in genetically predisposed individuals. When gluten, the main protein present in wheat, rye, and barley,1 is ingested by individuals expressing human leucocyte antigen (HLA)-DQ2 and/or -DQ8 heterodimers,2 it provokes a misdirected immune response in the small intestine where gluten is absorbed. This immune response leads to a series of histological changes resulting in lymphocytosis, crypt hyperplasia, and villous atrophy. These histological abnormalities, which were documented by Marsh in 1992,3 are characteristic of this disease and explain some of the clinical symptoms of coeliac disease patients. Treatment of coeliac disease consists of a lifelong gluten free diet, resulting in clinical recovery and histological normalisation of the intestine.
Coeliac disease is a multifactorial disorder for which both genetic and environmental factors are required for the disease phenotype to develop.4 The molecular pathways responsible for the disease pathogenesis are currently only partly defined.5 So far only one genetic factor has been identified, the HLA-DQA and -DQB gene cluster on chromosome 6.2 Although many attempts are underway to identify the other genetic factors involved in coeliac disease, traditional genetic mapping studies face serious limitations in identifying the full repertoire of susceptibility genes due to the small contribution of each individual susceptibility gene and the complex interplay between genetic and environmental factors. Genomics technologies, such as cDNA microarrays, are expected to provide additional insight into the molecular and cellular aspects of diseases.
Coeliac disease is a unique disease as the environmental factor, gluten, that triggers the disease is known and can be easily manipulated in vivo as well as in vitro. Moreover, the site of the lesion is easily accessible and small intestinal biopsies need to be taken from coeliac disease patients as part of the standard diagnostic procedure. In order to expand our understanding of the pathogenesis of coeliac disease, we set out to perform cDNA microarray analysis on a set of well characterised duodenum biopsies from coeliac disease patients with classic histopathology (Marsh III (MIII)) and control individuals (Marsh 0 (M0)). Microarray analysis is a powerful technique that allows the study of the level and pattern of expression of thousands of genes simultaneously.6
We first thought that comparing MIII with M0 biopsies might lead to the discovery of genes involved in the immune response to gluten and the long term tissue destruction seen in the small intestine of coeliac disease patients. Subsequently, we investigated the molecular changes that occur in MIII biopsies by comparing a collection of MIII biopsies from individuals who were on a gluten free diet with those on a gluten containing diet (that is, exposed to gluten).
We report two sets of genes that have not previously been associated with the pathogenesis of coeliac disease. Our results imply a role for novel candidate genes involved in the maintenance of the intestinal villi. As some of these genes map to chromosomal regions implicated in genetic mapping studies, they may represent possible causal candidate genes.
The combination of well characterised intestinal biopsies and cDNA microarrays is a unique method of studying the molecular and cellular events taking place in the initiation and further progression towards the mucosal transformation seen in coeliac disease. It has not yet been applied to this disease.
MATERIALS AND METHODS
Patients
Intestinal biopsies from 15 coeliac disease patients were included in the study. All biopsies showed MIII histology and were evaluated by one pathologist (JWRM) according to the modified UEGW criteria.7
Seven patients (patients 1–7, table 1) suspected of having coeliac disease were on a gluten containing diet when MIII villous atrophy was histologically confirmed.
Characteristics of coeliac disease, refractory gluten free diet type I patients, and controls included in the study
Another four coeliac disease patients (patients 8–11, table 1) were on a gluten free diet for a year and reported total clinical recovery although their intestines still showed MIII characteristics. A slight histological improvement was reported. In addition, biopsies were taken from the last group of four patients (patients 12–15, table 1), who were refractory coeliac disease type I patients.8 Biopsies of these four refractory coeliac disease type I patients showed MIII histology and no clinical improvement8 despite the fact that they were on a strict gluten free diet. A team of dieticians monitored compliance to the diet in all patients on a gluten free diet.
In addition, duodenum biopsies from seven individuals who had an endoscopic examination for other reasons were used as control samples. The histology of these tissue biopsies was completely normal (M0). Characteristics of the coeliac disease patients and controls included in this study are summarised in table 1.
The Medical Ethical Committee of the University Medical Centre of Utrecht approved the study. All patients, or the parents of paediatric patients, included in the study gave written informed consent.
Biopsy sampling and RNA isolation
For each individual, two to three biopsies (15–20 mg) were taken from the proximal duodenum by spike forceps endoscopy. Fresh tissue samples were snap frozen and stored in liquid nitrogen. Frozen biopsies were homogenised in TRIzol with glass beads of 1 mm diameter using a Mini-BeadBeater (BioSpec Products, Inc, Bartlesville, Oklahoma, USA), and total RNA was isolated using TRIzol (Gibco/Life Technologies, Rockville, Maryland, USA) following the manufacturer’s protocol. The quality and quantity of the RNA samples was determined using a 2100 Agilent Bioanalyzer (Agilent Technologies, Palo Alto, California, USA). Biopsies yielded an average of 3.6 μg of RNA/mg of tissue.
Microarray hybridisation
The seven controls and 15 coeliac disease samples were analysed by hybridisation screening of cDNA microarrays obtained from the University Health Network of Toronto, Ontario (Canada). Two different releases of slide sets, 19k2 and 19k3, containing 19 200 genes printed in duplicate on two glass slides were used for the experiments.
First strand cDNA was prepared from 10 μg of total RNA from biopsies and labelled with Cy3, as described by Van de Peppel and colleagues.9 A surgical specimen from the small bowel was used to generate a Cy5 labelled cDNA probe for use as a reference in all coeliac disease and control hybridisations. Between 200 and 300 ng of labelled cDNA from the biopsies and reference tissues were used for a single set of slides for overnight hybridisation. Slides were scanned in a ScanArray 4000 XL (Packard BioScience, Boston, Massachusetts, USA).
An MIAME compliant10 downloadable dataset and full details of the protocols are available at http://humgen.med.uu.nl/publications/CD/Microarrays/Diosdado_1.html or http://www.ebi.ac.uk/arrayexpress/, experiment accession No E-MEXP-42.
Image and data analysis
The scanned images were subjected to image analysis using the Dearray suite11 for IPLab SPECTRUM software (Scanalytics, Inc., Fairfax, Virginia, USA). The software, in a semi-automatic manner, identifies the fluorescent spots, subtracts the local background, and determines a quality score for each spot based on the spot’s intensity, size, local background, and uniformity of intensity within the spot.12 Based on these parameters, a quality score is assigned to each individual spot. All spots with a quality score >0.01 were selected for further processing.
To correct for differences in the efficiencies between the Cy3 and Cy5 channel, a method of global normalisation was applied. The quantified signal intensity for the entire array in both the Cy3 and Cy5 channels was averaged and equalised by applying a normalisation factor. Subsequently, this normalisation correction was applied to each individual spot and the red to green ratio was calculated.12 As genes are spotted in duplicate, the average of the 10log of the signal of each of the two copies of the same gene was calculated only when the quality score for both genes was >0.01. When only one copy of the gene had a quality score >0.01, only the level of expression of that gene copy was used.
Data analysis was performed with the GeneSpring package, version 4.2.1 (Silicon Genetics, Redwood City, California, USA). Genes whose expression was significantly different between two groups of biopsy samples were selected from the genes present on the slides by applying a Welch t test. Cluster analysis was performed using a supervised cluster algorithm.
Gene analysis
To further define the biological function of the selected genes, a homemade Java tool database was developed (Franke et al, in press) for data storage, gene classification, and gene analysis. This database also contains information on selected genes such as GeneBank accession No, Locus Link ID, chromosomal location, Emsembl ID, Unigene information, Gene Ontology, and GeneCards ID.
Data validation by real time RT-PCR
A selection of genes that showed altered expression in the microarray analysis was re-examined by real time reverse transcription-polymerase chain reaction (RT-PCR) to validate the changes observed in an independent manner. Firstly, cDNA was generated from 1 μg of total RNA using the High Capacity cDNA Archive Kit. PCR cycling was performed on a 7900HT Sequence Detection System in 25 μl SYBR Green PCR Master Mix using 25 ng of reverse transcribed RNA. Target genes were tested for using Assay-on-Demand Gene Expression products. The GUSB gene was used as an endogenous reference to control for expression independent sample to sample variability. Relative expression was determined from the obtained Ct values and the 2−ΔΔCt method.13 All equipment and reagents were purchased from Applied Biosystems (Foster City, California, USA) and used according to their protocols. Six genes (ALDOB, IL2RB, PDE7B, TM4SF4, TXN, and TYK2), together with the GUSB reference, were tested in duplicate on pooled cDNA from M0 normal controls (n = 16) and MIII coeliac patients (n = 15). The pooling method was used only after we had assessed that the mean of the data obtained with ALDOB tested on individual samples was similar to that of the pooled samples (table 2). This pooling method was in agreement with our experiences with various other genes not directly related to this study.
Relative levels of average gene expression levels in Marsh III coeliac patients versus normal controls, as determined by microarray hybridisation and validation by real time reverse transcription-polymerase chain reaction
RESULTS
Identification of genes differentially expressed in MIII biopsies versus M0 biopsies
In order to identify genes involved in the pathogenesis and therefore in the inflammatory and immune response evoked by gluten and leading to the tissue destruction observed in the duodenal biopsies of coeliac disease patients, the expression profiles of 15 MIII biopsies from patients were compared with seven M0 biopsies from control individuals. All biopsy RNA samples from MIII coeliac disease patients, including four refractory coeliac disease type I samples, were hybridised onto cDNA microarrays. A Welch t test with a threshold p value of <0.001 revealed no differentially expressed genes when comparing MIII refractory coeliac disease type I biopsies with MIII coeliac disease biopsies (data not shown). As these two groups could not be distinguished based on their expression levels, they were treated as a single group based on their histological characteristics.
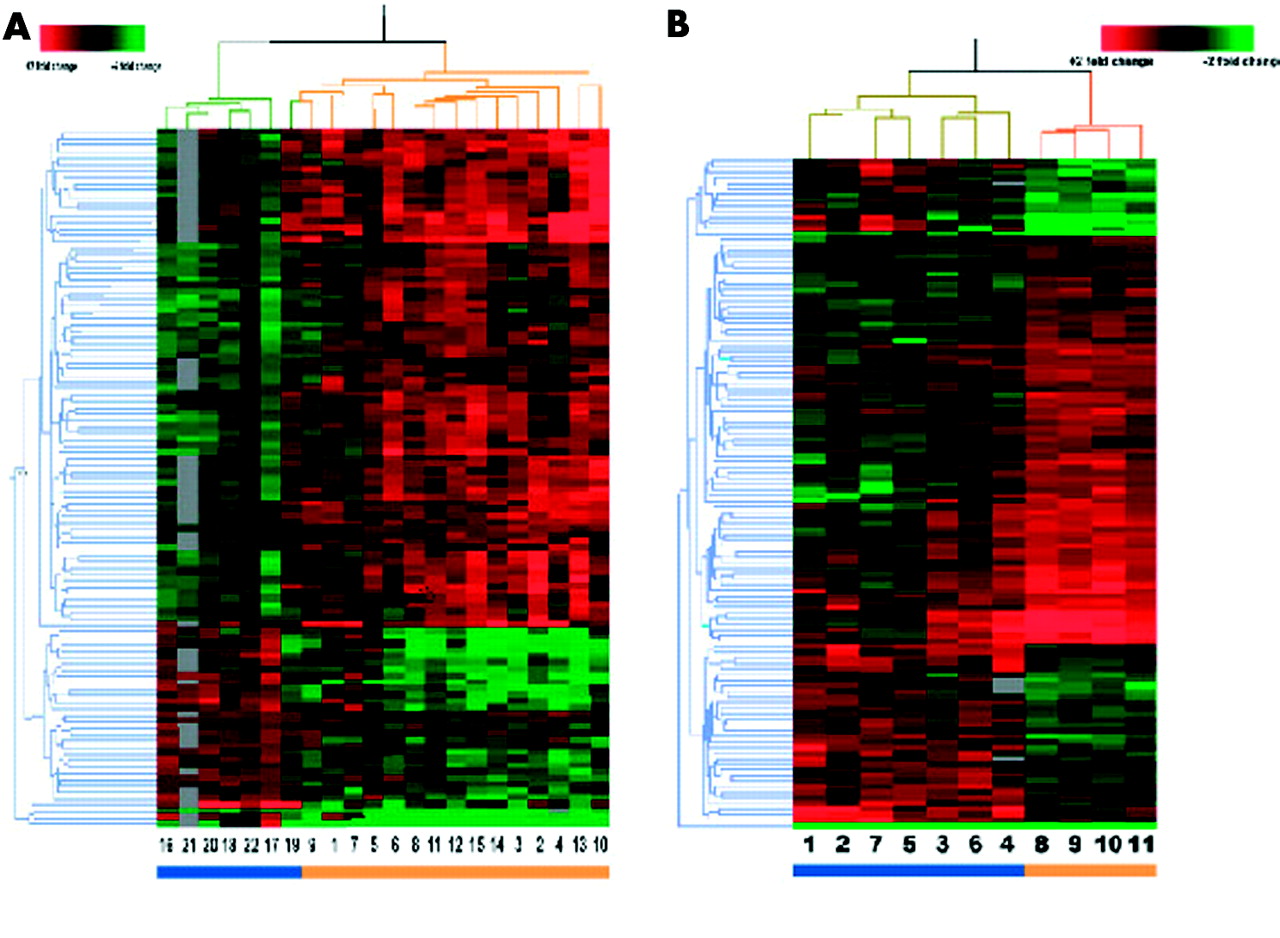
From all 19 200 genes present on the arrays, 10 674 had sufficient data for comparison (that is, genes with a quality score >0.01). A Welch t test with a threshold of p<0.001 was applied to the data set and 109 genes were identified to be differentially expressed between MIII and M0 biopsy samples. Approximately 11 genes were expected by chance alone. A distance measurement was used to define the similarity of the expression profiles for both the 22 samples and the 109 genes, and was depicted in a two dimensional hierarchical dendrogram (fig 1A). The hierarchical cluster analysis revealed two branches clearly separating the M0 and MIII biopsies, with the exception of control No 19 that clustered with the group of patient samples.

(A) Hierarchical clustering dendrogram of duodenal genes from Marsh III (MIII) and Marsh 0 (M0) biopsies. Clustering of 109 genes across 22 samples clusters the seven control samples (blue bar) separately from the 15 coeliac disease patients (orange bar). Each column represents a coeliac disease (MIII) or a control (M0) sample and each row represents an individual gene. For each gene, a green signal represents underexpression, black signals denote similarly expressed genes, a red signal represents overexpressed genes, and grey signals denote missing data. Information on these genes can be found in table 3 and on the website http://humgen.med.uu.nl/publications/CD/Microarrays/Diosdado_1.html. (B) Hierarchical clustering dendrogram of duodenal genes from MIII biopsies with or without exposures to gluten. Clustering of 120 genes across 11 samples clusters the seven samples of coeliac disease patients following a gluten containing diet (blue bar) separately from the four coeliac disease patients on a gluten free diet (orange bar). Each column represents a sample and each row represents an individual gene. For each gene, a green signal represents underexpression, black signals denote similarly expressed genes, a red signal represents overexpressed genes, and grey signals denote missing data. Information on these genes can be found in table 3 and on the website http://humgen.med.uu.nl/publications/CD/Microarrays/Diosdado_1.html.
Of these 109 genes, 76 (69.7%) had an increased level of expression in coeliac disease patients versus controls, and 33 genes (30.3%) had a decreased level of expression in coeliac disease patients versus controls. The molecular function was known or could be predicted for 46 of these 109 genes (table 3).
Annotated genes differentially expressed in Marsh III (MIII) versus Marsh 0 (M0), grouped according to their function*
Some of the differentially expressed genes result from the histological changes but a significant number of them result from the inflammatory response seen in MIII lesions of coeliac disease patients. The results from these experiments are consistent with the widely accepted T helper (Th)1 response.14 Although this observation in itself adds little new insight, it does replicate previous independent findings. Hence these observations support our results and thereby validate microarray technology as a useful tool in providing new insight into the pathogenesis of coeliac disease.
Although the key cytokines interferon (IFN)-γ and tumour necrosis factor α were not present on our slides, real time RT-PCR of the IFNG gene showed extremely high levels of expression of ∼30-fold in MIII biopsies versus M0 biopsies. Stimulation of the interleukin (IL)-2 signalling pathway was further suggested by increased expression of the IL-2 receptor beta (IL-2RB) gene which was validated by real-time RT-PCR (table 2), a member of the RAS oncogene family (RAB1B), chromosome 20 open reading frame 64 gene (C20orf64), and the RAP1, GTP-GDP dissociation stimulator 1 gene (RAP1GDS1). Furthermore, the nuclear factor κB pathway seems to be induced, as suggested by upregulation of the thioredoxin (TXN) gene and the lymphocyte cytosolic protein 1 (LCP1) gene. Genes involved in complementary functions, such as complement component 8 β polypeptide (C8B) and the H factor 1 (HF1), were downregulated, suggesting depletion of complement components.
Upregulation of both the TXN and the macrophage scavenger receptor 1 (MSR1) genes in MIII versus M0 provides evidence for the presence of active macrophages at the lesion site. MSR1 is expressed by antigen presenting cells (APC) and mediates activation of T cells and promotes adhesion of activated B cells.15,16 It has also been suggested that MSR class A is involved in the breakdown of the T cell self tolerance in mice.17,18 TRX enhances the immune response by facilitating both a microenvironment for APCs and for T cell interaction. It has been further proposed that TRX acts as coadjuvant in cytokine mediated lymphocyte proliferation between the APC which presents the gluten to the CD4+ T cells.19 Upregulation of TRX was validated by real time RT-PCR (table 2).
Many genes coding for proteins involved in lipid metabolism and cholesterol homeostasis, such as ATP binding cassette, subfamily A, member 7 (ABCA7), apolipoprotein A-II (APOA2), and diaphorase (NADH) (DIA1), were upregulated in MIII biopsies whereas hydroxy-delta-5-steroid dehydrogenase, 3 beta- and steroid 1 (HSD3B1) was downregulated. Expression studies have shown that γδ T cells differentially express a large number of genes involved in lipid and cholesterol homeostasis, implying that such cells may be involved in these mechanisms.20 One of the histological characteristics of MIII coeliac disease biopsies is the presence of high numbers of intraepithelial γδ T cells.3 Hence these results may reflect the increased number of γδ T cells in the intestines of coeliac disease patients. Alternatively, increased expression of lipid and cholesterol genes may point to increased biosynthesis of lipid bilayers. In both cases, upregulation of these genes may be due to an increase in the number of cells and not to upregulation “per cell” of these genes.
Downregulation of the transmembrane 4 superfamily member 4 gene (TM4SF4), which by real time RT-PCR turned out to be down-regulated eightfold (table 2), and upregulation of the retinol binding protein 4 gene (RBP4), are both consistent with increased proliferation of cells in MIII biopsies. Also, upregulation of annexin A6 (ANXA6), synaptopodin (KIAA1029), and the solute carrier family 9 isoform 3 regulatory factor 1 (SLC9A3R1) genes suggests an increased number of cells in early differentiation.
In summary, the differentially expressed genes point towards an increased number of γδ T cells and macrophages at the lesion site, a Th1 response, and increased cell proliferation.
Differential gene expression in MIII biopsies in response to gluten withdrawal
To identify genes specifically involved in the response to the environmental trigger gluten, MIII biopsies were subsequently divided into two groups. Four MIII biopsies from coeliac disease patients who were on a gluten free diet for one year were compared with seven MIII biopsies from patients who were following a gluten containing diet at the time of biopsy. The four biopsies of the refractory coeliac disease type I patients were excluded from this analysis as these patients do not show clinical and histological improvement on gluten withdrawal, and so different molecular events may be occurring in their biopsies.
A Welch t test was applied to 11 938 genes that had sufficient data for comparison; 120 genes showed differential expression at a threshold p value <0.005 (table 4). We are aware of the limitations of this small number of samples. This experimental design is therefore less robust than the MIII versus M0 comparison as the number of genes to be expected by change alone would be 60. Although the data should be interpreted with care, the general picture that emerges from the data may give inroads into the effect of gluten on the intestine. A two dimensional hierarchical cluster showed a dendrogram tree (fig 1B) in which the four patients on a gluten free diet clearly clustered separately from the seven patients on a gluten containing diet.
Annotated genes differentially expressed in Marsh III (MIII) biopsies with or without gluten, grouped according to functional pathways*
Of these 120 genes, 46 (38.3%) were downregulated and 75 (62.5%) were upregulated in patients on gluten versus coeliac disease patients refraining from gluten. Functional annotation was available for 42 of the 120 genes. Interestingly, the majority of the differentially expressed genes suggest transcription is enhanced and mitotic activity is suppressed in MIII coeliac disease patients who refrain from gluten.
Several of the genes were related to cell division and cell cycle processes. The cyclin G1 (CCNG1) gene was downregulated, indicating that less cells go from the G1 to S phase. Both the delta-tubulin (LOC51174) and kinesin family member 5B (KIF5B) genes were also downregulated. These two genes play a role in spindle formation. In addition, genes related to transcription such as general transcription factor IIH, polypeptide 1 (GTF2H1), polymerase II RNA subunit C (POLR2C), DNA polymerase delta subunit 3 (POLD3), zinc finger protein 26 (ZNF26), and the zinc finger protein 317 (ZNF317) were all upregulated.
DISCUSSION
Coeliac disease is a chronic inflammatory disorder triggered by dietary gluten that shows major manifestations in the small intestine although other organ systems may also be involved. Coeliac disease is an HLA associated disease and over the past years our understanding of the role of both HLA-DQ2 and -DQ8 molecules and gluten polypeptides has been enhanced tremendously.2 Nevertheless, a detailed understanding of the molecular events that take place in the intestine of genetically susceptible individuals is lacking, as well as insight into the order in which the events occur and other genetic factors that are known to be important determinants of the disease. To unravel novel aspects of the pathogenesis of coeliac disease, cDNA microarray technology was used to monitor expression of thousands of genes simultaneously. The results from this study confirm earlier studies that coeliac disease is a Th1 mediated disease,4,21 as evidenced by upregulation of the IL-2 pathway. Interestingly, novel genes are being identified that have not been proposed previously as being important determinants of the pathogenesis of coeliac disease. These genes yield new insights into the molecular processes underlying the flattened mucosa.
Prolyl endopeptidase
The most notable gene differentially expressed in a comparison of coeliac disease patients on a gluten containing diet versus those on a gluten free diet, is prolyl endopeptidase (PREP). The PREP gene encodes a cytosolic prolyl endopeptidase that efficiently hydrolyses proline rich fragments such as gliadin. PREP is upregulated in coeliac disease patients on a gluten containing diet compared with patients adhering to a gluten free diet. Furthermore, its levels of expression stay elevated in controls. Interestingly, this gene was also shown to be upregulated in seven control samples not on a gluten free diet compared with four biopsies from coeliac disease patients on a gluten free diet (p<0.003) and, to a lesser extent, when compared with the four refractory coeliac disease samples on a gluten free diet (p<0.025). This observation indicates that it is the presence of gluten in the intestine which modulates expression of this gene. It has been hypothesised that prolyl endopeptidase cleaves gliadin in small fragments in the intestine.22 We hypothesise that, in coeliac disease patients, the activity of this molecule may be impaired and therefore it does not cut gliadin into sufficiently small fragments to create motifs long enough to be recognised by reactive T cells.22 It has been proposed that a bacterial prolyl endopeptidase from Flavobacterium memningoseticum may be a target for future treatment of coeliac disease patients.23 Further research should be done in order to elucidate the mechanisms controlling activation and expression of this protein in the intestines of normal and coeliac disease patients.
Molecular mechanisms controlling hyperplasia and villous atrophy in MIII biopsies
Enterocytes, one of the main components of the villous, arises from pluripotent stem cells located in the base of the intestinal crypts. When these pluripotent stem cells stop dividing, they complete their programme of differentiation and start migrating towards the apical part of the villous. Non-dividing epithelial cells located in the crypts of the small intestine that are ready to migrate and differentiate express the TM4SF4 gene.24 In vitro studies have suggested that TM4SF4 plays a crucial role in regulation of proliferation and differentiation along the crypts by inhibiting proliferation of cells at the boundary of the crypt and villous. We observed an eightfold decrease in the level of expression of the TM4SF4 gene in MIII biopsies of coeliac disease patients versus M0 biopsies of controls, implying a block in early differentiation and failure to complete villous maintenance. Furthermore, increased expression of the RBP4 gene and significant upregulation (p<0.01) of the Eph related receptor tyrosine kinase B3 (EphB3) gene in MIII versus M0 biopsies was observed. EphB3 has recently been shown to be tightly regulated by the Wnt cascade and it has been suggested that this gene may play a decisive role in controlling not only proliferation and differentiation but also migration and location of cells along the crypts.25
Given these results, we propose that stem cells of the small intestinal crypts start proliferating but do not receive a signal to start differentiation, leading to the formation of undifferentiated hyperplastic crypts and subsequently villous atrophy. This theory is further substantiated by results from the second experiment in which MIII lesions with or without exposure to gluten were compared. The presence of gluten leads to increased mitotic activity, suggesting many proliferating cells. As soon as gluten is withdrawn from the diet, mitotic activity diminishes, suggesting that cells stop proliferating and, presumably, start differentiating. Although the histology still shows a MIII lesion, this event might actually be the first step towards normalisation of the intestine. We further propose that the separate processes of crypt hyperplasia and villous atrophy are molecularly intertwined and progression through different histological stages may be regulated by genes implicated in the control of cell proliferation and differentiation, such as TM4SF4.
So far, the early pathogenic events leading to villous atrophy have been suggested to be direct effects of cytokines, such as IFN-γ,21 or hypoxia.3 In addition, using an ex vivo model of fetal gut, Salmela and colleagues recently proposed that increased levels of metalloproteinases are important molecules for tissue remodelling and mucosal degradation in inflammatory bowel disease and coeliac disease.26 However, none of the 10 metalloproteinase family members, nor two of its inhibitors that were present on our slides, showed a significant change in expression level in MIII biopsies of coeliac disease patients (data not shown), implying that these molecules may not play a direct role in the tissue damage in vivo. Until now, all studies have proposed that villous atrophy is caused by destruction of enterocytes and, consequently, loss of structure of the villous. We propose that villous atrophy is not due to destruction of the villous but rather to the failure of crypt cells to differentiate into fully differentiated villous cells. As the cells seem to be capable of continuing proliferation, this might explain crypt hyperplasia.
We have successfully demonstrated the use of microarrays as a general approach to studying complex human diseases. Expression profiles of the selected biopsies propose known genes that participate in the pathogenesis of coeliac disease as well as new pathways that may play a potential role in disease initiation and progression. Our results suggest that crypt hyperplasia may be explained by distortion in the ratio between cell proliferation and cell differentiation of cells composing the crypt-villi units. Further investigations of the identified genes are required and will hopefully advance our understanding of the molecular mechanisms underlying coeliac disease. Finally, the finding that prolyl endopeptidase is differentially expressed in coeliac disease patients may provide new leads for therapy.
Acknowledgments
The authors thank Dr Frits Koning and Darius Stepniak for helpful discussions, Daniel Chan for helping with the illustration, Justin Fransen for the real time RT-PCR, Jackie Senior for critically reading the manuscript, and the coeliac disease families for their interest and collaboration. This work was financially supported by the Dutch Digestive Disease Foundation (MLDS) grant WS00-13, the Netherlands Organisation for Medical and Health Research (NWO) grant 902-22-094, the KNAW Ter Meulen Fonds, and a Fulbright fellowship to CW.
REFERENCES
Footnotes
-
↵* Present address: TGen, Translational Genomics Research Institute, Phoenix, AZ, USA
Linked Articles
- Leading article