Article Text

Abstract
Objective The biological heterogeneity of hepatocellular carcinoma (HCC) makes prognosis difficult. We translate the results of a genome-wide high-throughput analysis into a tool that accurately predicts at presentation tumour growth and survival of patients with HCC.
Design Ultrasound surveillance identified HCC in 78 (training set) and 54 (validation set) consecutive patients with cirrhosis. Patients underwent two CT scans 6 weeks apart (no treatment in-between) to determine tumour volumes (V0 and V1) and calculate HCC doubling time. Baseline-paired HCC and surrounding tissue biopsies for microarray study (Agilent Whole Human Genome Oligo Microarrays) were also obtained. Predictors of survival were assessed by multivariate Cox model.
Results Calculated tumour doubling times ranged from 30 to 621 days (mean, 107±91 days; median, 83 days) and were divided into quartiles: ≤53 days (n=19), 54–82 days (n=20), 83–110 days (n=20) and ≥111 days (n=19). Median survival according to doubling time was significantly lower for the first quartile versus the others (11 vs 41 months, 42, and 47 months, respectively) (p<0.0001). A five-gene transcriptomic hepatic signature including angiopoietin-2 (ANGPT2), delta-like ligand 4 (DLL4), neuropilin (NRP)/tolloid (TLL)-like 2 (NETO2), endothelial cell-specific molecule-1 (ESM1), and nuclear receptor subfamily 4, group A, member 1 (NR4A1) was found to accurately identify rapidly growing HCCs of the first quartile (ROC AUC: 0.961; 95% CI 0.919 to 1.000; p<0.0001) and to be an independent factor for mortality (HR: 3.987; 95% CI 1.941 to 8.193, p<0.0001).
Conclusions The hepatic five-gene signature was able to predict HCC growth in individual patient and the consequent risk of death. This implies a role of this molecular tool in the future therapeutic management of patients with HCC.
Trial registration number ClinicalTrials.gov Identifier: NCT01657695.
- HEPATOCELLULAR CARCINOMA
- LIVER IMAGING
- MOLECULAR CARCINOGENESIS
- MOLECULAR ONCOLOGY
Statistics from Altmetric.com
Significance of this study
What is already known on this subject?
Hepatocellular carcinoma (HCC) is a cancer particularly difficult to classify because of the highly heterogeneous natural history. Barcelona Clinic Liver Cancer (BCLC) staging score currently is the most used algorithm to choose the therapeutic strategy and predict the clinical outcome.
Decision-making process in HCC mainly ruled by BCLC classification is mostly based on clinical and imaging characteristics performed at the time of diagnosis.
The major limit in this daily clinical life is represented by the ‘snapshot’ quality of this analysis, which overlooks the dynamic progression of the disease.
What are the new findings?
About 25% of newly diagnosed HCCs identified on surveillance have very rapid growth, with a doubling time <2 months regardless of initial BCLC classification.
A five-gene transcriptomic hepatic signature including angiopoietin-2 (ANGPT2), delta-like ligand 4 (DLL4), neuropilin (NRP)/tolloid (TLL)-like 2 (NETO2), endothelial cell-specific molecule-1 (ESM1), and nuclear receptor subfamily 4, group A, member 1 (NR4A1) identifies with high sensitivity and specificity rapidly growing HCCs.
This signature is also an accurate indicator of survival.
How might it impact on clinical practice in the foreseeable future?
The addition of the identified molecular signature to the clinical and radiological parameters indicated by current guidelines would have significant implication for the therapeutic management of patients with HCC, allowing a drastic refinement of prognosis.
Introduction
There are several staging systems that have been developed for the classification of patients with hepatocellular carcinoma (HCC).1–4 However, none of the proposed staging systems encompass the biological and clinical heterogeneity exhibited by HCCs. First, they include descriptive variables at baseline, which may only be weakly representative of tumour growth behaviour, residual hepatic function and overall health status of the patient. Second, these predictive algorithms consider HCCs to be static rather than dynamic entities. They account for the size and number of neoplastic lesions at the time of presentation, yet do not take into account their growth behaviour during follow-up, such as tumour doubling time (DT). Third, molecular characteristics and tumour pathobiology (eg, local and micro vascular invasion, angiogenesis and vasculogenesis) are not accounted for in scoring systems that only consider clinical features. Indeed, these relevant biological variables may profoundly impact tumour growth, tumour responsiveness to treatment and ultimately patient survival.
Microarray technology has led to the identification of several molecular signatures in HCC, associated with deregulation of specific genes and molecular pathways, including the extracellular matrix, cytoskeleton, oncogenes, tumour suppressor genes, immune response-related genes, apoptosis-related genes and signal transduction/translational regulatory genes (WNT, TGFβ, MAPK, EGFR, IGF-R, and MET/HGF).5–11 These signatures were able to predict prognosis,5 ,6 survival7 ,8 and early recurrence after treatment9–11 in selected HCC cohorts, allowing stratification of HCC into several clinically relevant subgroups, unrecognisable by conventional diagnostic methods.
The goal of this study was to prospectively test the hypothesis, in a consecutive series of patients at first diagnosis of HCC, that HCCs have different growth patterns marked by specific molecular signatures, which can be used to predict tumour progression and patient survival in individual cases at first diagnosis.
Methods
Patients and samples
A training set consisted of tissue samples obtained from patients with Child–Pugh class A liver cirrhosis of any aetiology who were followed up in our Gastroenterology Unit with ultrasound (US) surveillance at 6-month interval. Patients who received, between September 2008 and December 2010, a new diagnosis of HCC at US surveillance were eligible if they had a clinical condition that allowed a US-guided liver biopsy of a focal lesion, with the largest lesion biopsied in case of multifocality. To further confirm HCC diagnosis, a CT scan was performed. To measure the growth of lesions, a second CT was performed by either of two dedicated radiologists (SC, CC) 6 weeks later. This interval was chosen as previous data from our group indicated that a relevant difference in size could be demonstrated within this very short time interval.12 ,13 During the 6-week interval, patients did not undergo any specific treatment. This interval is much shorter than the average time to treatment after HCC diagnosis14 ,15 and therefore no ethical issues were raised by IRB. After the second CT, patients were treated according to international guidelines1 and were monitored every 3 months unless their clinical condition required more frequent monitoring. At the time of diagnosis (eg, baseline), US-guided liver biopsy was performed both inside the lesion and in the surrounding tissue. Tumour and non-tumour (NT) liver samples were collected in cold RNA later (Qiagen, Milan, Italy) and immediately processed for gene expression analysis. Portions of biopsies were also fixed in 10% formaldehyde, paraffin-embedded and stained with H&E. The diagnosis of HCC was based on established histological criteria.16 The study endpoint was death, liver transplant (LT) or completion of this study. Results were analysed with the intention to treat.
The study was conducted according to the guidelines of the Declaration of Helsinki and Good Clinical Practice in clinical trials. All patients provided written informed consent.
Validation cohort
The validation set consisted of tissue samples from patients with Child–Pugh class A liver cirrhosis of any aetiology enrolled in semi-annual US surveillance who consecutively presented at the Modena Gastroenterology Unit between January 2011 and July 2012 with a new HCC diagnosis. These patients underwent the same imaging protocol with the same two radiologists as the training set. Quantitative reverse transcriptase PCR was performed instead of microarrays to evaluate the five-gene signature.
Radiological protocol
CT scans were performed using a 64-detector machine (Lightspeed VCT, GE Healthcare, Milwaukee, Wisconsin, USA) as detailed in the online supplementary methods_imaging. Postprocessing of CT data was used to obtain the volume of each nodule detected in CT0 and CT1. Each single HCC nodule was reconstructed by the same radiologist (GM) in three orthogonal planes, with two orthogonal diameters drawn on every plane. The six resulting diameters were used to calculate the two volumes using the formula: 4/3πr3. The DT for each single mass was determined using the following formula: where Ti is the time interval in days, V0 is the volume of the tumour at CT0 and V1 is the volume of the tumour at CT1.17 Based on these values, tumour growth was classified according to quartiles of the fastest to slowest tumour growth, respectively.
Analysis of gene expression
Microarray experiments and bioinformatic analysis are detailed in the online supplementary methods_gene expression. Total RNA was isolated from NT and tumour (T) liver tissues using Trizol (Invitrogen, Carlsbad, California, USA), according to the manufacturer's directions. The quality and quantity of the RNA samples obtained was checked using an Agilent Model 2100 Bioanalyzer (Agilent Technologies, Palo Alto, California, USA) and an ND-1000 Spectrophotometer (NanoDrop Technologies, Wilmington, Delaware, USA), respectively.
Upregulated and downregulated genes were identified for the first DT quartile (eg, the rapidly growing tumours) versus the three other quartiles. Only genes with an uncorrected p value that was <0.01 and an at least twofold expression difference were selected (see online supplementary table S2). Gene expression data are available at the Gene Expression Omnibus website (http://www.ncbi.nlm.nih.gov/geo) under the accession number: GSE54236.
Real-time reverse transcription PCR
The microarray data were validated in an independent cohort by real-time reverse transcription PCR (qRT-PCR) as detailed in online supplementary methods_gene expression.18
Risk score calculation
Risk score was calculated for both training and validation cohorts as detailed in online supplementary methods_gene expression.19
Statistical analysis
Survival at 1 year was chosen as the outcome to calculate sample size. Assuming a 30% difference in the 1-year survival between the fast-growing (20%) and slow-growing HCC (50%), and 5% α error and 20% β error, 39 patients were needed in each group.
Dichotomous and continuous variables were compared using Fisher's exact test and the non-parametric Mann–Whitney U test, respectively. Logistic regression analysis was performed to identify variables independently associated with faster growth. Candidate risk factors for faster growth were sex, age, aetiology of cirrhosis (viral vs non-viral), Edmondson–Steiner grading, presence of macrovascular invasion assessed by CT scan, volume of the tumour at baseline, multifocality at baseline, platelets level, α-fetoprotein levels and identified five-gene signature. The dependent variable (eg, rapid growth) was coded as 1 (present) vs 0 (absent). To visualise the capacity of the risk signature to discriminate between fast-growing and slow-growing HCCs, we summarised the data in a receiver operating characteristic curve.20
The Kaplan–Meier method was used to estimate the cumulative probability of overall survival. Patients were censored at the time of LT, death or last available follow-up. Differences in observed probability were assessed using the log-rank test.
The Cox proportional method was used to identify risk factors for overall survival. The same independent variables assessed for growth speed were also used for survival analysis, with albumin, creatinine and bilirubin, used as additional independent variables. To avoid the effect of colinearity in the logistic regression and Cox models, the individual components of the scores evaluated (Child–Pugh; Barcelona Clinic Liver Cancer, BCLC) were included in the multivariate models separately. Variables with a p value <0.10 in univariate analyses were included in the final multivariate model. Internal assessment of the accuracy of the survival prognostic model was performed by data splitting and by bootstrapping.21
The PASW Statistics V.20 program (IBM, Armonk, New York, USA) was used for statistical analyses.
Results
A total of 117 consecutive patients, undergoing US surveillance for HCC, had HCC detected. Of these, 39 were excluded (see online supplementary figure S1), resulting in 78 patients enrolled as a training set. Additional 71 consecutive patients with HCC were evaluated for enrolment as the validation set. Seventeen were excluded, resulting in a validation cohort of 54 patients (see online supplementary figure S1). Online supplementary table S1 summarises the clinical characteristics of each cohort at enrolment in surveillance. Data were censored in August 2012 for the training cohort (mean follow-up 24.1±12.8 months) and in December 2013 for the validation cohort (mean follow-up 15.6±11.0 months).
Baseline characteristics and growth patterns for HCCs of the training cohort
In the training cohort, the incidence of a single nodule of HCC was 54/78 (69.2%), while the incidence of two nodules was 12/78 (15.4%) and three or more nodules was 12/78 (15.4%). Mean volume at presentation was 12.1±19.7 cm3 (median, 4.9 cm3; range, 1–59.2 cm3) (table 1).
Characteristics of HCCs at presentation
Tumour DT was found to range from 30 to 621 days (mean, 107±91 days; median, 83 days) for the training cohort. Patients were grouped into four quartiles according to increasing DT: ≤53 days (n=19), 54–82 days (n=20), 83–110 days (n=20) and ≥111 days (n=19), respectively. Clinical characteristics of patients and HCC features according to growth speed are summarised in table 2. A representative example of a fast-growing tumour is displayed in online supplementary figure S2. The incidence of multifocal HCC was 9/19 for patients in the first quartile versus 0/20, 1/20 and 2/19 for the other three quartiles, respectively (p=0.001). The size of the individual lesions did not significantly differ between the patients with monofocalities, bifocalities or multifocalities (p=0.717). More patients were categorised as BCLC C in the fast-growing subgroup as a consequence of the significantly higher presence of portal vein thrombosis (5/19 vs 4/59, p=0.034).
Clinical characteristics of patients and HCC features at presentation according to fast (first quartile) or slow (other quartiles) growth speed
Expression profile of HCC tissues from the training cohort
To determine whether genes were differentially expressed in relation with tumour growth, a discriminatory gene analysis was performed on normalised log2 gene expression values. Each tumour sample was individually compared with the combined group of NT samples. By doing so, we identified a number of genes that deviated from normality for multiple tumour samples, but not necessarily for all of them. We used these data to perform discrimination between the fastest-growing quartile versus the other slow-growing quartiles of the tumour samples. An in-between groups t test (unpaired, two-tailed, unequal variances) between the fast and the slow groups was performed. This analysis identified 86 genes exhibiting higher levels of expression and 157 genes exhibiting lower levels of expression in rapidly growing tumours relative to slow-growing tumours (see online supplementary table S2).
These genes were ranked on the basis of their predictive power for survival (univariate z score), with a negative score associated with longer overall survival and a positive score associated with shorter overall survival. The genes with an absolute univariate z score ±2.5 were MCM10, DLL4, NR4A1, NETO2, ANGPT2, ESM1, NCAPH. We then subjected these genes to a multivariate Cox proportional-hazards regression model, with overall survival as the dependent variable. The following genes were independently related to survival: ANGPT2, DLL4, NETO2, NR4A1, ESM1. The risk index was defined as a linear combination of the log2 gene expression values for the top genes identified by univariate Cox proportional hazard regression modelling weighted by their estimated regression coefficients (1.294×ANGPT2; 0.966×DLL4; 0.726×NETO2; 0.624×NR4A1; 0.557×ESM1). The distribution of risk index values calculated in the training set was examined to determine an appropriate cut-point to distinguish high and low risk. We examined a continuum of cut-points (ranging from the 50th to 80th percentile). The 70th percentile cut-point had the best discriminatory power. This five-gene risk signature identified rapidly growing tumours with high specificity and sensitivity (figure 1). Only one case with rapid growth did not bear the complete five-gene signature, while two of the second quartile did (one of these had 54 days as DT). None of the patients in the third and fourth quartile bore the five-gene signature.
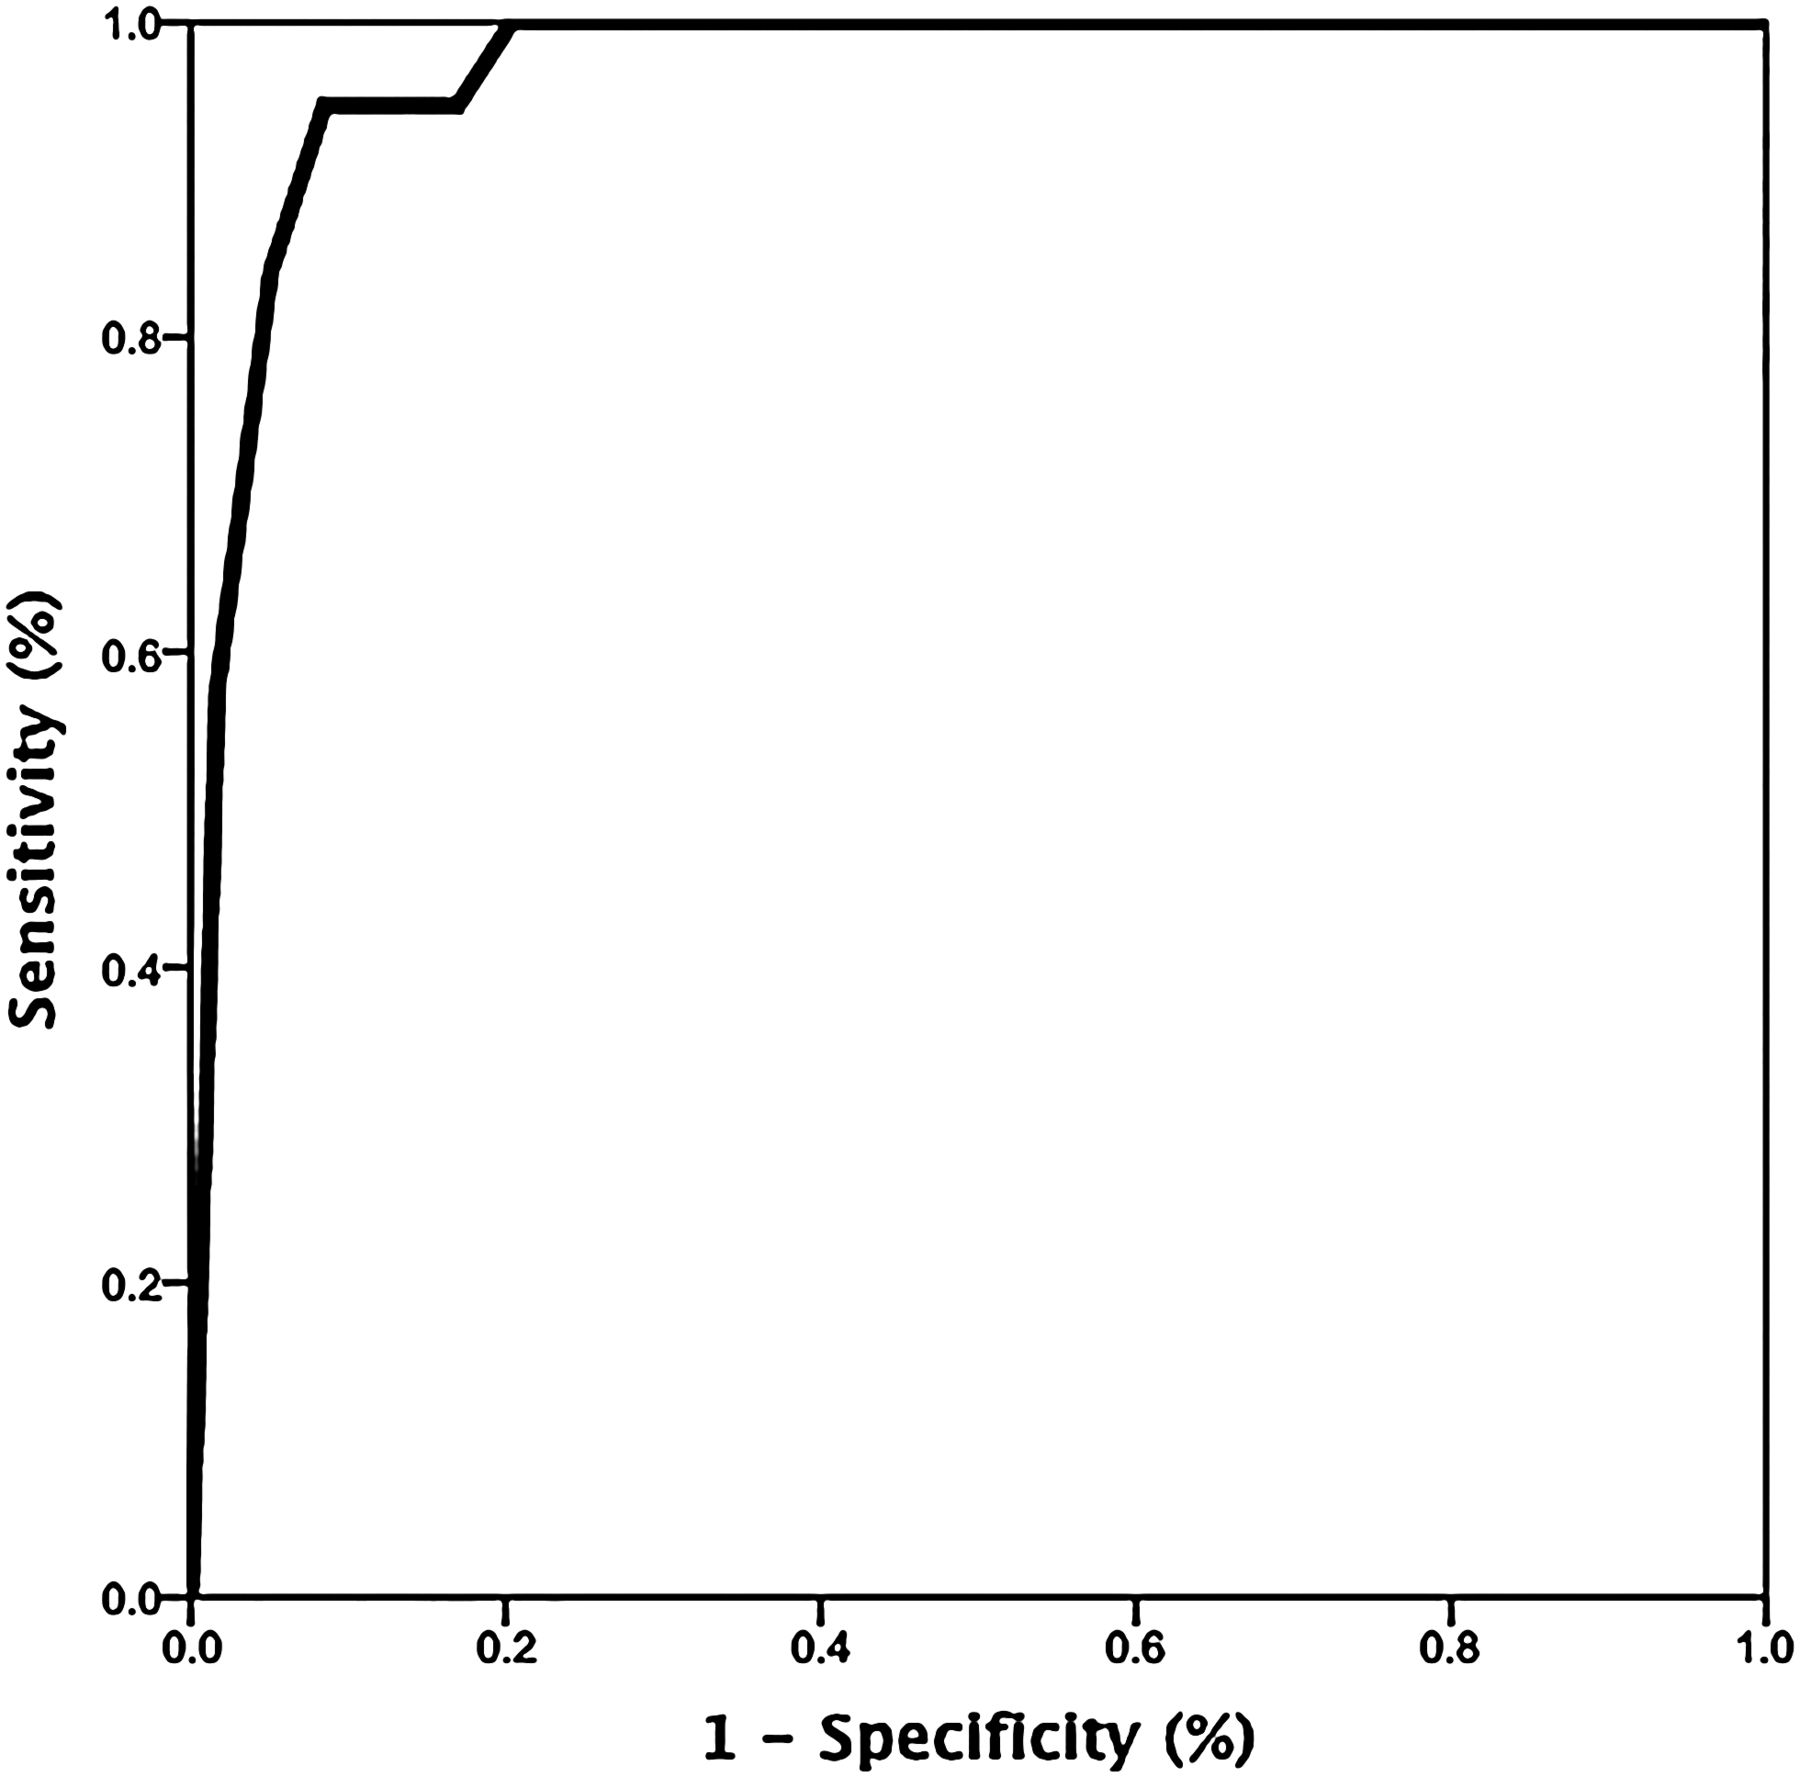
Receiver operating characteristic (ROC) curve analysis to evaluate the diagnostic power of the five-gene signature. The area under the ROC curves (AUCs) was analysed using the Hanley and McNeil method.20 The AUC value was 0.961 (95% CI 0.919 to 1.000; p<0.0001).
Fast growth was associated at univariate analysis with aetiology of cirrhosis, Edmondson–Steiner grading, presence of macrovascular invasion, tumour volume at baseline, multifocality at baseline and five-gene risk signature. Only five-gene risk signature (OR 4.253; 95% CI 2.030 to 8.910, p<0.0001) was independently associated at multivariate logistic regression analysis (table 3).
Univariate and multivariate logistic regression analysis of baseline factors associated with rapid growth
Prediction of survival for the training cohort
No significant difference was present between quartiles regarding Child–Pugh class (p=0.330) or Model For End-Stage Liver Disease score (p=0.237) at the time of HCC diagnosis.
A total of 40/78 (51.2%) patients died during follow-up: 17/19 (98.4%) patients in the first quartile versus 23/59 (38.9%) patients in the other three quartiles (p<0.0001). The difference was significant for the first quartile versus each of the others (17/19 (89.4%) versus 8/20 (40.0%), 7/19 (36.8%) and 8/19 (42.1%), respectively (p=0.0013, p=0.0005 and p=0.0021, respectively)). Moreover, death due to neoplastic invasion of the liver occurred significantly more often in the first quartile (see online supplementary table S3) (p=0.001). The overall mean and median survival for the training cohort was 24.1±12.8 months and 38 months, respectively. The patients with rapidly growing tumours had mean and median survival periods of 14.0±10.4 months and 11 months, respectively, while the mean and median survival periods for patients in the second, third and fourth quartiles were 25.5±10.9 and 41 months, 26.3±11.1 and 42 months and 30.5±13.4 and 47 months, respectively. Correspondingly, Kaplan–Meier curve analysis of survival showed a significantly lower survival rate for HCC cases stratified by rapid growth (<53 days) compared with the other quartiles (figure 2A; p<0.0001) or by gene risk signature (figure 2C, p<0.0001).

Kaplan–Meier plots for survival of patients with hepatocellular carcinoma (HCC). Patients were grouped according to quartiles of HCC growth (solid line: ≤53 days; dashed-dot line: 54–82 days; dashed line: 83–110 days; dotted line: ≥111 days) (A: training and B: validation cohort, respectively) or according to the five-gene risk signature (C: training and D: validation cohort) (solid line: high-risk signature; dotted line: low-risk signature).
Cox regression analysis identified the five-gene risk signature (HR: 3.987; 95% CI 1.941 to 8.193, p<0.0001), macrovascular invasion (HR: 3.885, 95% CI 1.491 to 10.123, p=0.005), treatment (HR: 0.460, 95% CI 0.213 to 0.997; p=0.049) and serum albumin levels (HR: 0.403, 95% CI 0.211 to 0.769, p=0.006) as independent risk factors for mortality (table 4).
Cox regression analysis of baseline factors associated with mortality in the training cohort
Treatment was performed according to internationally accepted guidelines.1 Only nine patients received the best supportive care (three in the first quartile, one in the second, one in the third and four in the fourth, p=0.153). Treatment had a significant impact on survival for the training cohort (table 4). However, when treatment was stratified according to growth speed, patients with slow growth gained a significant advantage with treatment (median survival of no treatment vs treatment: 13 vs 42 months, respectively; p=0.017). In contrast, patients with fast-growing tumours had a marginal survival advantage that did not reach statistical significance (median survival of no treatment vs treatment: 5 vs 11 months, respectively; p=0.088).
Validation of the five-gene risk signature
Univariate analysis identified number of nodules at baseline (OR: 3.839; 95% CI 1.363 to 10.814; p=0.011) and the five-gene signature (OR: 2.994; 95% CI 1.465 to 6.122; p=0.003) as independent predictors of rapid tumour growth. At multivariate analysis, only the five-gene signature was identified as an independent factor for rapid tumour growth (OR: 3.467; 95% CI 1.494 to 8.047; p=0.004).
Seventeen patients out of 54 (31.5%) died during follow-up, 8/15 (53.3%) in the fast-growing group and 9/39 (23.0%) in the slow-growing group (p=0.032). Death in the high-risk cluster was, as in the training cohort, more frequently due to HCC progression versus other causes (see online supplementary table S3, p=0.005). The patients with rapidly growing tumours had mean and median survival periods of 12.2±8.1 months and 9 months, respectively, while the mean and median survival periods for patients in the second, third and fourth quartiles were 26.8±10.9 and 24 months, 25.6±8.1 months and 30.3±27 and 24 months, respectively (figure 2B, p=0.002). Kaplan–Meier curve analysis of survival showed a significantly lower survival rate for HCC cases when stratified by gene risk signature (p=0.001) (figure 2D).
To assess the internal validity of the survival model the data-splitting and bootstrapping validation methods were performed. Univariate analysis found the significant prognostic factors for survival including Edmondson–Steiner grading (HR: 2.678; 95% CI 1.317 to 5.444, p=0.007), macrovascular invasion (HR: 5.149; 95% CI 1.378 to 19.241; p=0.082), treatment (HR: 0.127; 95% CI 0.034 to 0.474; p=0.002), albumin levels (HR: 0.214; 95% CI 0.62 to 0.742, p=0.015) and the five-gene signature (HR: 6.896; 95% CI:1.820–26.128; p=0.004). At multivariate analysis, only Edmondson–Steiner grading (HR: 4.489; 1.635 to 12.329, p=0.004), identified treatment (HR: 0.197; 95% CI 0.039 to 0.995; p=0.048), albumin levels (HR: 0.161; 95% CI 0.033 to 0.783, p=0.024) and the five-gene signature (HR: 5.798; 95% CI 1.510 to 22.260; p=0.010) were independent factors related to survival. A validation of the survival model carried out by bootstrapping identified the same prognostic factors as the training cohort plus Edmondson–Steiner grading (see online supplementary table S4).
Discussion
In this prospective study of patients with compensated liver cirrhosis on US surveillance at first identification of HCC, we have shown that a five-gene hepatic transcriptomic signature (Angiopoietin-2, NETO2, DLL4, ESM1, NR4A1) is able to identify patients with extremely rapid tumour growth (ie, a DT of <53 days as determined by two CT scans performed at 6-week interval) and ominous prognosis (median survival of 11 months vs more than 41 months in patients with slowly growing tumours).
The biological characterisation of these fast-growing tumours is quite novel in comparison with other reported prognostic signatures.5–11 Although many of these signatures were very informative in regard to prognosis, recurrence rate and survival, it should be underlined that all these studies used frozen or paraffin-embedded archival samples obtained at resection. This rather limits the generalisability to all HCCs as not more than 5% of them are suitable for resection, as degree of portal hypertension, number and size of lesions, macrovascular involvement, greatly restrict the indications for surgery.
In the present study, although many genes involved in cell cycle control and proliferation were upregulated, five (ANGPT2, NETO2, ESM1, NR4A1, and DLL4) that have roles in endothelial cell migration, angiogenesis and blood vessel morphogenesis were also related with survival. ANGPT2 was the most significantly upregulated gene. Its product is secreted by endothelial cells at sites of active vascular remodelling.22 Levels of ANGPT2 mRNA and protein have also been found to correlate with microvessel density23 and highly vascular and poorly differentiated HCCs, respectively.24 ,25 Correspondingly, the injection of an HCC cell line overexpressing angiopoietin-2 into nude mice resulted in faster tumour growth that was associated with greater vessel density.26 Experimentally, its blockade provides an effective anti-angiogenic therapy.27 ,28 The results of previous studies also suggest that functional relationship occurs among genes characterising the signature identified in this study. For example, DLL4 is a vascular-specific ligand of Notch and plays a critical role in the angiogenesis of several types of tumours.29 ,30 Under ischaemic conditions, upregulation of both ANGPT-2/Tie2 and DLL4 may represent a compensatory mechanism for local ischaemia, eventually favouring neo-angiogenesis.31 ESM1 is expressed by the vascular endothelium and participates in the regulation of cell adhesion, inflammatory disorders and tumour progression.32 Moreover, in some experimental models of cancer, ESM1 expression has been identified as one of the main switches for the induction of a dormant tumour to a rapidly growing tumour with increased angiogenesis.33 NR4A1 is a member of the nuclear orphan hormone receptor-1 family, is a direct target of vascular endothelial growth factor and is able to induce endothelial cell proliferation and migration.34 ,35 NETO2 encodes a transmembrane protein that is highly upregulated, along with ANGPT2, in proliferating infantile haemangiomas.36 Thus, we hypothesise that the upregulation of these genes plays a pathogenic role in the rapid growth pattern of the tumours included in the first quartile of this study.
The five-gene signature, specific treatment and serum albumin emerged as independent predictors for survival in patients with liver cirrhosis and HCC both in training and in validation cohorts. Although only one of the three laboratory parameters that compose the Child–Pugh score (eg, albumin, bilirubin and International Normalised Ratio, INR) was identified as a significant factor in a multivariate analysis, this can be explained by the evidence that our patients with HCC represent very early cases identified on surveillance in whom bilirubin and INR values (indicators of more advanced stage of disease) were near normal. These results further confirm that in patients with cirrhosis and HCC, in addition to cancer-related features (eg, the five-gene signature), underlying liver function is relevant in risk modelling.
Impact of treatment on survival was clear-cut only in HCCs with slow growth as for patients with rapidly growing HCC, early detection of the tumour on US surveillance did not improve prognosis. In those with fast growth, further tumour growth was only marginally influenced by therapeutic interventions (p=0.088). None of these patients (irrespective of belonging to training or validation set) had the chance of being transplanted as, in the period between HCC discovery and listing for transplant, HCC had already exceeded transplant criteria. Considering that curative therapies should be offered to the sickest patients, there should be an attempt to verify whether extreme prioritisation for access to transplant for patients with the five-gene signature would be a successful strategy. However, the biological aggressiveness of these tumours could increase the risk of post-transplant recurrence. Indeed, in a retrospective evaluation of HCC recurrence after liver transplantation by Hanouneh et al,37 58% of patients with rapidly growing HCC experienced recurrence. The reliability of the prognostic model described is strengthened by the validation performed in an independent series of patients with similar features. Nevertheless, larger prospective studies are still needed to confirm these results in order to obtain more conclusive arguments for treatment recommendation.
In conclusion, growth patterns of HCC were characterised by applying a five-gene transcriptomic signature at presentation. This high-risk signature identified a subgroup of patients with rapidly growing HCCs, which prevented their access to LT and indicated a poor prognosis. With this study, we provided evidence on the importance of evaluating HCCs statically (as simple number and size of nodules) and dynamically, that is, as growing lesions with extremely different growth patterns. Based on these results and in a more general sense for a better personalised management and therapy of HCC,38 adding the prognostic information of the identified five-gene signature to clinical and radiological parameters already indicated by the current guidelines, would have significant implication for the therapeutic management of patients with HCC.
References
Supplementary materials
Supplementary Data
This web only file has been produced by the BMJ Publishing Group from an electronic file supplied by the author(s) and has not been edited for content.
Files in this Data Supplement:
- Data supplement 1 - Online supplement
- Data supplement 2 - Online supplement
- Data supplement 3 - Online figures
- Data supplement 4 - Online table 1
- Data supplement 5 - Online table 2
- Data supplement 6 - Online table 3
- Data supplement 7 - Online table 4
Footnotes
Contributors EV: conception and design. RC, ET, FM, LM and MLM-C: development of methodology. BL, SC, SC, SB, MDB and NDM: acquisition of data. EV, GG, GM, CC, GC, LL, NDM, PP, TP and UC: analysis and interpretation of data. ME: bootstrap analysis. EV, GEG, PL and FS: writing, review and/or revision of the manuscript. AK, EB and PT: technical support (constructing/managing database). EV: study supervision.
Funding This work was entirely supported by Regione Emilia-Romagna [Grants “PRU (Programma di ricerca Regione-Università) 2007–2009 and 2010–2012”]. GG was supported by grant number 11389 from Italian Association Cancer Research (AIRC). The opinions, results and conclusions reported in this paper are those of the authors and are independent from the funding sources.
Competing interests None.
Patient consent Obtained.
Ethics approval The Ethics Committee of Azienda Ospedaliero-Universitaria, Modena, approved the study protocol (IRB10/08_CE_UniRer; ClinicalTrials ID: NCT01657695).
Provenance and peer review Not commissioned; externally peer reviewed.
Data sharing statement There are no additional data presently available to share; source data are available at the Gene Expression Omnibus website (http://www.ncbi.nlm.nih.gov/geo) under the accession number: GSE54236.