Article Text

Abstract
Objective Current non-invasive diagnostic tests can distinguish between pancreatic cancer (pancreatic ductal adenocarcinoma (PDAC)) and chronic pancreatitis (CP) in only about two thirds of patients. We have searched for blood-derived metabolite biomarkers for this diagnostic purpose.
Design For a case–control study in three tertiary referral centres, 914 subjects were prospectively recruited with PDAC (n=271), CP (n=282), liver cirrhosis (n=100) or healthy as well as non-pancreatic disease controls (n=261) in three consecutive studies. Metabolomic profiles of plasma and serum samples were generated from 477 metabolites identified by gas chromatography–mass spectrometry and liquid chromatography–tandem mass spectrometry.
Results A biomarker signature (nine metabolites and additionally CA19-9) was identified for the differential diagnosis between PDAC and CP. The biomarker signature distinguished PDAC from CP in the training set with an area under the curve (AUC) of 0.96 (95% CI 0.93–0.98). The biomarker signature cut-off of 0.384 at 85% fixed specificity showed a sensitivity of 94.9% (95% CI 87.0%–97.0%). In the test set, an AUC of 0.94 (95% CI 0.91–0.97) and, using the same cut-off, a sensitivity of 89.9% (95% CI 81.0%–95.5%) and a specificity of 91.3% (95% CI 82.8%–96.4%) were achieved, successfully validating the biomarker signature.
Conclusions In patients with CP with an increased risk for pancreatic cancer (cumulative incidence 1.95%), the performance of this biomarker signature results in a negative predictive value of 99.9% (95% CI 99.7%–99.9%) (training set) and 99.8% (95% CI 99.6%–99.9%) (test set). In one third of our patients, the clinical use of this biomarker signature would have improved diagnosis and treatment stratification in comparison to CA19-9.
- PANCREATIC CANCER
- PANCREATITIS
This is an Open Access article distributed in accordance with the Creative Commons Attribution Non Commercial (CC BY-NC 4.0) license, which permits others to distribute, remix, adapt, build upon this work non-commercially, and license their derivative works on different terms, provided the original work is properly cited and the use is non-commercial. See: http://creativecommons.org/licenses/by-nc/4.0/
Statistics from Altmetric.com
Significance of this study
What is already known on this subject?
Pancreatic adenocarcinoma is burdened with a 5-year survival rate of around 6%. Pancreatic cancer is difficult to distinguish from chronic pancreatitis, a disease in which this cancer can arise and is then even harder to detect (current diagnostic accuracy between 50% and 60%).
The carbohydrate antigen 19-9 (CA19-9) is currently the only blood-based biomarker in clinical use for pancreatic cancer.
Metabolomics, the ‘omics technique’ that can furnish a dynamic portrait of metabolic profiles, has been proposed to be useful for identifying new biomarkers for an earlier diagnosis of different malignancies.
What are the new findings?
In the largest study ever conducted to identify a tumour biomarker signature distinguishing pancreatic cancer from chronic pancreatitis using a metabolomics approach, we investigated 914 subjects and identified a metabolic biomarker signature comprising nine metabolites in addition to CA19-9 for pancreatic cancer with a much higher diagnostic accuracy than CA19-9 alone.
The biomarker signature identified here improved the diagnostic accuracy for the detection of pancreatic cancer and for the detection of resectable stages of pancreatic cancer.
For one third of our patients, this would have improved the diagnostic workup and treatment stratification.
How might it impact on clinical practice in foreseeable future?
Identifying pancreatic cancer in an earlier (still resectable) stage by surveillance of high-risk patients would increase survival by 30%–40%.
Such a surveillance strategy is cost-effective once a test becomes available whose sensitivity exceeds 88% with a specificity of 85%—two conditions now met for the first time by the metabolic biomarker signature identified here.
The results demonstrate the feasibility of developing a diagnostic test that can detect pancreatic cancer with greater accuracy (>90%) than has previously been achieved with either conventional tumour markers or a micro RNA panel.
Introduction
Pancreatic cancer is projected to be the third leading cause of cancer-related death by 2030 due to delayed diagnosis and slow progress in treatment options.1 Chronic pancreatitis (CP) arises with an incidence of between 4 and 23/100 000 in different populations (the prevalence is 10-fold higher)2 and represents a risk factor for pancreatic cancer3 and a frequent differential diagnosis. Commonly used diagnostic methods for either disorder include transabdominal ultrasound, various blood tests and trans-sectional imaging. The best-established blood test for this purpose is the carbohydrate antigen 19-9 (CA19-9), a Lewis antigen of the MUC1 protein class. Unfortunately, CA19-9 can also be elevated in patients with non-malignant diseases, including liver cirrhosis (LC), CP, cholangitis and other GI cancers.4 CA19-9 has been reported to discriminate between patients with pancreatic cancer and healthy controls (sensitivity 80.3%, 95% CI 77.7 to 82.6; specificity 80.2%, 95% CI 78.0 to 82.3)5 and benign pancreatic disease (sensitivity 78.2%, 95% CI 72.3 to 80.4; specificity 82.8%).6 As CA19-9 is not expressed in Lewis blood-type negative patients, its sensitivity can even theoretically not surpass 92%.
The fact that the sensitivity and specificity of the distinction between cancer and CP is often no better than 65% or 60%, respectively,7 has prompted a search for alternative biomarkers. Our study was designed to exclude suspected pancreatic cancer (local, locally advanced and metastatic) in patients with CP and we, therefore, aimed at optimising the negative predictive value (NPV).
It has been previously established that a new diagnostic assay for pancreatic cancer, to reduce healthcare expenditure and prolong patient survival, would have to perform with a minimum sensitivity of 88% at a specificity of 85%.8 These requirements can be relaxed, when the incidence rises from 0.71%, as in newly diagnosed diabetics, to 1.95%, as in patients with CP,3 ,9 ,10 or even higher, as in familial pancreatic cancer or hereditary cancer syndromes.11 ,12
While much effort has been devoted to proteomic and genomic profiling and the identification of various protein and gene components of cancer13–20 data on metabolic signatures in body fluids, cancer cells or tissues are still very limited. Fortunately, metabolomics, including lipidomics, has recently become more feasible allowing the identification of clinical metabolite biomarkers and several smaller studies recruiting up to 50 patients per group suggest that metabolomics could be useful in pancreatic cancer detection.21–23
Here, a three-phase biomarker development strategy was applied (exploratory, training and test set)24 in 914 subjects including clinically relevant controls. A comprehensive metabolomics platform including lipidomics (MxP Broad Profiling, MxP Steroids, MxP Lipids) was used for the discovery and subsequent validation of a metabolic signature and to assess the performance of a biomarker signature to distinguish patients with pancreatic cancer, including those with resectable stages, from patients with CP.
Materials and method
Sample preparation
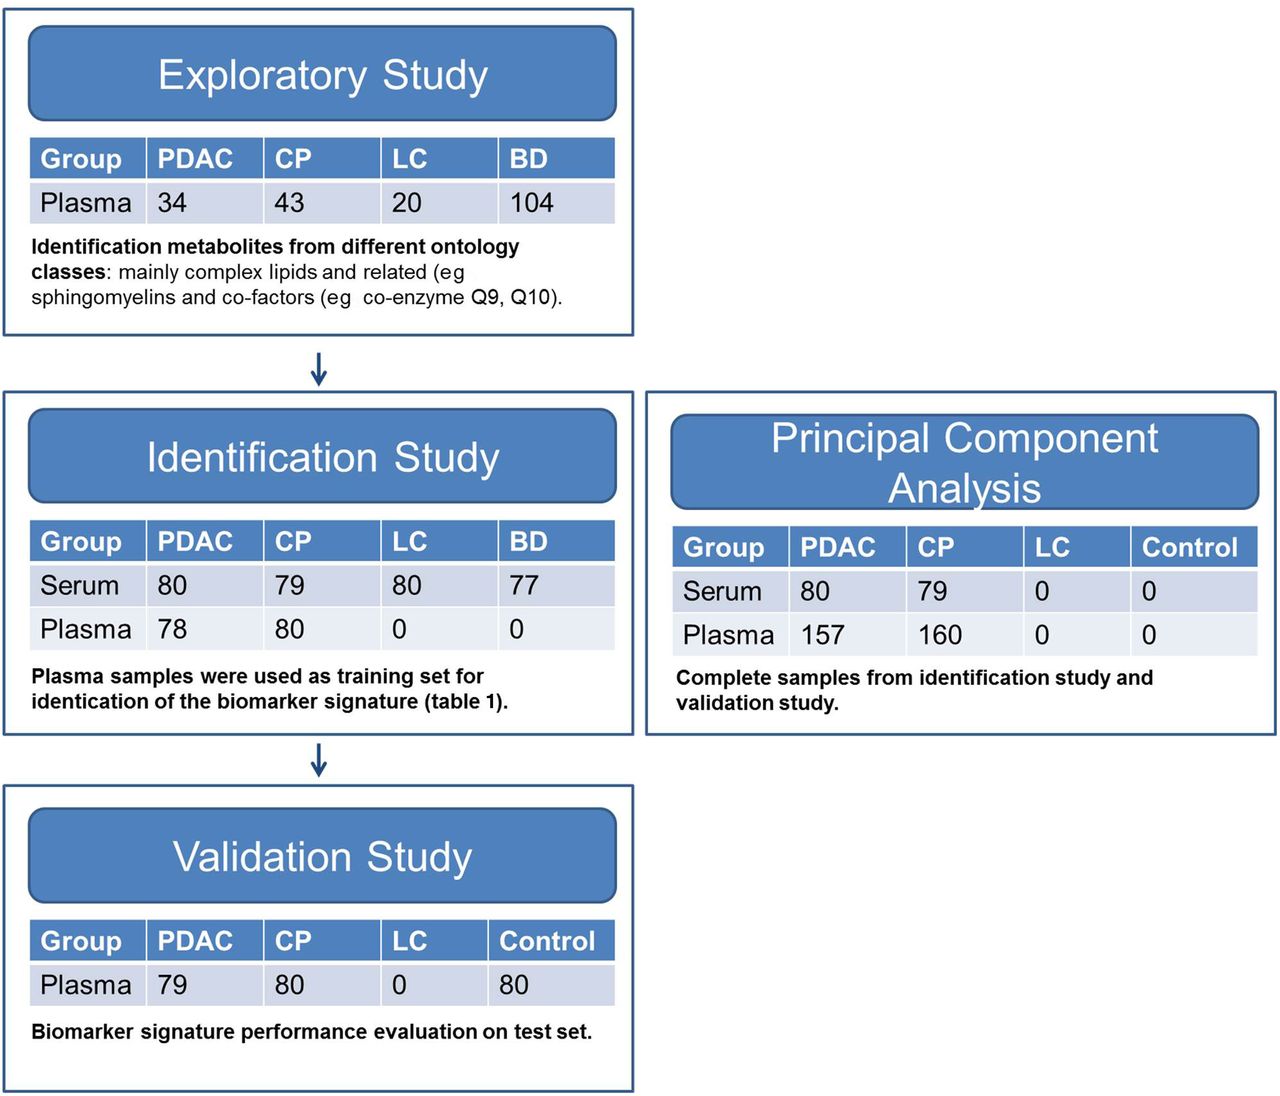
The study was designed according to the REMARK guidelines for diagnostic tumour marker development. Nine hundred and fourteen patients with pancreatic cancer, CP, LC, healthy blood donors (BDs) and preoperative patients with non-pancreatic disease were prospectively enrolled. For details, see online supplementary material methods. CA19-9 was measured in a certified clinical laboratory using a cut-off of 37 U/mL. As required by the National Cancer Institute (NCI) Early Detection Research Network,24 we started with an exploratory study (discovery, n=201) from two different centres (Greifswald n=101, Kiel n=100 (CP: 43, pancreatic ductal adenocarcinoma (PDAC): 34, LC: 20, BD: 104)). Due to the unbalanced distribution of disease groups over centres, results of the exploratory study are not presented here nor used as trainings set. In the initial phase (exploratory study) of our project, we present advancement criteria to proceed to an identification and validation study. In a second phase (training set), we recruited 474 subjects with two different matrixes (Greifswald, serum: 80 PDAC, 79 CP, 80 LC, 77 BDs; Dresden, plasma: 78 PDAC, 80 CP). Only the plasma samples of the second phase (n=158) were used as a training set. A third independent cohort (Dresden, plasma: 79 PDAC, 80 CP, 80 non-pancreatic controls) was employed as test set for validation of the biomarker signature (figure 1). For the principal component analysis (PCA), we used all samples (plasma and serum) from the identification and validation study (figure 1).

Study design. Description of the exploratory, identification study and validation study. In addition, description of cohort for the principal component analysis (see figure 2A). The identification study was performed in two centres on serum and plasma. Plasma samples were used to generate a training set. Samples for the validation study were recruited independently as test set. Participant numbers are given for each study phase. PDAC, pancreatic ductal adenocarcinoma; CP, chronic pancreatitis; LC, liver cirrhosis; BD, blood donors; controls, non-pancreatic disease preoperative patients.
supplementary methods
Metabolite profiling
MxP broad profiling, MxP steroids and MxP lipids
Three types of mass spectrometry analyses were applied. Gas chromatography–mass spectrometry (GC-MS; Agilent 6890 GC coupled to an Agilent 5973 MS System, Waldbronn, Germany) and liquid chromatography–MS/MS (LC–MS/MS; Agilent 1100 HPLC-System coupled to an Applied Biosystems API4000 MS/MS-System, Darmstadt, Germany).25 Solid-phase extraction-LC–MS/MS (SPE-LC–MS/MS; Symbiosis Pharma, Spark, Emmen, The Netherlands) coupled to an Applied Biosystems API4000 MS/MS-System was used for the determination of steroid levels.26–28
Total lipids were extracted from plasma by liquid/liquid extraction using chloroform/methanol. The lipid extracts were subsequently fractionated by normal phase liquid chromatography into 11 different lipid groups.27 For further details, see online supplementary material methods.
Statistics
Prior to statistical analysis, log10 transformation of ratios was conducted so that the data distribution becomes approximately normal. SIMCA-P V.13.0 (Umetrics AB, Umea, Sweden), TIBCO Spotfire 3.3.1 and R 2.8.1 were used for data analyses and visualisations. Initially, an exploratory multivariate analysis (PCA) was applied to log10-transformed ratios scaled to unit variance.
A simple linear model (analysis of variance (ANOVA), package nlme) with ‘disease’, ‘age’, ‘body mass index’, ‘gender’ and ‘sample storage time’ as fixed effects was fitted to the data. Significance level was set to 5%. The multiple test problem was addressed by calculating the false discovery rate (FDR) using the Benjamini and Hochberg method.
To classify patients depending on their metabolic profiles, a penalised logistic regression was fitted via the elastic net (EN) algorithm using the R package glmnet.29 Equal penalties were used for both the L1 and the L2 norms. Performance, measured as sensitivity at a fixed specificity of 85%, was determined on the training data by 10-fold cross-validation. This corresponded to a cut-off of 0.384. Thereafter, the cut-off was applied without retraining on the test data, and the performance measured in terms of sensitivity and specificity. The PCA of the combined data set was done after successful validation. For further details, see online supplementary material methods.
Results
The characteristics of the study participants are presented in table 2 and figure 1. Two hundred and seventy-one patients with pancreatic cancer were recruited at three different centres. Blood was drawn as presurgical samples (for resectable pancreatic cancer, n=135) and as prechemotherapy samples (for unresectable pancreatic cancer, n=136).
Patients characteristics for exploratory, identification and validation studies
In the exploratory study, we compared plasma metabolomic profiles (MxP Broad Profiling, MxP Steroids and MxP Lipids) of 43 patients with CP, 20 patients with LC, 104 BDs and 34 patients with PDAC to identify a metabolic PDAC signature. To generate a training set for the biomarker signature discriminating well between PDAC and CP, an identification study was recruited with patients with pancreatic cancer (n=158) and clinically relevant controls (77 BDs, 159 patients with CP, 80 patients with LC). In this set, we used two different sample types (serum and plasma) to test the robustness of the method. As a training set, we used plasma samples from 78 patients with PDAC and 80 patients with CP. For the test set, we recruited an additional 79 patients with PDAC, 80 patients with CP and 80 controls in the validation study (undergoing distress due to surgery and general anaesthesia (vascular surgery, hernia repair, thyroid resection and others; for details, see online supplementary material methods). In the training and test sets, the disease groups were balanced for age and gender (table 2).
Metabolite profile
Using the MxP platform, we identified up to 477 high priority metabolites (exploratory: 364, training: 477; test: 337) in serum and plasma samples which were distributed over 10 ontology classes shown in online supplementary table S1. The largest group of metabolites identified were complex lipids, fatty acids and related metabolites comprising up to 64% in the exploratory study. In the biomarker signature which discriminated best between pancreatic cancer and CP, five out of nine metabolites (in addition to CA19-9) belonged to the ontology class of lipids (table 1). Ratios, p values and FDR of ANOVA for each metabolite of the biomarker signature are given in table 1. ANOVA results of all metabolites are given in online supplementary table S2.
List of metabolites selected based on the multivariate elastic net analysis comprising the biomarker signature and their analysis of variance results
supplementary tables
Biomarker discovery
In an unsupervised multivariate PCA, 237 patients with pancreatic cancer and 239 patients with CP were separated by the principal components 3 (7.2%) and 4 (6.6%) (figure 2A). This is remarkable as we investigated a heterogeneous cohort with respect to gender, age, life style, comedication and comorbidity. On ANOVA of the training set, we detected 29 significantly changed metabolites between PDAC and CP in serum and plasma samples after correction for gender, age, body mass index (BMI) and sample storage time (figure 2B). To construct an effective diagnostic model for pancreatic cancer, we applied an elastic net algorithm using the data from the training set. Based on the model, nine plasma metabolites were selected in addition to CA19-9, shown in table 1, for the training set which was then applied to the test set.

(A) Principal component analysis of pancreatic ductal adenocarcinoma (PDAC) and chronic pancreatitis (CP) metabolomics data from the combined identification and validation data sets (plasma and serum samples). The numbers on the axes are representative for the fraction of variability captured by the principal component. In total, 36 principal components were calculated capturing 55% of the variability. Data were log10 transformed and scaled to unit variance. (B) Number of significant metabolite changes in PDAC versus CP. Plasma and serum data sets comprise two independent sample collections from two different hospitals. Statistical analysis was done by a linear model on log10-transformed data with disease, gender, BMI, age and storage time as fixed effects on the identification study. Multiple testing was addressed by calculating the false discovery rate (FDR) described by Benjamini and Hochberg. Significance level was set to p<0.05 and FDR<0.2.
Clinical performance evaluation
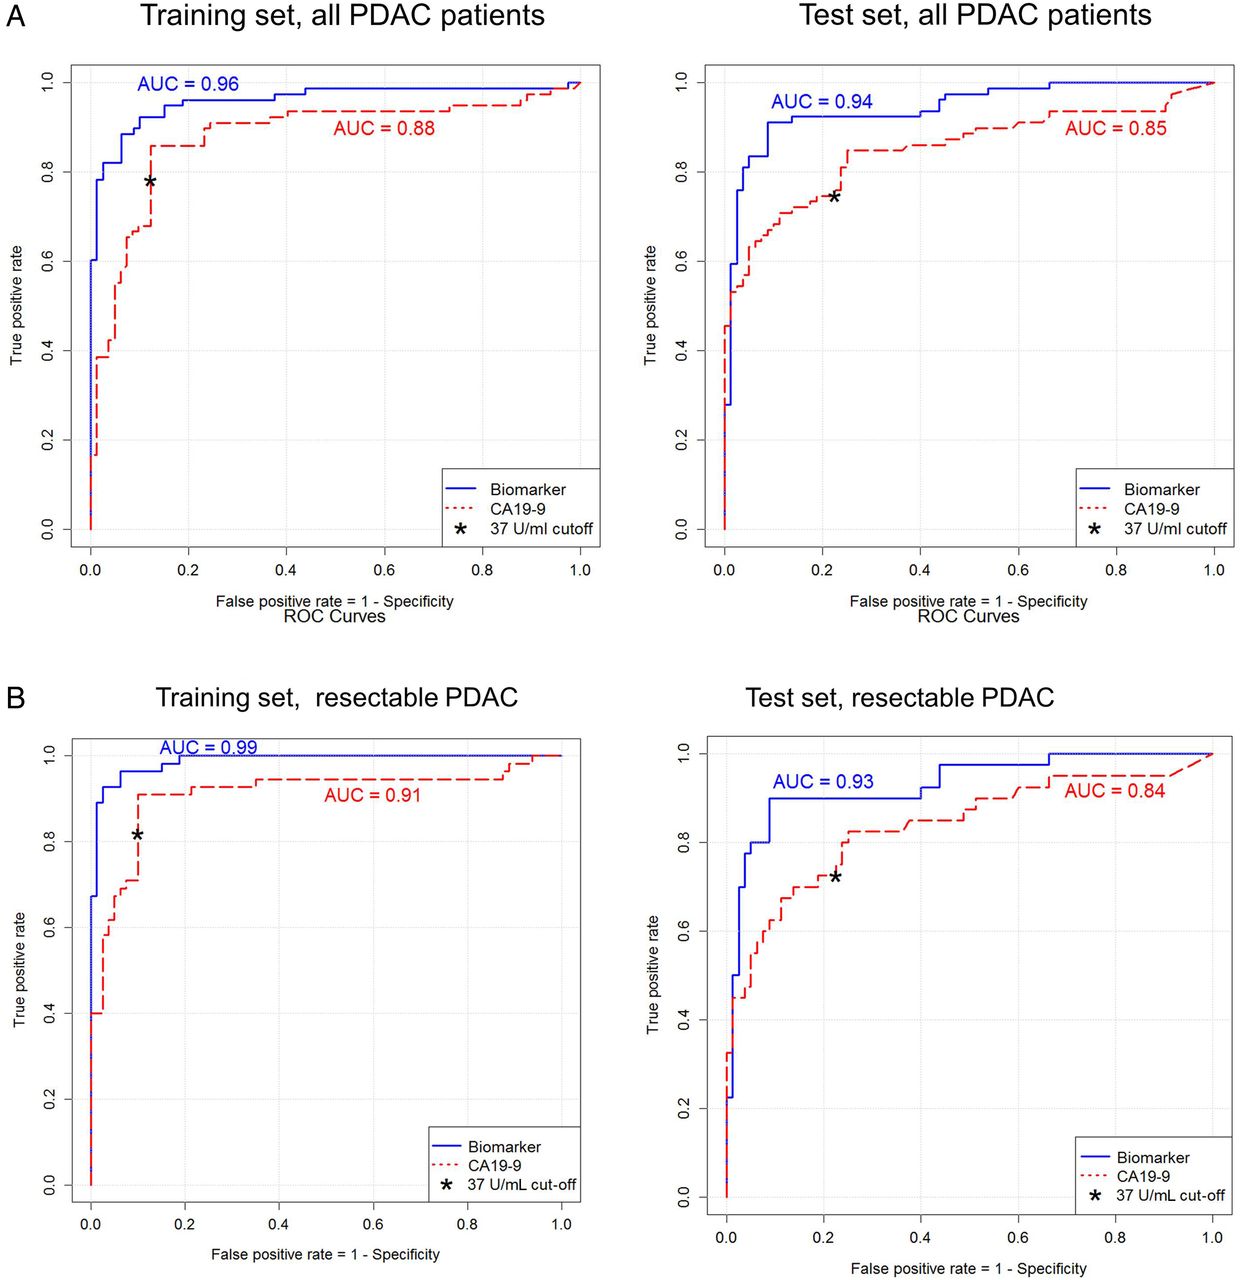
The biomarker signature, comprising nine metabolites and CA19-9, detected PDAC in comparison to patients with CP with an area under the curve (AUC) of 0.96 (95% CI 0.93 to 0.98), a fixed specificity of 85% and a sensitivity of 94.9% (95% CI 87.0% to 97.0%) resulting in an NPV of 99.9% (95% CI 99.7% to 99.9%) (receiver operating characteristic (ROC) curves, figure 3A, table 3) in the training study when assuming a cumulative incidence of 1.95% of PDAC in the CP population. The diagnostic accuracy was 90.0% (95% CI 86.0% to 91.0%). Furthermore, the biomarker signature detected 98% of resectable pancreatic cancers (55 out of 78, stages IA to IIB) with an accuracy of 90.4% (95% CI 80.4% to 90.9%). In comparison, abdominal ultrasound in our cohort had a sensitivity of 68% and a specificity of 75%, confirming previous reports30).31 The cut-off of 0.384 was transferred from the training set to the test set, and the diagnostic performance was evaluated. In the test set, we detected pancreatic cancer with an AUC of 0.94 (95% CI 0.91 to 0.97), a specificity of 91.3% (95% CI 82.8% to 96.4%) and a sensitivity of 89.9% (95% CI 81.0% to 95.5%), resulting in an NPV of 99.8% (95% CI 99.6% to 99.9%) (ROC curve, figure 3A, table 3). The AUC of our biomarker signature was significantly higher than the AUC of CA19-9 (0.94 vs 0.85, p<0.001). Sensitivity (89.9% vs 74.7%, p<0.01) and specificity (91.3% vs 77.5%, p<0.05) were also significantly better. As illustrated by figure 3B, the biomarker signature improved the diagnostic accuracy in the training and test sets for the detection of pancreatic cancer and for the detection of resectable stages of pancreatic cancer when compared with CA19-9 (0.93 vs 0.84, p<0.001). Using a cut-off with a fixed 85% specificity for CA19-9 in the training set (cut-off 20.9 U/mL), a sensitivity of 86% (91% for resectable PDAC) was reached. In the test set, PDAC was detected with a 74% specificity and a 85% sensitivity (83% for resectable PDAC, online supplementary table S3) applying a cut-off of 20.9 U/mL for CA19-9. The biomarker panel performed with significantly higher specificity (p<0.01) than CA19-9 (cut-off level of 20.9 U/mL). Sensitivity increase was not significant. ROC curves for comparisons on serum samples and non-pancreatic controls are given in the online supplementary figure S1A–C.
Test performance characteristics for the biomarker signature from the training set (fixed specificity 85%) and test (transferred cut-off 0.384) set on plasma samples

(A–D) ROC curves of the biomarker (biomarker signature) results on EDTA plasma samples from all patients with pancreatic cancer versus patients with chronic pancreatitis (CP) (A) as well as from patients with resectable pancreatic ductal adenocarcinoma (PDAC) only in comparison to the patients with CP (B). The left panel represents the training set, whereas the right panel depicts the test set. ROC curves of the biomarker (biomarker signature) results on serum samples from all patients with pancreatic cancer versus blood donors and on EDTA plasma samples from all patients with pancreatic cancer versus non-pancreatic controls (C) as well as from patients with resectable PDAC only (D) in comparison to blood donors or non-pancreatic controls. EN included a 10-fold cross-validation and was applied on log10-transformed data. AUC, area under the curve.
supplementary figures
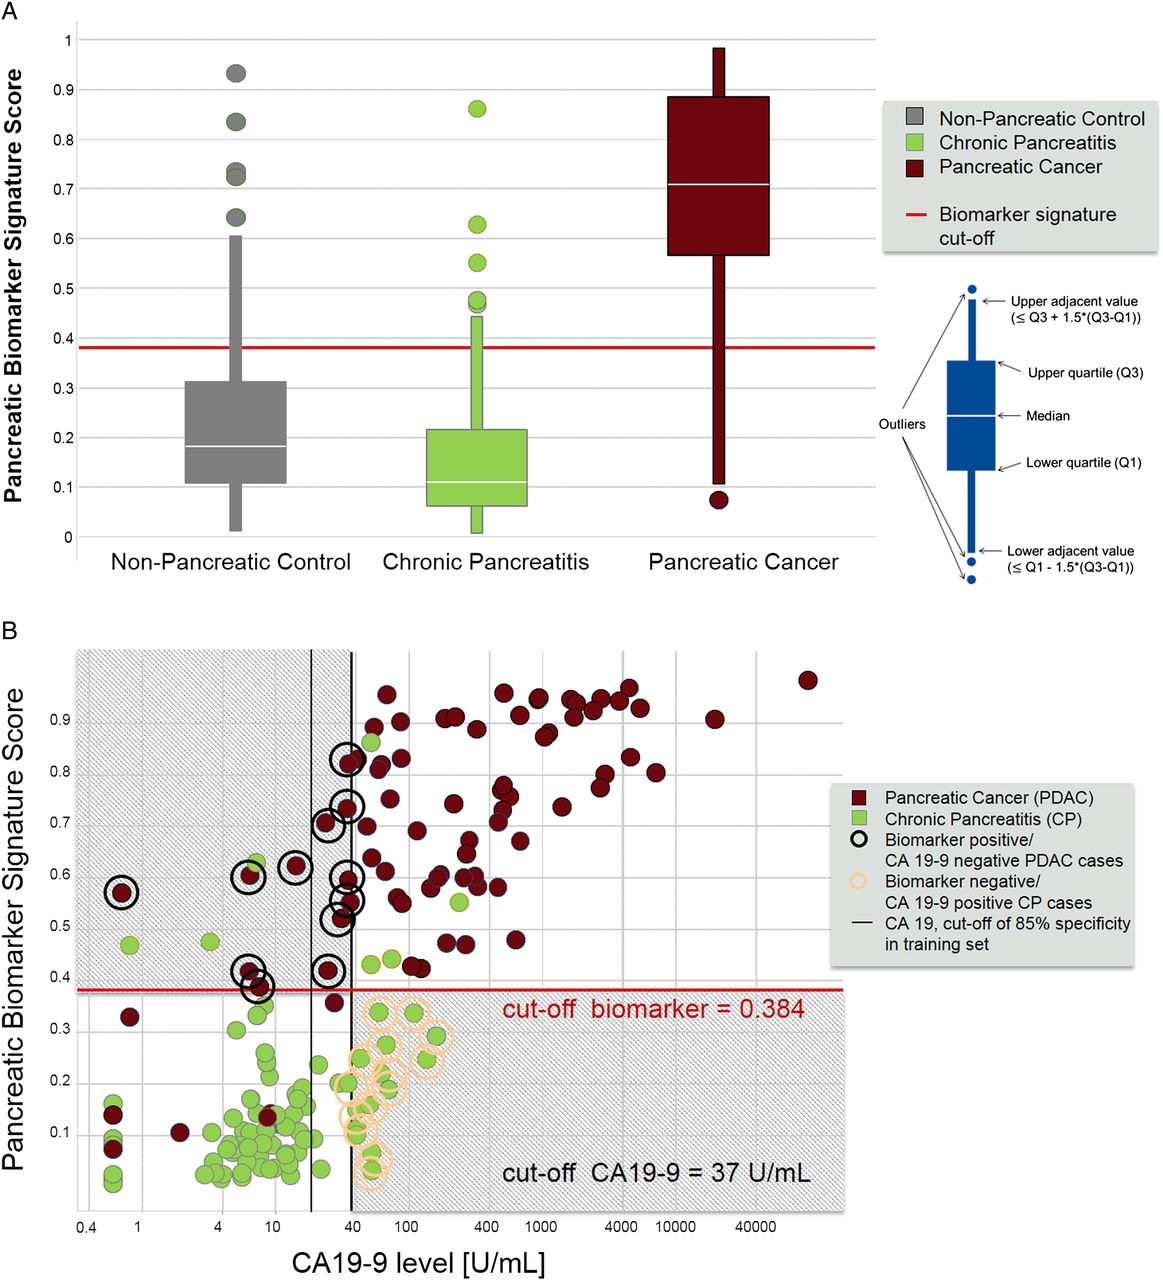
When applying the biomarker signature for the comparison of pancreatic cancer to the non-pancreatic control group, our biomarker signature performed with an AUC of 0.95 in the training set (serum samples) and with an AUC of 0.90 in the test set (plasma samples) (figure 3C, online supplementary tables S4 and S5). When only resectable stages were considered, an AUC of 0.87 in the training set (serum samples) and an AUC of 0.88 in the test set (figure 3D) were determined. AUC versus non-pancreatic control were not significantly different between the biomarker signature and CA19-9. The score of the biomarker signature as applied to the test set is shown in figure 4A. The overlap between non-pancreatic controls and patients with CP indicates that the distinguishing biomarker signature is characteristic for pancreatic cancer, rather than CP. Jaundice did neither affect sensitivity of our metabolite signature in all patients with pancreatic cancer (sensitivity 90%) nor in resectable stages of pancreatic cancer (sensitivity 100%) (see online supplementary table S6). For CA19-9 concentrations, we found a 25% (n=20) false-negative rate (cut-off 37 U/mL) in the test set. Using the biomarker signature, the rate of false negatives decreased to 11% (n=8, figure 4B, online supplementary figure S2). False positives for CA19-9 were 23% (n=18) compared with 9% (n=7) for the biomarker signature. In other words, in the test set we would have saved 14 of 80 patients with CP (17.5%), in whom pancreatic cancer could have been suspected, from unnecessary surgery. Conversely, 12 of the 79 patients with pancreatic cancer (15.2%) would have undergone surgery for pancreatic cancer based on the biomarker signature but would have been missed when CA19-9 alone was used to distinguish between cancer and pancreatitis (figure 4B).
(A) Score of the pancreatic biomarker signature identified in the training set and applied on the test set. Non-pancreatic controls in green (n=80), chronic pancreatitis in yellow (n=80) and pancreatic cancer in blue (n=79). Box plots give median, upper quartile and lower quartile by the box and the upper adjacent and lower adjacent values by the whiskers. The upper adjacent value is the largest observation that is less than or equal to the upper inner fence, which is the third quartile plus 1.5-fold IQR. The lower adjacent value gives the corresponding value for downregulation. The diagnostic cut-off of the pancreatic biomarker score was set to ≥0.384. (B) Scatter plot for graphical representation of the biomarker signature score. Classifiers are the biomarker signature generated in the training set and presented here for the test set. Y-axis score of biomarker signature with the cut-off of ≥0.384 and CA19-9 on the X axis with the cut-off ≥37 U/mL. Chronic pancreatitis in yellow circles (n=80) and pancreatic cancer in blue circles (n=79). Numbers give subjects that benefit from the biomarker signature and all numbers in the respective area of the plot.
Of note, the accuracy of the test was highest when using EDTA plasma in comparison to serum samples (see online supplementary table S4).
Discussion
Our study was designed to exclude suspected pancreatic cancer in patients with CP and we therefore aimed at optimising the NPV of the assay. To reduce healthcare expenditure and improve patient survival, any new diagnostic test requires the following: the sensitivity should exceed 88% and the specificity 85% when the pancreatic cancer incidence is 0.71%8 or 0.85% as in newly diagnosed diabetics within a period of 3 years.19 ,32 ,33 This requirement can be levelled when the incidence rises as in hereditary CP,3 ,9 ,34 ,35 familial pancreatic cancer or hereditary cancer syndromes.10–12 Thus, the biomarker signature identified here would exceed these high standards.
In 2011, Bathe and coworkers showed the feasibility of untargeted metabolomics to distinguish malignant pancreatic lesions by employing 1Proton Nuclear Magnetic Resonance (1H NMR) analysis of 58 metabolites in 99 samples from patients with hepatobiliary disease and pancreatic cancer.36 This study was followed by three independent studies which investigated 298 patients by MS-based metabolite profiling in blood samples.21 ,37 ,38 In a targeted approach on 80 patients, complex lipids were shown to be of some diagnostic use.39 We used untargeted and targeted metabolomics approaches including lipidomics to identify a multimarker signature which was consecutively tested in a training and validation (test) set together with CA19-9. Both sets were compared with CA19-9 as an established biomarker and current gold standard. The strengths of our study are the large number of patients and controls included, the large number of metabolites analysed (477) and the differentiation between training and test sets. Furthermore, we tested both serum and plasma as basis for a robust assay development. To the best of our knowledge, this study represents the largest metabolome investigation of any kind of cancer to date. Our biomarker signature and the classification model were selected before the test data set was analysed; therefore, our performance estimates of the test data are unbiased.
The biomarker signature identified here detected only 9% false positives compared with 23% for CA19-9. Theoretically, the latter patients would have undergone unnecessary pancreatic resection with a reported mortality of up to 8%.40 Conversely, the biomarker signature identified an additional 15% of patients in whom the diagnosis of pancreatic cancer was missed when using CA19-9 alone. Assuming a cumulative cancer incidence of 1.95% (as in patients with CP), the NPV of our biomarker signature in the test dataset was 99.8% (95% CI 99.6% to 99.9%) and the diagnostic accuracy 90.6% (95% CI 84.9% to 94.6%). This can be regarded as a significant advance in the field.
Of note, there was no loss of diagnostic accuracy in the training and test studies when only patients with resectable pancreatic cancer were analysed, suggesting that total tumour burden has little influence on the metabolic signature of pancreatic cancer.
We have used a semiquantitative assessment of metabolite measurement produced by using untargeted and targeted metabolomics platforms in our study. The benefit of employing these platforms is the ability to detect biologically relevant metabolites for which no commercial standards are available and express their abundance as a ratio to a well-characterised sample pool (for details, see online supplementary material methods). As we used untargeted and targeted platforms, we took utmost care to obtain most accurate semiquantitative values by excluding an instrumental drift, using two different reference samples always analysed in parallel to allow an alignment of different analytical batches and by applying quality control measures for metabolomics as previously suggested.41 We have performed a technical validation, and our multimarker signature plus CA19-9 will shortly undergo external validation.
More recently, a microRNA (miRNA) panel for the differential diagnosis of pancreatic cancer and CP has been reported by Schultz et al20. Based on this panel, a Clinical Laboratory Improvement Amendments (CLIA) service is now available in the USA. The authors reported a sensitivity of 85%/85% (training/test) and a specificity of 85%/99%, respectively. Thus, the biomarker signature described here is more sensitive (94.9%/89.9%) with a similar specificity (85%/91.3%), allowing for a more accurate exclusion of pancreatic cancer in individuals with a negative test result.
Setting out with the aim of earlier diagnosis of pancreatic cancer, Mayers and co-workers showed an elevation of branched-chain amino acids conferring a twofold risk to develop pancreatic cancer within 2–5 years.42 The same group also showed prediagnostic circulating levels of tricarboxylic acid intermediates to predict survival of patients with pancreatic cancer.43 Of note the role of complex lipids has not been addressed in this setting.
Pancreatic cancer has a very poor prognosis with a 5-year survival rate of only 6%. This is largely due to the late detection of pancreatic cancer with 80%–85% of patients being diagnosed in unresectable stages. Diagnosis is further hampered in the presence of CP, but earlier detection would increase survival by 30%–40%. Thus, there is a clear medical need for the early detection of pancreatic cancer in patients with CP. Current guidelines on CP recommend annual follow-up visits for patients with CP to detect complications early, which include tumour formation in the pancreas.44 However, the means for such a surveillance of approximately 432.015 patients with CP in the USA alone are currently neither available nor affordable.2 A metabolic biomarker signature may also have the potential for screening in other high-risk cohorts, for example, patients with newly diagnosed diabetes over the age of 45 years (>1 292 000 cases annually in the USA) (http://diabetes.niddk.nih.gov/dm/pubs/statistics), but this application of the biomarker panel would require confirmation in population-based studies. The identification of a metabolic biomarker signature for pancreatic cancer may give some insight into the underlying disease mechanisms of pancreatic cancer. Sphingolipids are characterised by the presence of the particular aliphatic aminoalcohol sphingosine, also termed a long-chain base. Cleavage of sphingomyelins by sphingomyelinase generates ceramide, which promotes apoptosis, cell cycle arrest and cellular senescence.25 ,45 Ceramide concentrations increase in response to cellular stress, such as DNA damage, disruption of lysosomal compartments or exposure to apoptotic stimuli.46 Although ceramide can be synthesised de novo, it is rapidly produced from sphingomyelin by the stress-induced activation of neutral and acid sphingomyelinase.47 Ceramide can promote the clustering of death receptors and interferes with the relay of PI3K signals. Sphingolipid metabolites have therefore been recognised as important modulators of cell survival, cell growth, migration and angiogenesis and have been attributed an important role in cancer progression.25 ,48 Among our 477 metabolites, the 10 compounds that make up the final panel include two sphingomyelins, one phosphatidylcholine, one sphinganine-phosphate and one ceramide. This further supports the role of ceramides in previously suggested regulating senescence and apoptosis in human pancreatic cancer48 and emphasises the value of this first large-scale study investigating cancer metabolomics and lipid metabolites. To what extent this finding has potential beyond the development of a diagnostic assay for the more accurate and earlier detection of pancreatic cancer will be the focus of further mechanistic studies.
In conclusion, metabolomics has just begun to enter the field of cancer diagnostics and tumour biology. Our data clearly demonstrate the value of a comprehensive metabolite profiling platform, including lipidomics, in the largest cancer cohort investigated so far. The results demonstrate the feasibility of developing a diagnostic test that can detect pancreatic cancer with greater accuracy (>90%) than has previously been achieved with either conventional tumour markers or an miRNA panel.
References
Footnotes
JM and HK shared first co-authorship.
RG and MML shared senior authorship.
Contributors Study design: JM, HK, RR, BK, MML; patient and biomaterial recruitment: JM, HK, CP, JAS, C-DH, FUW, RG, UMM; data acquisition: RR, BK, EP, BS, SGM, PS; statistical analysis: EP, SGM; writing committee: JM, RR, BK, MML; manuscript revision and approval: HK, EP, BS, SGM, CP, PS, JAS, C-DH, FUW, RG, MD,UMM.
Funding Supported by the Deutsche Krebshilfe/Dr. Mildred-Scheel-Stiftung (109102), the Deutsche Forschungsgemeinschaft (DFG MA 4115/1-2/3), the Federal Ministry of Education and Research (BMBF GANI-MED 03IS2061A and BMBF 0314107, 01ZZ9603, 01ZZ0103, 01ZZ0403, 03ZIK012) the European Union (EU-FP-7: EPC-TM), the Wilhelm Sander Stiftung (2009.039.2) and EFRE-State Ministry of Economics MV (V-630-S-150-2012/132/133), the popgen 2.0 network is supported by a grant from the German Ministry for Education and Research (01EY1103), Patent applications have been filed for the identified biomarkers under accession numbers WO 2011/151252 and WO 2013/079594 by Metanomics Health GmbH.
Competing interests None declared.
Patient consent Obtained.
Ethics approval Az. 110/99, ethics committee Greifswald.
Provenance and peer review Not commissioned; externally peer reviewed.