Article Text

Abstract
Objective Chronic HBV infection affects more than 250 million people worldwide and remains a global healthcare problem in part because we lack curative treatment. Sustained viral control requires HBV-specific T cells, but these become functionally impaired in chronic infection. Clinical evidence indicates that functional cure of HBV infection by the host immune response is feasible. Developing T cell-based therapies able to achieve functional cure will require identification of the requirements for a successful T cell response against HBV and the relative contribution of individual T cell specificities to HBV control.
Design The phenotype and function of HBV-specific T cells were studied directly ex vivo using fluorochrome-labelled multimers. We studied multiple HBV-specific T cell specificities targeting different HBV proteins in individuals with either an acute self-limiting or chronic HBV infection.
Results We detected strong T cell responses targeting multiple HBV viral proteins in acute self-limiting and low-frequency core and polymerase-specific T cells in chronic infection. Expression of the T cell inhibitory receptor PD-1, as well as T cell differentiation, T cell function and T cell regulation differed by stages and outcomes of infection. In addition, these features differed significantly between T cells targeting different HBV specificities.
Conclusion HBV-specific T cells with different target specificities are characterised by distinct phenotypical and functional profiles. These results have direct implications for the design of immunological studies in HBV infection, and are potentially relevant for informing immunotherapeutic approaches to induce functional cure.
- hepatitis B
- acute hepatitis
- chronic hepatitis
- cellular immunity
Statistics from Altmetric.com
Significance of this study
What is already known on this subject?
Virus-specific CD8 T cells are required for sustained control of HBV.
Acute self-limiting infection is characterised by a strong and multispecific functional T cell response, whereas HBV-specific T cell responses in chronic infection are weak, narrowly directed and dysfunctional.
Functional cure of HBV is expected to require effective T cell responses.
The PD-1 coinhibitory pathway plays a central role in the regulation of effective T cell immunity, as well as T cell exhaustion.
What are the new findings?
PD-1 expression on HBV-specific T cells is not only determined by the stage of infection, but also by the HBV region targeted by a response.
Beyond PD-1 expression, HBV-specific CD8 T cell responses targeting different epitopes within an individual vary in their T cell differentiation status, expression of regulatory molecules and antiviral functionality.
In contrast to HCV infection, differences in the phenotype of HBV-specific T cell responses do not result from lowered levels of T cell receptor stimulation due to viral escape mutations.
How might it impact on clinical practice in the foreseeable future?
These findings indicate that studies monitoring HBV-specific T cell responses in HBV-infected individuals need to be designed taking into account a potential bias introduced by analysis of differing HBV specificities.
The data also suggest that distinct HBV specificities have variable potential for T cell-based therapeutic approaches and will respond differentially to immunotherapy with PD-1 blockade.
Introduction
Chronic HBV infection remains a major global health problem, affecting more than 250 million people worldwide.1 2 Current antiviral therapies can effectively suppress viral replication and significantly improve the disease course. However, these treatments are not accessible for many infected individuals. Antiviral therapy also rarely leads to HBs seroconversion, which indicates functional cure, and therefore has to be continued indeterminately. Novel therapeutic approaches that reliably lead to cure of chronic HBV infection after a limited treatment course are urgently needed.
Whether complete cure, that is, eradication of HBV covalently closed circular DNA, is feasible remains unknown.3 In contrast, functional cure, or long-term immunological control without treatment, is a common outcome of HBV infection. Most adults infected with HBV exhibit controlled viraemia and seroconversion to anti-HBs4; a subset of people with chronic infection achieve the same, usually after a course of antiviral treatment.5–8 This sustained immunological control likely requires a strong and multispecific T cell response against HBV, as suggested in both animal and human studies.9–11 However, the precise requirements to achieve an effective HBV-specific T cell response remain undefined, despite many important contributions identifying potential mechanisms of T cell inhibition.12–21 It also remains unclear which of these molecular mechanisms are the key impediment to an effective T cell response in uncontrolled infection and which represent the best targets for immunotherapeutic interventions. On the other hand, T cell exhaustion, mediated by inhibitory receptors such as PD-1, has emerged as a plausible candidate for being key to HBV-specific T cell dysfunction.12 22–26 This pathway offers an attractive therapeutic option since specific therapies targeting this pathway have been developed and successfully implemented in human cancer.
An improved understanding of the mechanisms behind successful and failed HBV-specific T cell responses requires a detailed study of patients with acute infection who go on to control the virus. In particular, such results must be compared against analyses of T cells in different stages of chronic infection. However, undertaking such studies has been difficult. While T cell responses in acute infection are relatively robust, acute HBV infection is rare in the industrialised world. In chronic infection the major hurdle has been the low frequencies of HBV-specific CD8 T cells in the blood, leading most studies to rely on analysing these cells after in vitro expansion.5–7 26–28 Recent refinements of immunological tools, such as HLA multimer technology, together with the ability to extract large amounts of information from even single cells, can overcome these difficulties, promising a new era in HBV T cell immunology.
Here we performed a longitudinal direct ex vivo analysis of HBV-specific CD8 T cell responses in adult patients with acute HBV infection who proceeded to viral control. To characterise these responses, we studied expression of inhibitory receptors, T cell memory differentiation, transcriptional regulation and T cell function. We detected the expected broadly directed HBV-specific CD8 T cell response, yet also identified differences in phenotype and function of HBV specificities based on the HBV protein being targeted. Most pronounced and sustained were differences in the expression of the inhibitory receptor PD-1 and memory differentiation markers between cells targeting HBV core compared with polymerase. Similar differences were also observed in direct ex vivo analysis of HBV core and polymerase specificities in chronic HBV infection. Our results have important implications for the design of studies monitoring the T cell response in HBV infection and may inform the development of immunotherapeutic interventions, most notably those based on PD-1 blockade.
Methods
HBV cohort
Patients were recruited at Massachusetts General Hospital (Boston, USA), Fiocruz (Rio de Janeiro, Brazil) and Erasmus Medical Center (Rotterdam, The Netherlands). A total of 55 HLA-A*02-positive patients were included for this study; 25 were following an acute HBV infection and 30 during chronic infection. All patients were negative for hepatitis A, C and D virus and HIV. Chronic infection was defined by a positive hepatitis B surface antigen (HBsAg) for at least 6 months with anti-hepatitis B core (HBc) positivity. Acute infection was defined by the onset of an acute hepatitis, a positive HBsAg and a positive anti-HBc-IgM. Following acute infection, participants were longitudinally monitored up to approximately 1 year after clinical presentation. The infection was self-limiting in all acute patients, serologically defined by loss of the HBsAg, undetectable HBV DNA and development of anti-HBs. Peripheral blood was obtained, and mononuclear cells (peripheral blood mononuclear cells, PBMCs) were isolated using Ficoll-Paque (Sigma-Aldrich) density gradient centrifugation. Cells were subsequently resuspended in RPMI 1640 plus 10% fetal calf serum (FCS) and stored in the vapour phase of liquid nitrogen. All samples were sequenced for HLA typing at the University of Oklahoma Health Sciences Center. This study was approved by the respective local institutional review boards and all subjects had given informed consent.
HLA class I multimers
HLA class I multimers were ordered from ProImmune or through the National Institutes of Health (NIH) Tetramer Core Facility, Atlanta. HLA-A*02 multimers were specific for five epitopes core 18-27 (FLPSDFFPSV); polymerase 455-463 (GLSRYVARL) and 575-583 (FLLSLGIHL); and envelope 183-191 (FLLTRILTI) and 355-343 (WLSLLVPFV). Non-HLA-A*02 multimers, restricted by seven different HLA alleles, were specific for six core and four polymerase epitopes (online supplementary figure S1). ProImmune multimers were used in conjunction with phycoerythrin (PE) or allophycocyanin (APC) Fluortag. NIH multimers were generated by using streptavidin-PE or APC according to the NIH core facility protocol.
Supplementary file 1
Magnetic bead enrichment of non-HLA-A*02-HBV-specific T cells
Non-HLA-A*02-specific T cells were enriched using MACS columns (Miltenyi Biotec), according to manufacturer’s protocol. PBMCs were stained with HBV multimers as mentioned above and used in combination with anti-PE and APC magnetic beads. Samples were subsequently enriched over MACS columns.
Flow cytometry
Antibodies were ordered from BioLegend, BD Biosciences and eBioscience (see online supplementary figure S2A,B). Cell samples were stained with a viability dye (Invitrogen LIVE/DEAD Fixable Blue) according to manufacturer’s protocol. Multimers were then applied for 10 min at room temperature. Cells were washed with phosphate-buffered saline containing 2% FCS, pelleted, then stained with surface antibodies for 30 min on ice before fixation in 2% paraformaldehyde (Fisher Scientific). For the detection of intracellular proteins, a FOXP3 fixation/permeabilisation buffer set (BioLegend) was used according to manufacturer’s protocol. Compensation beads (BD Bioscience, catalogue number 552843) were used for compensation set-up and rainbow beads (BD Bioscience, catalogue number 556298) for laser calibration.
Functional assays of HBV-specific T cells
Samples were rested overnight at 37° in R10 medium (RPMI 1640 (Sigma-Aldrich), 2% FCS, 1.5% 1 M HEPES buffer (Fisher Scientific), L-glutamine 100X (Fisher Scientific) and Streptomycin/Penicillin 50X (Fisher Scientific)). Cells were simultaneously stained for core18 and Pol455-specific responses, as described. The sample was distributed over three conditions (HBV peptide, negative and a positive control) containing 400 µL R10, 10 µL/mL anti-CD28/49d (BD Biosciences), protein transport inhibitor 2 µL/mL (eBioscience) and CD107a antibody. The cell stimulation cocktail 2 µL/mL (eBioscience) was used as positive control. Peptide-specific samples were stimulated with cognate HBV peptides at 10 µg/mL. Cells were incubated for 3 hours, washed and stained for intracellular cytokines. The negative condition was used to subtract any background staining.
Expression of HBV viral proteins on HepAD38 cells
HepAD38 cells were fixed in 2% paraformaldehyde for 20 min at room temperature and blocked with 1% bovine serum albumin. Expression of core, surface and polymerase antigens was determined after permeabilisation with 0.05% saponin using a mouse monoclonal against HBs (clone 1044/329, Bio-Techne), a rabbit polyclonal HBc (Clone B0586, DAKO) and a mouse monoclonal anti-HBV polymerase (clone 2C8, Santa Cruz Biotechnology) and AF647-labelled goat secondary antibody targeting mouse or rabbit IgG.
In vitro expansion of HBV-specific T cells
PBMCs were seeded at 1 million cells per mL of R10/50 media (R10 containing recombinant interleukin-2 (Sigma-Aldrich)). Cells were incubated with cognate HBV peptides (10 µg/mL) and analysed after 14 days.
Viral sequencing
For sequencing, DNA was extracted from 200 µL of each serum sample using the QIAamp DNA Blood Mini Kit according to manufacturer’s instructions, with selected regions of the HBV genome being amplified by a nested PCR. Primers used for amplification are listed in online supplementary figure S3. Acute samples were sequenced at the first and the latest available time point, and chronic samples were sequenced at the first available time point.
Statistical analysis
Samples were analysed on an LSR-II flow cytometer (Becton Dickinson) and analysed using FlowJo software (V.10.4.1). Statistical analyses were performed by using the Wilcoxon paired test, the Mann-Whitney U test, or the Kruskal-Wallis and Dunn’s multiple comparisons test. *P≤0.05; **P≤0.01; ***P≤0.001; ****P≤0.0001. All the statistical analyses were performed using GraphPad Prism software V.7.
Results
Direct ex vivo analysis of HBV-specific CD8 T cell responses in acute resolving and chronic infection
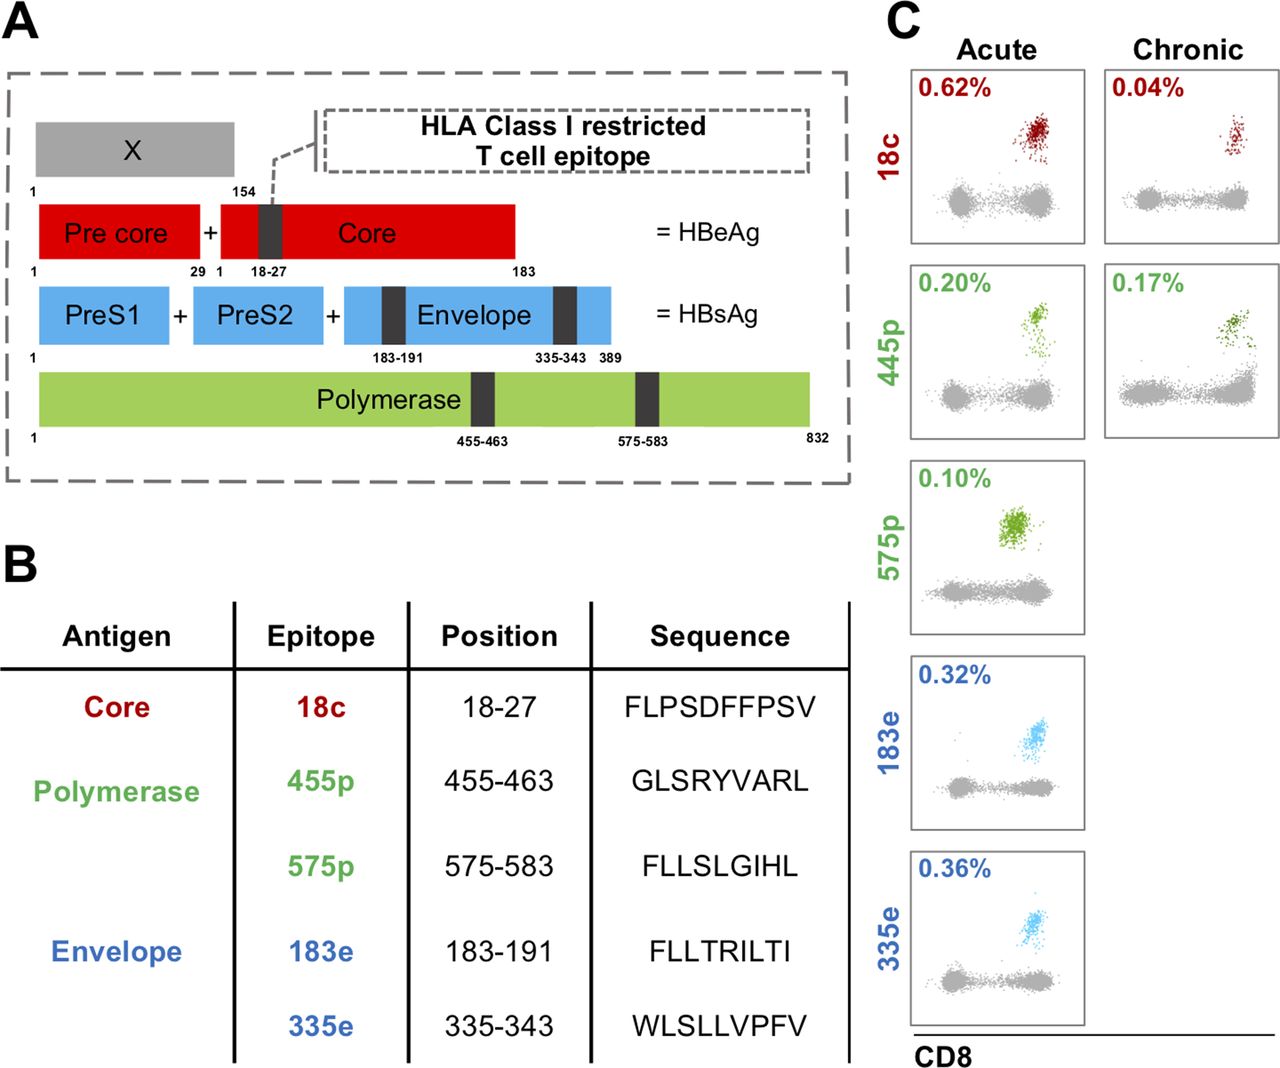
We screened a total of 55 HLA-A*02-positive HBV-infected patients directly ex vivo for HBV-specific CD8 T cell responses using a set of five HBV HLA multimers recognising epitopes in HBV core, envelope and polymerase (figure 1). Of 25 acute patients, 23 had detectable HBV-specific CD8 T cell populations; in chronic infection, such responses were detected only in half (15/30) of the patients. We selected 12 acute subjects for subsequent longitudinal phenotyping during the early phase (within 6 weeks after the onset of symptoms) and late phase (40 weeks after the onset of symptoms) of acute infection. The 12 subjects were selected for sufficient sample availability and for the size of their specific T cell populations enabling high-quality phenotyping. Chronic patients were studied at the first available time point. Clinical details of the included patients are presented in table 1A,B.
Clinical characteristics of HBV-infected patients

Virus-specific CD8 T cell responses targeting different HBV viral proteins. (A) HBV-specific CD8 T cells target all four HBV proteins: envelope, core, polymerase and the X protein. For the five HLA-A*0201 multimers used in this study, we show the localisation of the respective epitopes with the different HBV proteins. (B) Additional information about the five multimer epitopes. (C) Representative ex vivo multimer staining for acute and chronic HBV infection.
In acute infection, 11 of the 12 patients had detectable responses against four or five different epitopes (table 1A). The breadth of the response was maintained over time, but frequencies of the specific CD8 T cells declined (median: early phase 0.061% vs late phase 0.015%; p=0.0001). There were no significant differences between the frequencies of individual specificities (online supplementary figure S4A). In contrast, the ex vivo response in chronic infection was more focused, with 12/15 patients responding to core18 and 8/15 to pol455, of which five recognised both (table 1B and online supplementary figure S4B). We detected responses towards one or more of the other three epitopes in only one chronic patient (CR7212, the patient with the highest viral load), targeting both envelope targets (online supplementary figure S4B). However, envelope responses appeared to be present even in chronic infection, as we were able to expand envelope specificities in vitro after peptide stimulation in 6/6 patients (online supplementary figure S4C,D). Overall, these data confirm previous studies describing the limited HBV-specific CD8 T cell repertoire that is detectable directly ex vivo in chronic, compared with acute HBV infection.6 28–30 Nevertheless, we identified a sufficient number of ex vivo responses even in chronic infection to allow further phenotypic analysis. This is important, as phenotyping after in vitro expansion of virus-specific CD8 T cells significantly alters phenotypic profiles compared with direct ex vivo analysis (online supplementary figure S5).
Virus-specific CD8 T cells targeting different HBV proteins display distinct PD-1 expression profiles
Given the central role of the PD-1 pathway in regulation of both successful T cell responses and T cell exhaustion,31 we analysed PD-1 expression on all HBV-specific T cells that were detectable directly ex vivo in our patient cohorts (figure 2A). As expected, we found overall high percentages of HBV-specific CD8 T cells expressing PD-1 during early acute as well as in chronic infection. Fewer cells expressing PD-1 were detected, once HBV was controlled in the late phase of primary infection (figure 2B). However, we also observed a pronounced intraindividual variability of PD-1 expression for T cell responses targeting different HBV proteins. When detectable, specificities targeting the envelope protein had the most PD-1-positive cells, followed by the core18 response. Polymerase responses were at the other end of the spectrum, displaying the lowest PD-1 expression levels in all cohorts, particularly for pol455. Even as expression levels of PD-1 changed over time in patients followed through acute HBV infection, the relative hierarchy of PD-1 expression levels was maintained. In order to extend these findings beyond HLA-A*02 we studied the expression of PD-1 on non-HLA*A2 core and polymerase-specific T cells restricted by seven different alleles (online supplementary figure S1) in acutely infected patients. Results were comparable to those for HLA-A*02 core18and pol455,575 responses in acute infection, with a trend towards lower PD-1 expression levels for cells targeting polymerase (figure 2C). Overall, these data demonstrate that the impact of T cell specificity on PD-1 expression is on the same scale as the impact observed for viral control.
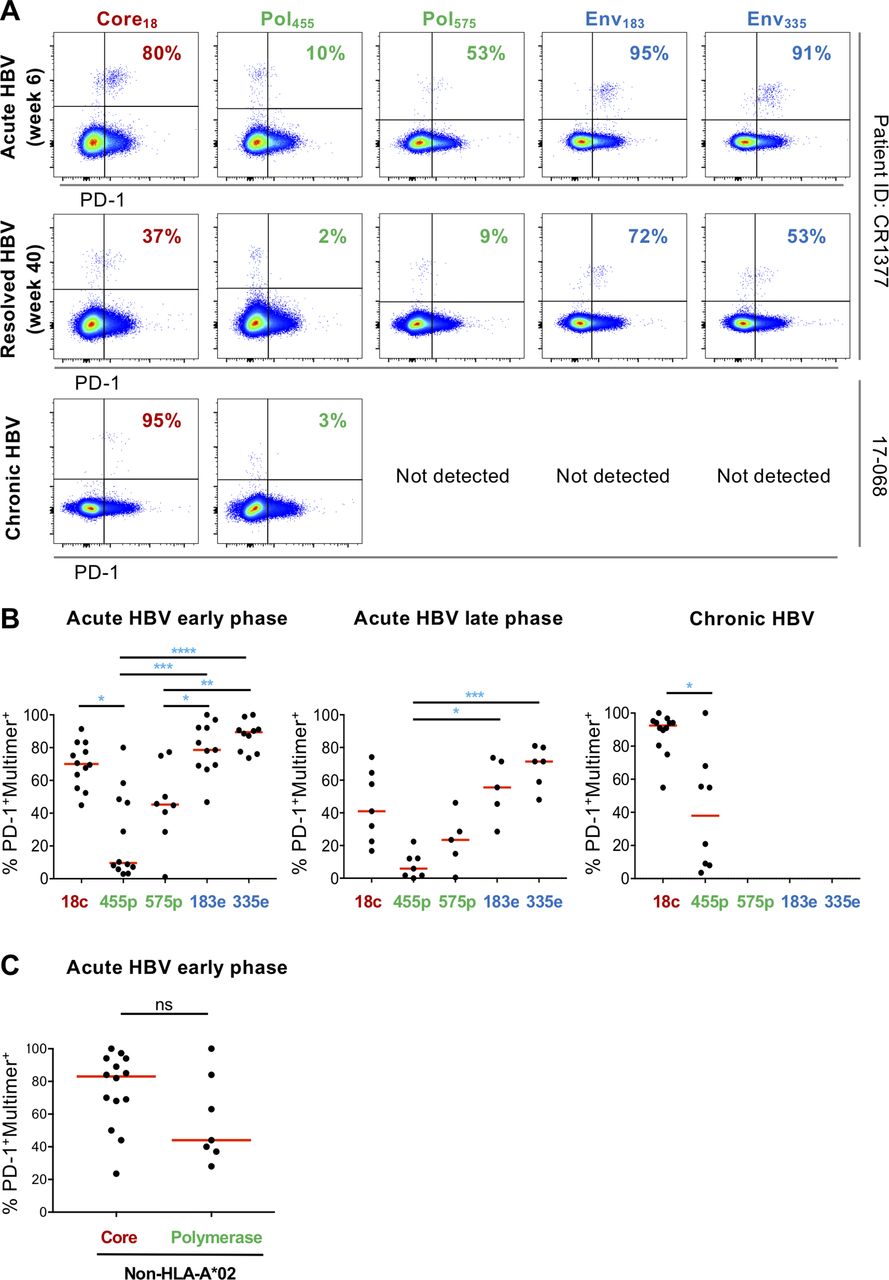
PD-1 expression on HBV-specific T cells is determined by the stage of infection and the targeted viral protein. (A) Examples of PD-1 expression by HBV-specific T cells targeting different specificities within one individual. Representative results from one patient with acute infection early and late and from another with chronic infection are displayed. (B) The percentage of PD-1 expression on epitope-specific T cells in two cohorts of patients with acute and chronic infection. Red line indicates median. (C) PD-1 expression on non-HLA*A2 core and polymerase-specific T cells in acute HBV-infected patients. Statistical analysis was performed by (B) Kruskal-Wallis test and Dunn’s multiple comparisons correction and (C) the Mann-Whitney U test. *P≤0.05; **P≤0.01; ***P≤0.001; ****P≤0.0001. ns, not significant.
HBV CD8 specificities with distinct PD-1 expression levels are further characterised by distinct patterns of memory differentiation and different phenotypes
Expression of PD-1 on HBV-specific CD8 T cells, but also on CD8 T cells targeting HIV, HCV, Epstein-Barr virus, cytomegalovirus (CMV) and influenza,23 32–34 is correlated with distinct patterns of memory differentiation. Typically effector memory T cells express the highest levels of PD-1, whereas naïve-like and late differentiated T cells express PD-1 at much lower levels (online supplementary figure S6), though these patterns vary on virus-specific T cells depending on which viral infection is analysed.35 We therefore analysed memory differentiation using CD45RA and CCR7 on HBV-specific core18 and pol455 responses, as they were detectable in all stages of infection (figure 3). Most core18-specific CD8 T cells were effector memory T cells (TEM, CD45RA and CCR7 double-negative), irrespective of infection stage. In contrast, pol455 responses displayed a more mixed memory differentiation profile, with both TEM and TEMRA (CD45+ CCR7−) populations. In addition, chronic patients had a third pol455 subpopulation of naïve-like T cells. These findings indicate a profound and lasting effect of the HBV target on memory differentiation.

Epitope-specific T cells display distinct memory differentiation patterns. (A) Examples of CD45RA and CCR7 staining to determine T cell differentiation state on total CD8 and HBV-specific T cells. (B) The frequency of central memory (TCM=CCR7 positive/CD45RA negative), naïve (TN=CCR7/CD45RA double-positive), TEMRA (TEMRA=CCR7 negative/CD45RA positive) and effector memory (TEM=CCR7/CD45RA double-negative) populations is shown for core18 and pol455-specific T cell responses in different infection stages. *P≤0.05; **P≤0.01; ***P≤0.001; ****P≤0.0001.
We subsequently extended our analysis to additional markers associated with T cell activation, homing, inhibition, transcriptional regulation and function. We studied each HBV-specific T cell response in its entirety, including naïve-like T cells.36 The median percentage of cells expressing each marker in the three infection stages is presented in figure 4 for both core18 and pol455-specific T cells, with additional data on relative expression levels for select markers. Corresponding representative flow plots are presented in online supplementary figure S7. These combined data represent something akin to a fingerprint for each virus-specific T cell population. Again, we see that these fingerprints are distinct between different disease stages, and between core and polymerase responses within a patient. Most notable for the intraindividual differences, apart from PD-1 expression levels, are the results for CD127, 2B4 and CD160 in acute HBV infection; their expression patterns were exactly the opposite from the results for PD-1. This was expected for the memory marker CD127,37 38 but not for 2B4 and CD160, which are T cell inhibitory receptors like PD-1. In chronic infection, 2B4 and CD161 expression paralleled the PD-1 results, with higher expression on core18 cells. Thus, beyond the distinct expression patterns of PD-1 we found complex and evolving fingerprints of T cell differentiation and phenotype in different stages of infection, and within an individual between HBV-specific CD8 T cells that target core18 or pol455.

HBV-specific T cells have distinct phenotypical fingerprints determined by epitope specificity and infection stage. Radar plots depicting the median percentage of HBV-specific CD8 T cells expressing different T cell markers on the surface and intracellularly for acute early (A), acute late (B) and chronic (C) infection. Results for core18 responses are depicted by red shading and for pol455 responses by a black line. For a select group of markers results are also shown as median fluorescence intensity in separate graphs. Examples for staining of the different molecules are presented in online supplementary figure S4. All patients were phenotyped with the full antibody panel (online supplementary figure S2A: antibodies 1–19) except for patient 18-008, lacking staining for antibodies 12–19, due to limited cell availability. *P≤0.05; **P≤0.01; ***P≤0.001; ****P≤0.0001.
Different HBV-specific CD8 T cell populations within individuals also have distinct functional properties
In addition to memory differentiation and phenotype differences, we quantified the cytotoxic and degranulation activity of HBV-specific T cells directly ex vivo after peptide-specific stimulation. These assays deliver meaningful results only through the analysis of sufficiently large T cell populations; therefore, we limited these experiments to patients with acute HBV infection. HBV-specific T cells with strong PD-1 expression (core18-specific T cells) were compared with those with minimal PD-1 expression (pol455-specific T cells) (figure 5). We observed stronger CD107a mobilisation (median: 44% vs 21%; p=0.03) and interferon-γ secretion (median: 38% vs 11%; p=0.02) for core18-specific compared with pol455-specific T cells. Tumour necrosis factor-α production also appeared higher in core18-specific T cells (median: 18% vs 10%; p=0.056). The data demonstrate that the different T cell phenotypes we observed also translate into distinct T cell functionalities.

Epitope-specific T cells exhibit distinct functional properties. Ex vivo intracellular cytokine staining (ICS) for core18 and pol455-specific T cells during acute HBV infection. Core and polymerase responses were simultaneously studied within the same individuals. (A) Sample staining showing unstimulated, peptide-stimulated and PMA/ionomycin-stimulated cells. Percentages indicate HBV-specific T cell frequency of double positives. (B) Summary of ICS results from five patients studied at a mean of 8 weeks after the onset of symptoms in acute infection. Percentages indicate HBV-specific T cell frequency of single positives. *P≤0.05; **P≤0.01; ***P≤0.001; ****P≤0.0001. IFN, interferon; TNF, tumour necrosis factor.
Viral sequence variation does not account for epitope-specific CD8 T cell phenotypes
HBV is capable of escaping CD8 T cell selection pressure through the generation of viral sequence variants.39 40 The impact of viral escape on the phenotype of virus-specific T cells has been well documented for chronic HCV,33 41 with diminished T cell receptor (TCR) signalling leading to lower PD-1 and higher CD127 expression. Less is known on the impact of sequence variation of T cell responses in HBV infection. The circulating HBV genome was sequenced in 16 HLA-A*02 positive patients (acute and chronic n=8), of which a total of six acute and seven chronic patients were included in this study (table 2). In acute infection, the virus was sequenced at both the earliest and latest time points available; little sequence variation was observed in these patients, excluding a role for viral diversity in the different T cell profiles during early infection. However, distinct heterogeneity was detected in the sequences from chronic patients, most notably in the core18 and env183 epitopes. Nevertheless, these sequence variations do not explain our phenotypic findings, since responses to the core18 epitope displayed the most homogeneous phenotypic profiles, with strong expression of both PD-1 and CD127 in almost all chronic patients. Conversely, profiles of cells targeting pol455 were more heterogeneous, including lower expression of PD-1, but the virus was mostly preserved in this region. Overall, the sequence data do not explain the phenotypic differences we observe between HBV-specific CD8 T cell responses.
Viral sequence variation in acute and chronic HBV infection in HLA-A*02-positive individuals
Discussion
We performed a detailed analysis of the phenotype and function of HBV-specific CD8 T cell responses during acute self-limiting and chronic infections. Importantly, all analyses were performed directly ex vivo, including in the chronic patients, since in vitro expansion of T cells before analysis induces profound changes in their phenotype (online supplementary figure S5). First, we established the repertoire and frequency of HBV-specific T cell responses in these patients. In line with previous studies, acute infection was characterised by strong and multispecific T cell responses targeting HBV core, polymerase and envelope in nearly all individuals.9 10 29 30 This is in contrast to chronic infection,6 12 in which we detected responses only in about half of patients, with almost exclusively low-frequency responses targeting HBV core and polymerase.
Persistent exposure to HBV surface antigen is suggested to cause deletion of envelope-specific T cells in chronically infected patients. Indeed, we could not detect these specificities directly ex vivo in all but one chronic patient. This patient also had by far the highest viral load of all chronic patients we analysed, raising the possibility that the patient was sampled during a transition phase in his clinical course. In other chronic subjects we were capable of identifying envelope-specific T cells after in vitro expansion in 6/6 cases we tested, indicating that these specificities are not fully absent from the circulation, but are rather below the detection limit of standard direct ex vivo assays. We and others have used magnetic bead enrichment to detect such low-frequency HLA multimer responses in HCV infection; this approach will likely also allow direct ex vivo analysis of a broader repertoire of HBV specificities and of sufficiently large T cell populations in chronic HBV infection. This enrichment approach could be especially powerful in conjunction with large PBMC donations such as those obtained by leukapheresis, enabling the study of thousands of virus-specific T cells even from small populations in chronic infection.42
Subsequent phenotypic analysis of the identified T cell populations revealed unexpected differences based on the targeted HBV protein. Most notably, envelope-specific T cells expressed high levels of PD-1 during acute infection, with barely lower expression in responses targeting core18. In contrast, two polymerase specificities expressed PD-1 at significantly lower levels, in both cross-sectional and intraindividual comparison (figure 2B). Similar patterns were observed for additional non-HLA-A*02 restricted responses in acute infection, though the number of non-HLA-A*02 responses we could analyse was relatively small (figure 2C). It will be important to further broaden HBV T cell analyses to a wider range of specificities, in order to fully define how targeting different HBV proteins, but also individual HBV epitopes, impacts the T cell phenotype.
While PD-1 expression levels declined after HBV control in acute infection, with a positive correlation between serum HBsAg levels and PD-1 expression levels for envelope-specific cells (r=0.45, p=0.01, data not shown), the relative hierarchy of PD-1 expression between responses targeting different HBV proteins was maintained even in the absence of viraemia and circulating HBV antigens in late acute infection. And a similar difference in PD-1 expression between responses targeting different epitopes was also observed in chronic infection, though for this patient group we could only compare the two specificities targeting core18 and pol455. Thus, while TCR stimulation by cognate antigen is a major driver of PD-1 expression, relative PD-1 expression patterns on HBV-specific CD8 T cells are not dictated by the current level of antigen alone.
We extended the phenotypic studies to additional markers, focusing on the two responses targeting core and polymerase that we could detect in all infection stages. This approach highlighted that differences between T cells targeting different HBV specificities were pervasive and not limited to PD-1 expression. We observed significant differences between core18 and pol455 responses for T cell differentiation, T cell function and T cell regulation in early and late acute, as well as chronic, infection. The relative PD-1 expression differences between core18 and pol455 were preserved throughout the different infection stages. Yet, the broader pattern of different T cell phenotypes and which individual molecules displayed the most pronounced expression differences between core18 and pol455 were distinct in different infection stages, suggesting an evolution of T cell phenotypes along distinct trajectories for each specificity. As a result, we see distinct ‘fingerprints’ of T cell populations characteristic for each combination of target antigen and infection stage. In this context, it should be noted that our population of chronic patients was rather heterogeneous, including patients with high and low viral loads, being on and off treatment and with different HBV antibody profiles. That we observed similar differences between core and polymerase responses further supports the robustness of the impact of target region on T cell phenotype; however, it would not be surprising if more detailed studies with larger patient numbers in the different chronic HBV infection scenarios would reveal additional complexity in T cell phenotypes.
Some of the observed phenotypes and phenotype differences were also rather peculiar, a key example being the pol455 and core18 responses in acute HBV infection. The pol455 cells expressed low levels of PD-1 and high levels of CD127 and had a significant proportion of terminally differentiated TEMRA memory cells, reminiscent of highly functional CMV-specific CD8 T cells.43 Yet, these populations also expressed higher levels of two other inhibitory receptors, CD160 and 2B4, and less of T-bet and the effector molecules perforin and granzyme B. Most important, they were less functional than core18 responses in direct ex vivo cytokine production assays analysing HBV multimer positive cells. This finding highlights that T cells cannot easily be classified into exhausted or memory T cells based on expression of a small number of markers, like PD-1 and CD127, but that comprehensive analysis including direct ex vivo functional assays is required for a meaningful characterisation of a T cell response.
What drives the different phenotypic and functional ‘fingerprints’ of HBV-specific CD8 T cells targeting different HBV antigens is not fully clear and requires additional studies. Our first hypothesis was that different phenotypes would be based on the presence of viral sequence variation and the associated diminished level of TCR stimulation, similar to what we and others have described in chronic HCV infection.33 41 Yet, we detected little sequence variation for the five epitopes in viruses isolated during acute infection, where differences in PD-1 expression and T cell phenotypes are already apparent. In chronic infection, where we did detect sequence variations compatible with viral escape, they were most common in the core epitope that is targeted by T cells expressing high levels of PD-1, the opposite of what is observed in T cells targeting escaped epitopes in HCV and HIV. Nevertheless, while not explaining the observed phenotypic differences, the sequencing data indicate that viral sequence variation and viral escape should be considered in HBV infection in more detail. Another potential explanation for the distinct phenotypic profiles could be that different HBV proteins are expressed at different levels during infection,44–46 which is different from HCV with its single translated polyprotein. Indeed, we show that HBsAg and HBeAg are produced in larger quantities in HepAD38 cells with active HBV replication, whereas the polymerase protein is expressed at much lower levels (online supplementary figure S8). Additional mechanisms, such as different TCR affinity or differences in antigen processing, are also possible contributors to the heterogeneity in phenotypes; however, our finding that most distinct HBV-specific responses targeting individual epitopes within one HBV protein share key phenotypic features, most notably PD-1 expression levels, points towards a key mechanism that is linked to the HBV target protein. Further experiments, for example, testing recognition of infected hepatocytes by HBV-specific T cells targeting different HBV proteins, will help clarify this question.
In sum, we find that HBV-specific T cells have distinct phenotypic and functional capacities that are influenced by their HBV target as well as the stage of infection. These findings have direct implications for the design of studies monitoring HBV-specific T cell responses since cross-sectional comparison of responses targeting different HBV proteins needs to be interpreted in the context of these intrinsic T cell differences to prevent biasing the results. The data also indicate the importance and feasibility of studies analysing HBV-specific CD8 T cells directly ex vivo, even in populations where this is challenging. Finally, the results raise the possibility that distinct HBV-specific T cell populations have distinct relevance for HBV control, and will respond differently to immunomodulatory therapies, most notably those based on PD-1 blockade. Whether this will impact the efficacy of such therapies, which are undergoing testing in chronic HBV infection, is difficult to predict; however, knowledge of the differences we observed will enable to test the impact of pretreatment phenotype on T cell recovery mediated by PD-1 pathway blockade directly in vivo.
Acknowledgments
We would like to acknowledge the patients and physicians involved in this study. The NIH tetramer facility for providing the HBV-specific multimers. The staff of the Mass General Hospital flowcytometry core facility: Maris Handley, Amy Galvin, Marianne Gesner, and Eric Surette for their advice and assistance. The members of the Ambulatório/ Laboratório de Hepatites Virais, Instituto Oswaldo Cruz/ FIOCRUZ, Rio de Janeiro, Brazil: Paulo Sérgio Fonseca de Sousa, Vinicius da Motta de Mello, Barbara Vieira Lago and Fransisco Campello do Amaral Mello.
References
Footnotes
PT and GML have a shared last authorship.
PT and GML contributed equally.
Contributors RCH designed and performed the experiments, analysed the data and wrote the paper. MPR and TS performed the experiments and analysed the data. JAC, DK and LH performed the experiments. JA, JGM, CAF, RCH, AB, AYK and LLLX contributed to design and recruitment of clinical cohorts and to data interpretation. JT and TFB analysed the data and advised on data interpretation. PT conceived, designed and performed the experiments, analysed the data and advised on data interpretation. GML conceived and supervised the study, analysed the data, provided funding and wrote the paper.
Funding This work was supported in parts by NIH U01 AI131314 (to GML, AYK and LLLX) and U19 AI082630 (to GML, RTC and AYK). RCH received a Ter Meulen Fonds Fellowship by the Dutch Royal Academy of Arts and Sciences.
Competing interests None declared.
Patient consent Not required.
Ethics approval Partners Human Research Committee; the Institutional Ethical Review Board of the Erasmus Medical Center; the Ethics Board of the Oswaldo Cruz Institute.
Provenance and peer review Not commissioned; externally peer reviewed.
Data sharing statement No additional unpublished data available.