Article Text

Abstract
Objectives To assess the variation in risk-adjusted 30-day postoperative mortality for patients with colorectal cancer between hospital trusts within the English NHS.
Design Retrospective cross-sectional population-based study of data extracted from the National Cancer Data Repository.
Setting All providers of major colorectal cancer surgery within the English NHS.
Participants All 160 920 individuals who underwent major resection for colorectal cancer diagnosed between 1998 and 2006 in the English NHS.
Main outcome measures National patterns of 30-day postoperative mortality were examined and logistic binary regression was used to study factors associated with death within 30 days of surgery. Funnel plots were used to show variation between trusts in risk-adjusted mortality.
Results Overall 30-day mortality was 6.7% but decreased over time from 6.8% in 1998 to 5.8% in 2006. The largest reduction in mortality was seen in 2005 and 2006. Postoperative mortality increased with age (15.0% (95% CI 14.1% to 15.9%) for those aged >80 years), comorbidity (24.2% (95% CI 22.0% to 26.5%) for those with a Charlson comorbidity score ≥3), stage of disease (9.9% (95% CI 9.3% to 10.6%) for patients with Dukes' D disease), socioeconomic deprivation (7.8% (95% CI 7.2% to 8.4%) for residents of the most deprived quintile) and operative urgency (14.9% (95% CI 14.2% to 15.7%) for patients undergoing emergency resection). Risk-adjusted control charts showed that one trust had consistently significantly better outcomes and three had significantly worse outcomes than the population mean.
Conclusions Significant variation in 30-day postoperative mortality following major colorectal cancer surgery existed between NHS hospitals in England throughout the period 1998–2006. Understanding the underlying causes of this variation between surgical providers will make it possible to identify and spread best practice, improve outcomes and, ultimately, reduce 30-day postoperative mortality following colorectal cancer surgery.
- Colorectal cancer
- surgical resection
Statistics from Altmetric.com
Significance of this study
What is already known about this subject?
There is increasing demand for the NHS to publish clinical outcomes such as postoperative mortality to inform patient choice and improve standards.
To be robust and informative such figures must take into account differences in the case-mix of patient populations, hospital surgical workloads and be population-based.
Such data have not previously been available.
What are the new findings?
This study has demonstrated a method by which it is possible to assess variation in the risk-adjusted 30-day postoperative mortality for patients with colorectal cancer across all hospital trusts within the English NHS.
The study has demonstrated significant variation in this outcome between hospital trusts.
How might it impact on clinical practice in the foreseeable future?
Understanding the underlying causes that have led to the significant variation in 30-day postoperative mortality rates between surgical providers will make it possible to identify and spread best practice, improve outcomes and, ultimately, reduce postoperative mortality following colorectal cancer surgery.
Introduction
Colorectal cancer is the third most common cancer in the UK and, with more than 35 000 new cases diagnosed annually,1 improving outcome is important. International comparisons show that survival from colorectal cancer in the UK is relatively poor.2–4
Surgery is the mainstay of colorectal cancer treatment and is generally undertaken within 6 months of diagnosis. International variation in survival is greatest in this period,3 suggesting that differences in the quality of care may explain some of the variation. A growing body of evidence also indicates variation in the type and quality of treatment delivered at a national level.5 6 Focusing on the best providers, understanding their successes and optimising the delivery of care in all hospital trusts should therefore significantly improve outcomes for colorectal cancer.
Institutional 30-day postoperative mortality has been suggested as one indicator of the effectiveness of multidisciplinary surgical care for colorectal tumours as it is clinically pertinent and readily understandable to the public. However, reliably identifying institutions with postoperative mortality that could be considered ‘outlying’ (ie, either significantly better or worse than average) is difficult for several reasons.7–9 First, unadjusted mortality estimates are difficult to interpret. Surgery inevitably carries a risk, but that risk will vary between individuals. A young patient with an early-stage tumour and no comorbid disease will bear a very different risk from that of an elderly frail patient with advanced disease. Robust comparison of postoperative mortality between providers requires analyses to be ‘risk-adjusted’ to ensure that the impact of relevant differences between populations (such as patient age, comorbidity and stage of disease) is taken into account. Second, the annual number of patients operated upon for colorectal cancer varies between institutions. Greater variability in postoperative mortality will arise by chance in institutions with smaller annual case loads compared with units managing larger numbers. Appropriate adjustment for differences in hospital case load is also vital if valid institutional comparisons are to be made.
National risk-adjusted outcome comparisons require national data but, until now, such data have not been available. Numerous routine data sources exist that contain information about different aspects of colorectal cancer care, but none contain all the data required to enable risk-adjusted comparisons of postoperative mortality. For example, cancer registry data10 contain detailed tumour incidence and outcome information but little data on treatment. In contrast, Hospital Episode Statistics (HES)11 contain detailed treatment information but little information on the characteristics of the tumours. The National Cancer Intelligence Network (NCIN) has linked these data sources to create the National Cancer Data Repository (NCDR).12 This resource allows the main processes and outcomes of care to be tracked for every NHS cancer patient in England.
The NCDR contains case-mix information of reasonable quality and good data on important prognostic factors such as stage, age and comorbidity. Not all the relevant data items are complete for each patient, however, and such missing information can restrict the interpretability of institutional comparisons. Techniques such as multiple imputation have the potential to overcome some of the problems that arise from missing data.13 14
This study seeks to make use of the available data within the NCDR to scrutinise risk-adjusted surgical outcomes for patients with colorectal cancer at a population level. It seeks to monitor national patterns and trends of 30-day postoperative mortality following major resection of colorectal cancer and, using multiple imputation13 14 and funnel plots,8 9 to produce robust comparisons of the performance of all NHS hospital trusts in England.
Methods
The NCDR consists of pooled data from the eight population-based cancer registries that cover England, linked (using all or combinations of the identifiers of NHS number, date of birth, postcode at diagnosis and sex) to an extract of HES including episodes of inpatient care for individuals who presented in any NHS hospital with a diagnostic code for cancer between April 1997 and June 2007.
Information was extracted from this resource on all individuals who underwent a major resection for a primary colorectal cancer diagnosed between 1 January 1998 and 31 December 2006. Information on age, sex, Dukes' stage, NHS number, postcode at diagnosis, dates of diagnosis and, where relevant, date of death, was extracted from the registry dataset for all colorectal cancers (ICD1015 C18–C20) while information about patient management was derived from HES. For each colorectal cancer patient in the registry extract who could be linked to the HES dataset, all inpatient episodes of care were searched to identify the date of the first major surgical resection for colorectal disease after diagnosis. Major colorectal resections were identified by OPCS4 codes16 17 for emergency excision of appendix (H01), excision of appendix (H02), panproctocolectomy (H04), total colectomy (H05), extended right hemicolectomy (H06), right hemicolectomy (H07), transverse colectomy (H08), left hemicolectomy (H09), sigmoid colectomy (H10), colectomy (H11), sub-total colectomy (H29), excision of rectum (H33) and total exenteration of pelvis (X14). Information about the hospital trust and the cancer network in which the patient was managed were derived from this episode of care. If a patient underwent two or more major colorectal resections during different episodes of treatment, the first operation was used. If a patient underwent two or more procedures during the same episode, the most radical or extensive procedure was used.
A Charlson comorbidity score was calculated for each individual based on the diagnostic codes (excluding cancer) recorded for any hospital admissions in the year prior to diagnosis of their colorectal tumour, excluding any admission spanning the period of diagnosis. The cancer component of the Charlson index was derived for each patient from the cancer registry information in the NCDR. The score for any cancers diagnosed in the year before diagnosis of the colorectal tumour was added to scores obtained from the HES data. Higher scores indicate greater comorbid disease. Patients were grouped into Charlson score categories of 0, 1, 2 and ≥3.
The urgency of surgery has been shown to have a strong influence on the risk of postoperative death,18 but this information is not recorded in HES. The method of admission is, however, available. Patients who were admitted as an emergency and underwent surgery within 2 days of admission were therefore deemed to have undergone emergency surgery while all others were considered elective.
Thirty-day postoperative mortality (the percentage of patients dead within 30 days of surgery) was calculated for each year of diagnosis, age group, sex, Dukes' stage of the primary tumour at diagnosis, quintile of the income domain of the Index of Multiple Deprivation (IMD) 2004 (derived from each patient's postcode of residence at diagnosis allocated into lower super output areas), Charlson score and cancer network and trust in which the initial colorectal resection occurred. The statistical significance of any differences in postoperative mortality was assessed using the χ2 test.
Of the 160 920 cases, Dukes' stage was missing in 24 434 (15.2%) because the information had not been captured by the cancer registry while the IMD income domain score could not be derived for 404 (0.25%) because of incomplete postcode information. Analysis restricted to patients with complete data would have allowed postoperative mortality to be assessed in 136 105 (84.6%) patients, preventing trust-level comparisons. Such estimates would also be at risk of bias with inflated standard errors. Missing data for Dukes' stage and IMD income category were imputed deterministically using the ‘ICE’19 command in Stata Version 11 with passive and substitute options and ordered logistic regression for five imputations and 10 cycles of regression switching. It was assumed that the data were ‘missing at random’ (MAR). Dukes' stage is MAR if, given fully observed variables, the chance of Dukes' stage being missing does not depend on the value of Dukes' stage. This assumption is made plausible because a wide range of variables were included in the imputation model, including all variables used in the analysis, all variables predictive of missing values and all variables influencing the process causing the missing data.13 The imputation model consisted of postoperative mortality within 30 days of surgery, age at diagnosis, sex, median annual workload of the trust, Dukes' stage, IMD income quintile, resection type (emergency or elective), admission type (emergency or elective), year of diagnosis, year of operation, Charlson comorbidity score, site of the initial primary, hospital trust and cancer registry. For comparative purposes the models used to investigate postoperative mortality were built using both the imputed dataset and a dataset restricted to cases with complete data.
Multilevel (random effects) binary logistic regression models were built to determine the factors associated with death within 30 days of surgery. The models were built with a hierarchy of patients clustered within hospital trusts (level 2), within cancer networks (level 3), so allowing for correlations between patient outcomes. The dependent variable—death within 30 days of surgery—was considered as a binary outcome. Covariates (explanatory variables) in the risk-adjusted model included age (per year increase), sex, site of the initial colorectal primary, IMD income quintile, year of diagnosis, Dukes' stage at diagnosis, Charlson comorbidity score and resection type (elective or emergency). Separate analyses were undertaken for patients diagnosed during 1998–2002 and 2003–2006.
Funnel plots were used to compare 30-day mortality rates between hospital trusts in each time period according to Speigelhalter's method.9 Trust-specific mortality ratios were calculated from each individual's probability of death within 30 days of surgery derived from the model based on the imputed dataset. Trust-specific risk-adjusted mortality rates were subsequently calculated by multiplying the trust-specific mortality ratios by the average national postoperative mortality rate (‘the target’ shown on the funnel plot as a horizontal line). Trust mortality rates were then plotted against the trust workload using the ‘funnelcompar’ command in Stata with 95% and 99.8% control limits (the inner and outer grey dashed lines respectively on the charts) around the target (the national 30-day postoperative rate represented as the horizontal grey line on the chart). Hospital trusts for which the 30-day postoperative mortality rate was >3 standard deviations from the national figure (ie, outside the 99.8% control limits) were considered to be outliers.
Results
One hundred and sixty thousand, nine hundred and twenty individuals were identified with a diagnosis of colorectal cancer between 1998 and 2006 and who subsequently underwent a major resection for their disease. They were treated by 150 different hospital teams within 28 cancer networks. Of these, 10 704 (6.7%) died within 30 days of the resection. The characteristics of the study population are presented in table 1. The distribution of stage before and after imputation and among the imputed cases was very similar (table 2).
Characteristics of the study population
Dukes' stage distribution by covariable category, and before and after imputation
Table 1 shows the characteristics of the population and their relationship to 30-day postoperative mortality. Owing to the high numbers of individuals included in the study, most of the differences across groups are statistically significant. Analyses undertaken on the imputed dataset and accounting for the clustering of patients with trusts showed that the 30-day postoperative mortality declined slightly from 6.9% (95% CI 6.3% to 7.5%) in 1998 to 5.9% (95% CI 5.4% to 6.4%) in 2006. Women were significantly less likely to die postoperatively than men (6.5% (95% CI 6.1% to 6.9%) vs 6.8% (95% CI 6.4% to 7.3%). Postoperative mortality was significantly associated with age: 1.2% (95% CI 1.0% to 1.4%) of patients aged <50 years died within 30 days of surgery compared with 15.0% (95% CI 14.1% to 15.9%) of those aged >80 years. Postoperative mortality was increased with more advanced tumour stage (4.2% (95% CI 3.7% to 4.7%) for Dukes' A tumours vs 9.9% (95% CI 9.3% to 10.6%) for Dukes' D tumours), greater socioeconomic deprivation (5.7% (95% CI 5.3% to 6.1%) in the most affluent category vs 7.8% (95% CI 7.2% to 8.4%) in the most deprived) and greater comorbidity (5.4% (95% CI 5.0% to 5.7%) for Charlson score 0 vs 24.2% (95% CI 22.0% to 26.5%) for score ≥3). Patients with colonic tumours had higher postoperative mortality than those with rectal tumours (7.7% (95% CI 7.3% to 8.2%) vs 4.6% (95% CI 4.3% to 5.0%)). Operative urgency was also important: 14.9% (95% CI 14.2% to 15.7%) of patients operated as an emergency died within 30 days of surgery compared with only 5.8% (95% CI 5.4% to 6.2%) of those operated upon electively.
The results of multivariable analyses examining the adjusted odds of death within 30 days of surgery are shown in table 3. The odds of death were significantly higher for each successive year of age (OR 1.08 for each year increase in age, 95% CI 1.08 to 1.08, p<0.001), Dukes' stage (OR 2.50, 95% CI 2.24 to 2.78 for Dukes' D vs Dukes' A, p<0.001), deprivation (OR 1.32, 95% CI 1.23 to 1.42 for the most deprived vs the most affluent, p<0.001), comorbidity (OR 4.38, 95% CI 3.98 to 4.82 for Charlson comorbidity score ≥3 vs 0, p<0.001) and those operated upon as an emergency (OR 2.67, 95% CI 2.53 to 2.82, p<0.001). The odds of death were lower in women than men (OR 0.83, 95% CI 0.79 to 0.86) and lower for patients with rectal tumours than for those with colonic tumours (OR 0.94, 95% 0.89 to 0.99).
Multivariable analyses showing the odds of death within 30 days of surgery
The odds of death within 30 days of surgery for the various case-mix factors are shown in table 4. A strong deprivation effect was apparent even after adjustment for the case-mix factors thought to differ between socioeconomic groups such as stage, comorbidity and emergency presentation.
Results of the additive logistic regression models (based on the imputed dataset) investigating the odds of death within 30 days of surgery
For patients diagnosed during 1998–2002, unadjusted 30-day postoperative mortality was above the 99.8% control limit for eight trusts (figure 1A), indicating that their surgical mortality was significantly higher than expected. A further 20 trusts were above the 95% control limit. After inclusion of all risk factors in the model (figure 1B), eight trusts remained above the upper 99.8% limit while 15 trusts were above the 95% control limit. In the unadjusted model six trusts had significantly lower 30-day postoperative mortality than expected (ie, they were below the lowest 99.8% control limit) and 19 more trusts were below the 95% control limit. In the risk-adjusted model, five and 17 trusts respectively remained below the lower 99.8% and 95% control limits.
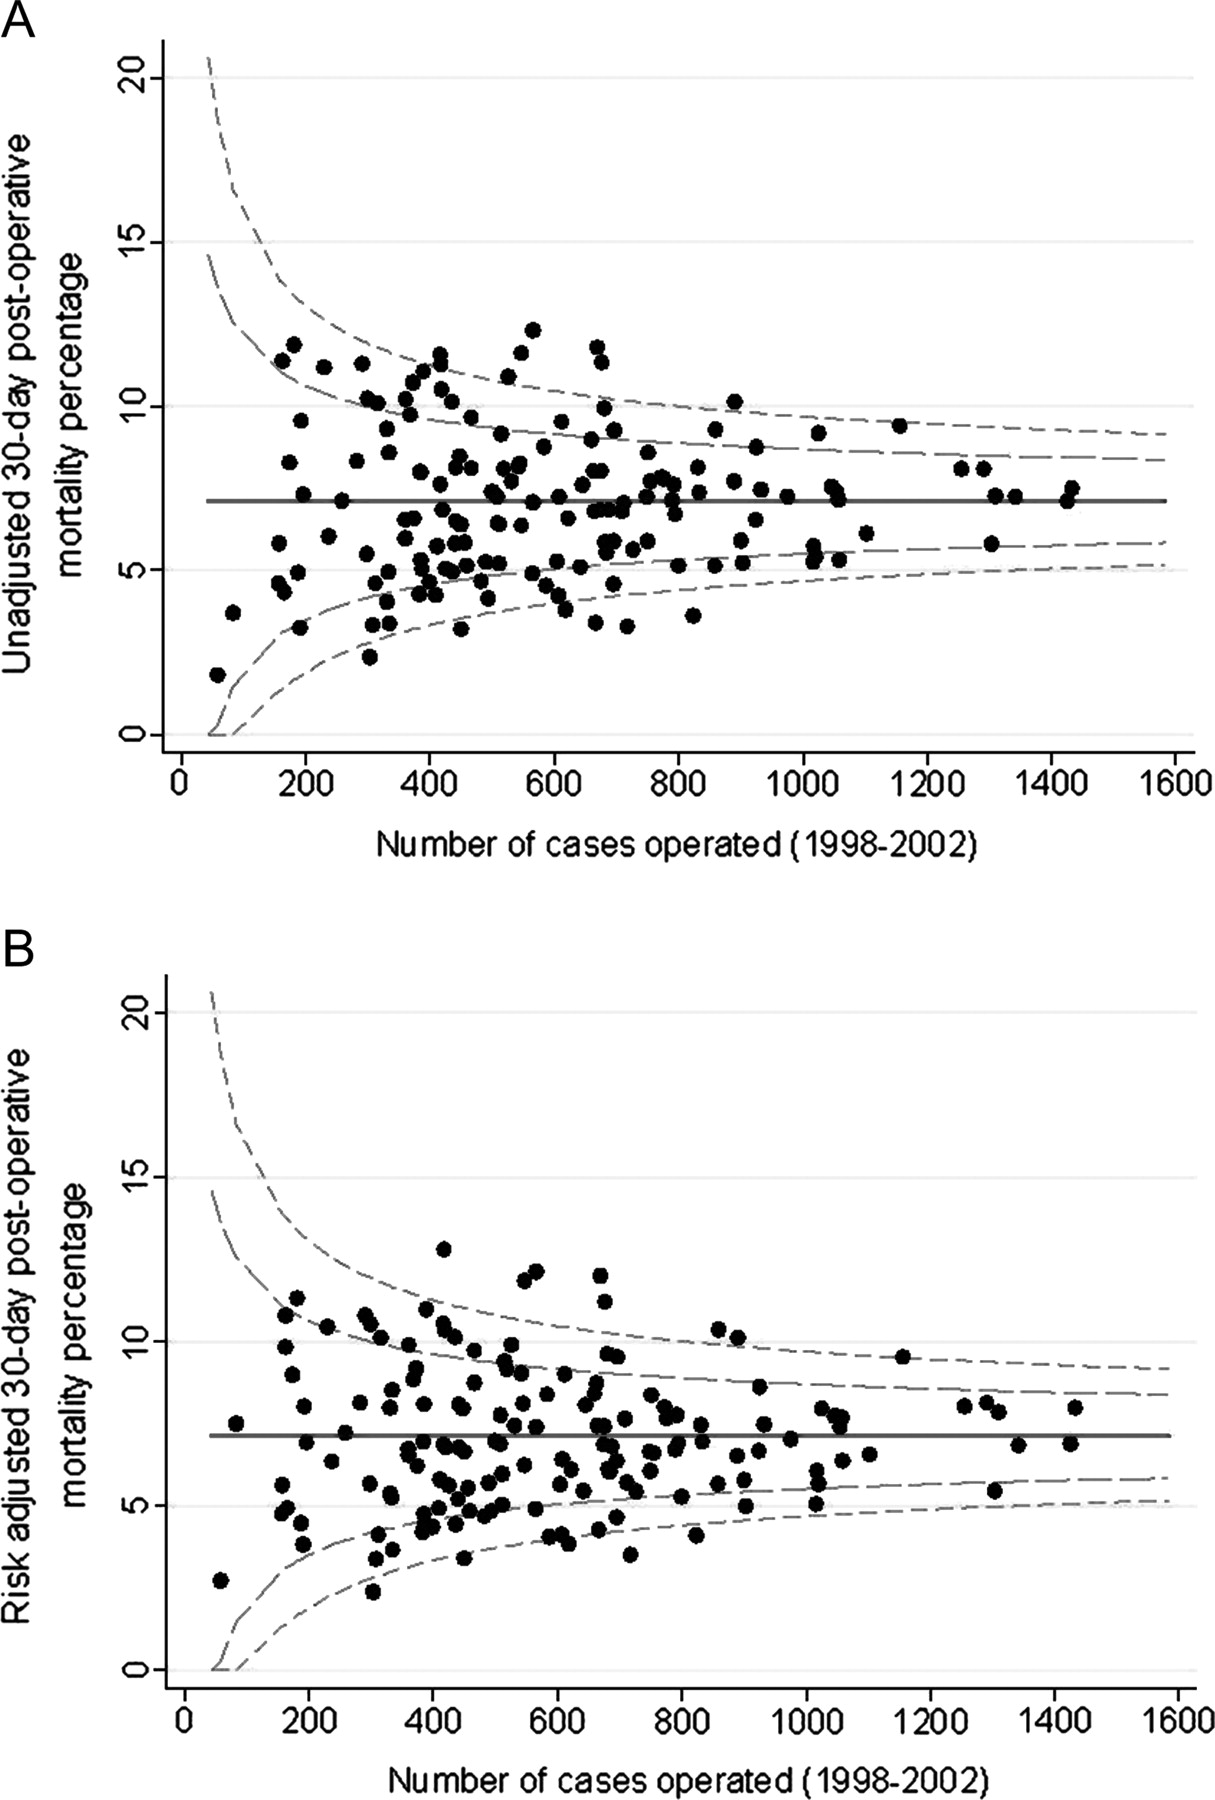
(A) Unadjusted 30-day mortality and (B) risk-adjusted 30-day mortality (%) (adjusted for sex, age, year of diagnosis, cancer site, deprivation, Dukes' stage, Charlson comorbidity score and resection type) by NHS trust for patients with colorectal cancer who underwent a major resection: England, patients diagnosed 1998–2002.
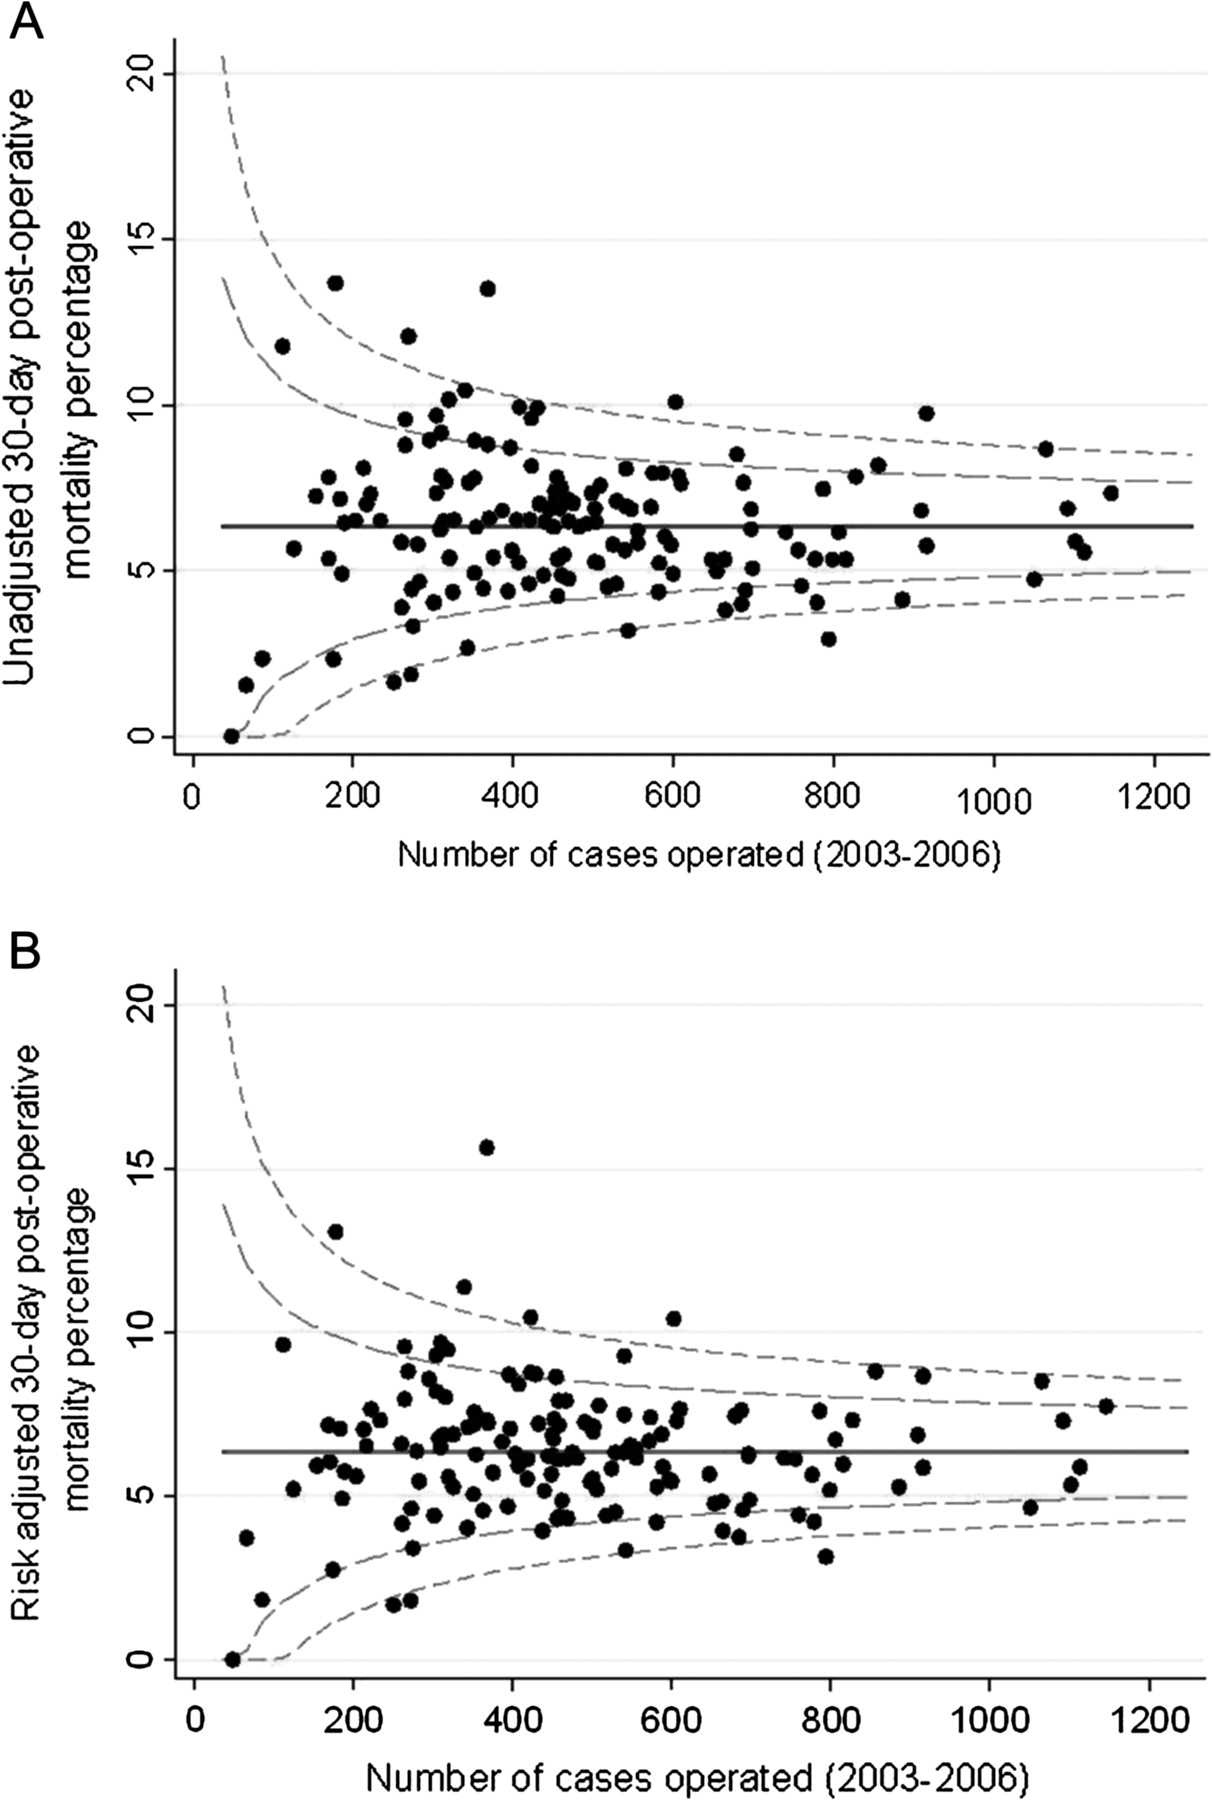
Similar results were observed for patients diagnosed during 2003–2006 (figure 2). In the risk-adjusted model, postoperative mortality in five trusts was above the upper 99.8% control limit while a further 11 were above the 95% limit. Three trusts had significantly better outcomes than expected, below the 99.8% limit, and nine trusts were below the 95% limit.
(A) Unadjusted 30-day mortality (%) and (B) risk-adjusted 30-day mortality (%) (adjusted for sex, age, year of diagnosis, cancer site, deprivation, Dukes' state, Charlson comorbidity score and resection type) by NHS trust for patients with colorectal cancer who underwent a major resection: England, patients diagnosed 2003–2006.
Three trusts appeared above (and one trust below) the 99.8% control limits in both time periods indicating consistently outlying 30-day postoperative mortality.
Discussion
This retrospective population-based study is the first to provide a comprehensive national perspective on the 30-day postoperative mortality associated with colorectal cancer surgery across England. Overall, 6.7% of the study population died within 30 days of surgery amounting to 10 704 deaths. There was significant variation across the population with postoperative mortality greater in the elderly, men, the socioeconomically deprived, those with advanced stage disease at diagnosis or with additional comorbidities and among those operated upon as an emergency. Significant variation, independent of case-mix, was also observed between hospital trusts. One trust had postoperative mortality significantly lower and three significantly higher than could be explained by the case-mix information available in both time periods examined. These hospitals were all district general hospitals and two of those with significantly worse outcomes than expected had Foundation status.
The postoperative mortality of 6.7% seen in this study is notably higher than that previously reported for the UK. Data submitted to the most recent National Bowel Cancer Audit Programme (NBOCAP) report recorded postoperative mortality of 4.7% for all surgical cases.5 Submission to this audit is, however, voluntary, resulting in incomplete case ascertainment. In addition, it is not possible to calculate postoperative mortality across all surgically resected cases submitted due to incomplete or inaccurate reporting of dates of surgery and (prior to 2009) death. In consequence, it is likely that, due to under-reporting, the results from the NBOCAP audits are biased.
The postoperative mortality of English patients with colorectal cancer determined in this study is also significantly higher than that reported from other countries. Thirty-day postoperative mortality from population-based studies in Scandinavia, Canada and the USA ranged from 2.7% (for rectal cancers alone) to 5.7%.20–25 While there are undoubtedly big differences between the populations in these international studies that make comparison with the UK difficult, the postoperative mortality from these reports is consistently below the 6.7% found in this study. This suggests that either the NHS may have fundamentally worse postoperative outcomes than some other comparable health services or the operative risk of patients differs between countries. Understanding and minimising these differences could significantly reduce the number of premature deaths caused by this disease across the country.
A strong relationship between socioeconomic deprivation and postoperative mortality was observed, with those residing in more deprived areas having a significantly greater risk of death within 30 days of surgery than those residing in more affluent areas. This effect remained despite adjustment for stage of disease, comorbidity and urgency of surgical resection. This finding mirrors other studies that have shown socioeconomic gradients in both the long-term and short-term outcomes of colorectal cancer.22 26 27 In contrast, there is evidence to suggest that this gradient disappears in a randomised trial setting where patients are given equal treatment,28 although it is possible that this may be partially explained by participants of randomised trials having a better prognosis than those not participating in a randomised trial. Further evidence is therefore required before it is possible to determine whether inequalities in care may account for some of the socioeconomic disparities observed in 30-day postoperative mortality. However, understanding the causes of the gradient and minimising it has the potential to significantly improve outcomes from colorectal cancer.
A limitation of this study is that it is based on routine health data in the form of linked routine cancer registry and HES and the quality and accuracy of coding within these resources has been questioned.29 A recent study, however, identified colorectal cancer patients enrolled in a randomised trial within the NCDR and found excellent agreement in the information recorded in both datasets with regard to both treatment and outcomes.30 This demonstrated that the data within the NCDR were sufficient to monitor 30-day postoperative mortality across the country.
Another potential limitation of the study is that the case-mix adjustment was inadequate owing to the routine nature of the data upon which it was based. The NCDR does not contain detailed information about every aspect of a patient or their care that could influence the risk of postoperative death and, in consequence, it is possible that some unmeasured prognostic factor is confounding our results. These analyses do, however, include adjustment for many of the most important factors known to influence outcome such as age, comorbidity, stage of disease and socioeconomic deprivation and, as such, the results should not be dismissed. Previous studies have shown that routine data can be used to identify divergent practice,31 32 and the linked data upon which this study is based are much more comprehensive than any previously available. Furthermore, it is hoped that the NBOCAP data will soon be incorporated into the NCDR. These data contain information such as anaesthetic risk scores that are not currently available in the NCDR but that could significantly influence postoperative outcomes. The availability of such data could help to refine the models further in the future.
Currently, the NCDR is limited by the timeliness of the routine data available. Efforts are being made across the NHS to increase the timeliness of data it collects and it is a priority for the NCIN to improve the temporality of the NCDR. In the future it is therefore hoped that more timely reporting can be achieved.
Many factors may influence 30-day postoperative mortality. These may relate to the patient (eg, stage of disease or level of comorbidity) or the institution offering care (such as the specialisation of the operating team, the quality of postoperative care or the availability of beds in high dependency and intensive care units). Examining how these factors vary in relation to 30-day postoperative mortality rates may provide evidence to help explain the variability seen across English NHS trusts, among socioeconomic groups and between countries. While this study has identified providers with outlying 30-day postoperative mortality, it is not possible to determine from the data available what aspects of care—or, indeed, if the quality of care within these units—is deficient. The outlying status could be explained by problems in data quality, chance or, as discussed previously, case-mix factors not quantified in this study. Institutions with outlying status should not, however, be ignored, but efforts should be made to determine why they appear to have significantly better or worse postoperative mortality than other units. With this information it should then be possible to learn from those achieving good outcomes by seeking the underlying causes, adding to and spreading the adoption of best practice guidelines,33–36 improving poor outcomes and, ultimately, reducing postoperative mortality following colorectal cancer surgery.
Cardiothoracic surgeons in the UK have openly reported their surgical outcomes since 1998, and the publication of these results has demonstrably improved outcomes for cardiothoracic surgical mortality across the country.37 38 It is intended that the development of the NCDR will enable national 30-day postoperative mortality to be reported annually at both a trust level and—as the NCDR also contains information about the consultant overseeing each surgical event—potentially the surgeon level (although it should be emphasised that postoperative mortality should be treated as a colorectal team or trust event and the operating surgeon should not be vilified). The NCIN plans to work collaboratively with the Association of Coloproctology of Great Britain and Ireland to disseminate these findings to hospital trusts and cancer networks and use them to inform care. The reduction in 30-day postoperative mortality over the study period is welcomed, but our findings show that there is wide variation across the NHS and considerable scope for improvement. It is now time for colorectal cancer—and subsequently other cancer teams—to follow the example of cardiothoracic surgeons in order to improve outcomes. The NCDR provides the means by which this process can start.
Acknowledgments
This paper is a contribution from the National Cancer Intelligence Network (http://www.ncin.org.uk/) and the English registries (http://www.ukacr.org.uk). It is based on the information collected and quality assured by the regional cancer registries in England, specifically the Eastern Cancer Registration and Information Centre (Jem Rashbass), the Northern and Yorkshire Cancer Registry and Information Service (John Wilkinson and Brian Ferguson), the North West Cancer Intelligence Service (Tony Moran), the Oxford Cancer Intelligence Unit (Monica Roche), the South West Cancer Intelligence Service (Julia Verne), the Thames Cancer Registry (Henrik Moller), the Trent Cancer Registry (David Meechan) and the West Midlands Cancer Intelligence Unit (Gill Lawrence).
References
Footnotes
Funding EJAM was supported by the Cancer Research UK Bobby Moore Fund, BR was funded by Cancer Research UK and PQ by Yorkshire Cancer Research.
Competing interests None.
Ethics approval This study was conducted with the approval of the Fife, Forth Valley and Tayside research ethics service (reference number 08/S0501/66).
Provenance and peer review Not commissioned; externally peer reviewed.