Article Text

Abstract
Background Variability in endoscopic assessment necessitates rigorous investigation of descriptors for scoring severity of ulcerative colitis (UC).
Objective To evaluate variation in the overall endoscopic assessment of severity, the intra- and interindividual variation of descriptive terms and to create an Ulcerative Colitis Endoscopic Index of Severity which could be validated.
Design A two-phase study used a library of 670 video sigmoidoscopies from patients with Mayo Clinic scores 0–11, supplemented by 10 videos from five people without UC and five hospitalised patients with acute severe UC. In phase 1, each of 10 investigators viewed 16/24 videos to assess agreement on the Baron score with a central reader and agreed definitions of 10 endoscopic descriptors. In phase 2, each of 30 different investigators rated 25/60 different videos for the descriptors and assessed overall severity on a 0–100 visual analogue scale. κ Statistics tested inter- and intraobserver variability for each descriptor. A general linear mixed regression model based on logit link and β distribution of variance was used to predict overall endoscopic severity from descriptors.
Results There was 76% agreement for ‘severe’, but 27% agreement for ‘normal’ appearances between phase I investigators and the central reader. In phase 2, weighted κ values ranged from 0.34 to 0.65 and 0.30 to 0.45 within and between observers for the 10 descriptors. The final model incorporated vascular pattern, (normal/patchy/complete obliteration) bleeding (none/mucosal/luminal mild/luminal moderate or severe), erosions and ulcers (none/erosions/superficial/deep), each with precise definitions, which explained 90% of the variance (pR2, Akaike Information Criterion) in the overall assessment of endoscopic severity, predictions varying from 4 to 93 on a 100-point scale (from normal to worst endoscopic severity).
Conclusion The Ulcerative Colitis Endoscopic Index of Severity accurately predicts overall assessment of endoscopic severity of UC. Validity and responsiveness need further testing before it can be applied as an outcome measure in clinical trials or clinical practice.
- Ulcerative colitis
- endoscopy
- disease severity
- activity index
- instrument development
- inflammatory bowel disease
- Crohn's disease
- infliximab
- 5-aminosalicylic acid (5-ASA)
- clinical trials
- TNF-alpha
- IBD
- 6-mercaptopurine
- probiotics
- prebiotic
- intestinal bacteria
- chronic IBD
- antibody targeted therapy
- IBD clinical
- chronic ulcerative colitis
- cell migration
- cellular immunity
This is an open-access article distributed under the terms of the Creative Commons Attribution Non-commercial License, which permits use, distribution, and reproduction in any medium, provided the original work is properly cited, the use is non commercial and is otherwise in compliance with the license. See: http://creativecommons.org/licenses/by-nc/2.0/ and http://creativecommons.org/licenses/by-nc/2.0/legalcode.
Statistics from Altmetric.com
- Ulcerative colitis
- endoscopy
- disease severity
- activity index
- instrument development
- inflammatory bowel disease
- Crohn's disease
- infliximab
- 5-aminosalicylic acid (5-ASA)
- clinical trials
- TNF-alpha
- IBD
- 6-mercaptopurine
- probiotics
- prebiotic
- intestinal bacteria
- chronic IBD
- antibody targeted therapy
- IBD clinical
- chronic ulcerative colitis
- cell migration
- cellular immunity
Significance of this study
What is already known about this subject?
There is wide variation in the endoscopic assessment of the severity of ulcerative colitis.
There is no validated instrument.
What are the new findings?
An index—the Ulcerative Colitis Endoscopic Index of Severity—with three descriptors (vascular pattern, bleeding and ulceration) has been developed that captures 90% of the variance of the overall assessment of endoscopic severity.
The three descriptors are each graded in three or four levels with precise definitions.
Friability is excluded from the endoscopic description of severity.
How might this impact on clinical practice?
Once independently validated, the Ulcerative Colitis Endoscopic Index of Severity will be available for clinical trials, training and practice.
Introduction
Endoscopy plays a pivotal role in the evaluation of ulcerative colitis (UC). At least nine different scoring systems are used as outcome measures in clinical trials, and endoscopy has an important role in most.1 2 Indices are typically composite measures that include assessment of symptom severity, quality of life, laboratory tests and endoscopic findings. However, the contribution of endoscopy is index-specific. In the widely used Mayo Clinic index,2 endoscopy is one of four criteria and just one of two criteria (in addition to rectal bleeding) currently used by the Food and Drug Administration for defining remission. Consequently, interobserver variation in assessing endoscopic activity is important, because disagreement can alter the proportion of patients defined as in remission and influence regulatory decisions.
The original endoscopic grading of UC (Baron index, 1964) was developed before index methodology was defined.3 It has been used, nevertheless, in most trials of active UC to this day, with only minor and unvalidated modification.2 Data supporting the index are scant. It was created by scoring seven endoscopic descriptors in 60 patients, by three observers using rigid sigmoidoscopes. The κ statistic, a measure of interobserver agreement, was not calculated and there was 40% disagreement when grading normal, mild, moderate or severe activity. Efforts have since been made to standardise endoscopic assessment3 by using the presence of mucosal friability to discriminate between mild (Baron level 1) and moderately active (Baron level 2) disease.4–6
Variation between observers in categorising endoscopic disease activity is widely suspected,1 2 7–10 so the need for this to be quantified appears self-evident. The aims of this study were first to substantiate variation in endoscopic assessment of activity in UC, then to evaluate intra- and interindividual variation of descriptive terms and, finally, to create an Ulcerative Colitis Endoscopic Index of Severity (UCEIS) which could be validated.
Methods
The study included two phases. Phase 1 mapped inconsistencies in endoscopic assessment and defined the most dependable descriptive terms (‘descriptors’). Phase 2 quantified inter- and intraobserver variation in these descriptors, in order to construct an index (UCEIS) that could be validated. For consistency in the text, the word ‘index’ refers to an instrument for assessing activity; ‘descriptor’ refers to an item within that index with severity allocated on a Likert scale; and ‘level’ is used to refer to the severity graded for an item. ‘Score’ is the overall measure provided by an index. Common usage has often confused these terms, but they are used as consistently as possible in this paper.
Phase 1
Ten specialists in inflammatory bowel disease (IBD, the authors) graded videos of flexible sigmoidoscopy according to their own practice, in the absence of clinical information. Twenty-four representative videos were selected to represent the widest range of UC activity, guided by the Mayo Clinic score (by PK and BRY) from a library of 670 videos recorded in a standard manner during clinical trials for the treatment of moderately active UC6 (EUDRACT 2006-001310-32). Within each Mayo Clinic score stratum, consecutive videos were reviewed by one of the co-authors for image quality. Satisfactory quality recordings (sharp image, sufficient bowel preparation) were selected. Videos from fibreoptic endoscopes were discarded. Sixteen videos represented the complete range of severity; 24 videos enabled choice from additional videos in the mid-range of severity, most likely to be affected by interobserver variation. Each investigator was randomly assigned 16 of the 24 videos in randomised order using a set of Latin squares: a core set of eight videos that all investigators evaluated (two for each Baron score) and eight of 16 non-core videos, This kept the number of evaluations by each investigator in the 2–3 h session to a manageable number (16), while still having a common core set (8) and a broad overall pool of videos (24). Investigators were explicitly advised not to apply the Baron index themselves, to avoid biasing their overall assessment of severity in relation to this index. To assess potential scoring differences based on the length of the video,11 each investigator had two pairs that were shortened from 10–15 min to approximately 5 min, giving a total of 18 videos for each investigator to view. Descriptors of endoscopic severity were selected from previous studies.3 8 9 12 13 Investigators recorded the presence or absence of 11 descriptors. Overall severity was assessed on a visual analogue scale (VAS, between 0=completely normal and 100=worst ever seen).
To substantiate variability in endoscopic assessment, the level of the Baron index derived from the assessments by investigators was compared with the level assigned by the central reader in the original trial.7 The precise wording of definitions and video clips illustrating anchor points on three-, four- or five-point Likert scales of severity for each descriptor, were subsequently agreed by consensus during a video teleconference between investigators (table 1).
Descriptors and definitions
Phase 2
Fifty core videos were assembled, 40 from the library of 670 videos (by PK and BRY, representing Mayo Clinic levels (scores) 0–11, different from those selected for phase 1), representing six expected severity strata (note selection criteria for phase 1). A further five from individuals without UC and five from patients hospitalised with severe UC who had consented to their anonymised images being used for study (Oxford LREC 536407Q1605/58ORH), represented two additional strata at the expected extremes of endoscopic severity. The five patients admitted with biologically severe UC represented the most severe end of the spectrum of UC, although only 2/5 came for colectomy (one within 6 h of flexible sigmoidoscopy). To evaluate the Contact Friability Test (CFT), 10 different videos representing Mayo Clinic levels 1–11, two for each stratum, were amended to exclude CFT sequences and paired with the complete video showing the CFT.
Each of 30 new investigators from 13 countries, including 19 from the USA and Canada (see ‘Acknowledgements’) scored 25 videos selected from the 60 recordings, but blinded to clinical information or Mayo Clinic score. Endoscopists were recruited to reflect a range of geographical and institutional characteristics, from investigators with endoscopic training in trials of IBD or known to the authors as having an interest in endoscopy or IBD (840 median colonoscopies and flexible sigmoidoscopies/year (range 100–2100), median 25 years' endoscopy experience, range 8–35). Each investigator was randomly allocated a CDROM containing 15/40 core videos from the library (comprising two to three videos selected from each of the six Mayo Clinic levels), two out of five normal videos from people without UC and two out of five videos from patients with severe UC, together with two out of 10 CFT+/− pairs (table 2). To evaluate intraobserver consistency, each investigator also scored two of their 13 core videos representing Mayo Clinic levels 1–11 twice, in random order. Investigators were asked to score each video using every descriptor in table 1 and to assign an overall assessment of severity using an electronic 0–100 VAS.
Distribution and allocation of videos to investigators
Videos were assigned to investigators using an incomplete block design, stratified by expected severity stratum. This randomisation process meant that each video was scored by 10–12 investigators, except for the four videos in Mayo Clinic level 0 stratum, which were each viewed by 15 investigators. Owing to an assignment error, 5/30 investigators were assigned only one and not two normal videos. The order of endoscopy evaluation was randomised using a set of Latin squares. Duplicate videos were randomly interspersed in the video set, but positioned so that they were separated by at least eight other videos; videos comprising a CFT+/− pair were separated by at least four other videos and the viewing order balanced. The order of descriptors was randomised between investigators using Latin squares so that each descriptor appeared first (second, third, etc) an equivalent number of times across investigators, although the order was constant for each investigator. Video clips illustrating each descriptor and anchor points on the Likert scale were provided and data (descriptors on four- or five-point Likert scales, with overall assessment of severity by VAS) were collected electronically using a programmed PalmPilot. The range of endoscopic severity was graphically checked by plotting the mean severity level evaluated by VAS as a function of its rank order.
Statistics
Intraobserver variation was assessed by κ statistics14 calculated from the two pairs of duplicate videos. Interobserver variation was stratified by investigator pairs for the common videos they scored, but excluding the second scoring of duplicate and CFT videos, and incomplete data (<5%). An average of investigator-pair κ values (‘overall κ’) was calculated, where the weighting was the inverse of their variance. Two κ values were calculated: the standard κ summarising the exact level of agreement and a weighted κ taking into account partial credit for disagreement, by assigning a weight of 1 for agreeing levels, 0.5 for levels in adjacent categories on the Likert scale except for the two lowest levels and 0 for any other level. Qualitative interpretation of κ statistics used the convention of Landis and Koch.15
Relationships between descriptors and overall severity (VAS) were explored using generalised linear mixed model (GLM) regression. GLM regression used the β distribution for variance and the logit link.16 The logit link function constrains real parameters to a value between 0 and 1. Descriptors were included as categorical variables, so that the contribution of each level for each descriptor could be explored separately and up to three-way interactions between descriptors assessed. The investigator was included as a random effect. The suitability of models was assessed by plotting least-squares means, examining residual plots and the Akaike Information Criterion (AIC).17 Described roughly, the AIC is the log likelihood penalised by the number of parameters, a large negative value indicating a good fit in a parsimonious model. An R2 statistic, denoted pR2, was the squared correlation between the logit-transformed overall severity evaluations on VAS and linear function of predictors from the model. p Values for tests of specific terms (eg, interactions) were determined from asymptotic F tests. The strategy for optimising the number of response levels was to start with the full number of levels for each item and use the regression modelling (specifically AIC and patterns of mean responses) to identify opportunities to eliminate or combine levels while still maintaining a strong correspondence to the overall score (VAS). All statistical analyses were conducted using SAS V.9.2.
Results
Phase 1
Severity ratings by the 10 IBD specialists showed substantial variation when compared with each other (data not shown), while Baron scores derived from their findings did not match those assigned by a central reader (figure 1). There was 76% agreement for ‘severe’ activity, but only 27% agreement for a normal appearance and 37% for moderate severity among the videos selected.6 Ten descriptors (table 1) and full-length recordings were selected for phase 2. The descriptor discarded after phase 1 was that which attempted to describe the transition from abnormal to normal mucosa, on the basis that it defied definition. Short-length videos were excluded, because of variation in scoring from full-length videos (data not shown) and the risk of editing out information from the original.

Distribution of levels of Baron score among specialists in the phase 1 panel as a function of the level assigned by the central reader. Ten authors of this paper scored the severity of ulcerative colitis according to their standard practice in 16 videos selected randomly from a total of 24. A level (rating) of the Baron score was then assigned, based on their assessment of friability and this was compared with the level assigned by a central reader. (0= normal; 1=minor; 2=moderate; 3=severe endoscopic severity). n, total number of ratings by phase 1 panel; s, number of video sigmoidoscopies.
Phase 2
Seven hundred and fifty evaluations were performed on 60 videos by 30 investigators (response rate 100% for overall assessment of severity by VAS and ≥96.5% for all descriptors). Mean overall assessments of endoscopic severity scores ranged from a VAS of 0.67 (video in the normal stratum) to 96.4 (most severe stratum), suggesting that the 60 videos encompassed the range of endoscopic severity seen in clinical practice (figure 2).

Mean assessment of overall severity as a function of its rank among all mean evaluations of severity, based on 750 evaluations performed by 30 investigators on 25 out of 60 videos. Mean overall severity on a visual analogue scale ranged from 0.67 (video in the normal stratum) to 96.4 (in the most severe stratum) across 25 out of 60 videos scored by 30 investigators, indicating that the videos selected provided an appropriate range of endoscopic severity.
Intraobserver and interobserver agreement
Sixty repeat pair assessments (two pairs per investigator) of 36 separate videos were assessed for intraobserver variability (table 3). Weighted intrainvestigator κ statistics ranged from 0.34 for contact friability to 0.65 for erosions and ulcers. Six hundred and thirty assessments of 60 videos (21 per investigator, excluding duplicates and CFT-) assessed interobserver variability. Interinvestigator κ statistic ranged from 0.30 for contact friability to 0.45 for erosions and ulcers (table 4). It is notable that CFT, designed to reduce variation, showed the lowest level of agreement.
Intra-investigator variation results
Interinvestigator variation results
Overall assessment of severity
The mean (95% CI) overall assessment of severity according to the 100-point VAS for each descriptor and each level of the Likert scale derived from the GLM model are shown in figure 3. Some descriptors (eg, vascular pattern) appear to provide discrimination for lower levels of severity, with others (eg, bleeding) discriminating at higher levels of severity.
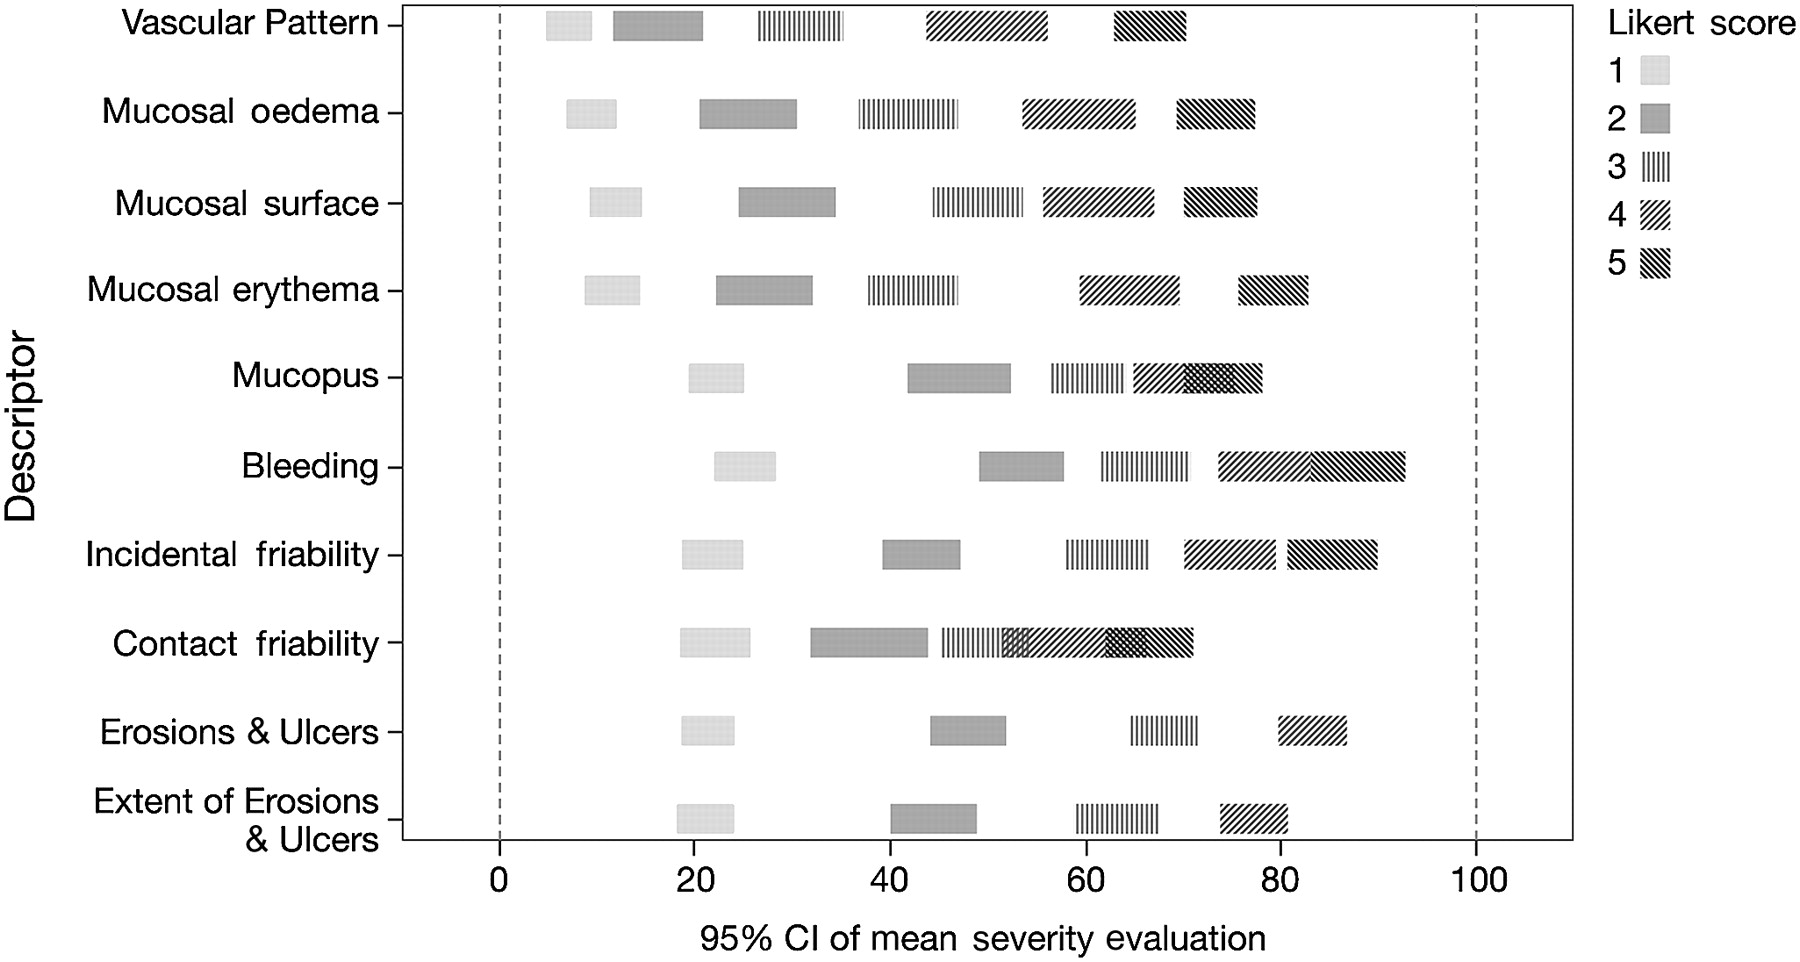
Predicted mean overall assessment of severity for each level of each descriptor. Assessment of overall severity using a 100 point visual analogue scale for each level on the Likert scale of severity for each descriptor (table 1). Predictors are based on generalised linear mixed modelling, using logit link, β distribution for variance, investigator as a random effect and descriptors one by one as categorical variables.
Regression modelling to develop an index
GLM model regression was based on a total of 609 assessments of 60 separate videos, excluding second assessments of repeat video pairs; videos with CFT and assessments from an investigator with a large amount of missing data were extracted. The best regression models using one, two and three descriptors are detailed in table 5 (1, 2 and 3), clearly showing an increasing fit with the number of descriptors (lower AIC and higher pR2). Analysis of the plots of least-squares means indicated that some levels of incidental friability and bleeding could be combined, leading to improvement in AIC values. The best model had four levels for erosions and ulcers and incidental friability, in combination with five levels for vascular pattern, although the model with four levels for erosions and ulcers and bleeding and five levels for vascular pattern had a similar pR2 (table 5, 3 (simplified I)). However, reducing the vascular pattern to three levels only resulted in a slight loss of fit, with a slightly lower AIC, but similar pR2 (table 5, 3 (simplified II)). The simplicity of this model and easier definition of three levels of vascular pattern resulted in the selection of this model.
Generalised linear mixed models with one, two and three descriptors
Model selected to create the index
The selected model consists of three descriptors: erosions and ulcers, bleeding and vascular pattern (table 6). Predicted mean severity levels (and 95% CI) for different combinations of Likert scale levels of the three descriptors are shown in table 7. Relationships between actual mean overall assessments of severity (VAS) and means predicted by the model are shown in figure 4. When individual assessments were compared with predicted values, the pR2 was 0.78. Since the model assigned a level of overall severity to combinations of responses, there is no single coefficient per descriptor.
UCEIS descriptors and definitions
Predicted mean severity index and potential UCEIS grade according to different combinations of Likert scale levels of each of the three descriptors

Predicted mean assessment of severity compared with reported mean assessment of severity. To construct the index after excluding the second assessment of repeat video pairs and the videos with a Contact Friability Test (CFT), each of the 30 investigators evaluated 21 independent videos, leading to 630 evaluations. Each video was scored by 10–12 investigators, except for Mayo Clinic score 0 videos, which were scored by 15 investigators (making up the 630). Twenty-one evaluations with missing data were excluded from the index construction (making 609 evaluations overall). Thus, for each video, evaluations by 10–15 investigators were available, allowing the mean of the evaluations of overall severity to be calculated, as well as the mean of the severity evaluations predicted from the generalised linear mixed model using the three descriptors—vascular pattern, bleeding and erosions and ulcers—according to the levels of these predictors reported by each investigator. VAS, visual analogue scale.
Discussion
This study has determined that just three descriptors (vascular pattern, bleeding, erosions and ulcers) are sufficient to create a model accounting for the full range of endoscopic severity associated with UC. The UCEIS accurately predicts overall endoscopic severity judged by a VAS, although this needs to be validated by new investigators.
Phase 1 of the study evaluated variability in endoscopic interpretation among specialists in IBD and established definitions of descriptive terms. Phase 2 defined inter- and intraobserver variation, to construct a model to compare with an overall assessment of endoscopic severity. There was widespread variability among specialists in the assessment of endoscopic severity. Disagreement in phase 1 was greatest for videos categorised as ‘normal’ or ‘moderate’, with only 27% agreement for normal appearance and 37% for moderate severity, and at best 76% agreement for ‘severe’ activity.
Phase 2 involved 30 investigators from Europe, USA and Canada. The sample size was large: for intraobserver variation, 60 repeat pairs of 36 videos were used. For interobserver variation, there were 630 assessments of 60 videos. Assessment design was robust: videos were stratified by clinical severity, allowing for greater variability in the mid-range of severity unknown to investigators, then randomly assigned with a random order for scoring descriptors. Reproducibility of scoring within and between investigators was modest, as expected. Interobserver variation is not synonymous with ‘agreement’, since the latter is not corrected for chance agreement and correction depends on response distribution. It is possible (perhaps even probable) that the variation was due to sampling error, although this could not be quantified, nor allowed for without a substantial increase in sample size. The order of descriptors was randomised to avoid bias, but this may have increased variation between observers, so the descriptor order will be constant in subsequent validations. κ Values may appear poor, but the level of agreement is typical for clinical evaluation processes. For example, evaluating microscopic disease activity in UC reported a κ statistic of 0.20–0.42, improving to 0.59–0.70 with a pictorial scale.18
A notable finding was that contact friability was too variable to be further considered. The test, where closed biopsy forceps were pushed against the mucosa to determine whether bleeding occurred, was an construct designed to standardise assessment of mucosal friability in the ASCEND 3 clinical trial,6 similar to brushing the mucosa with a cotton wool pledget.3 ‘Incidental friability’, bleeding from the mucosa seen during withdrawal of the flexible endoscope, was more reproducible. The concept of mucosal friability, however, is poorly understood and always needs explanation. It evaluates mucosal fragility, assumed to be a feature of inflammation before ulceration, where bleeding occurs after minor pressure on the mucosa.
The index (UCEIS) was developed from different combinations of descriptors predicting the overall assessment of severity judged by the investigator using a VAS. Regression techniques established the simplest combination of descriptors most accurately predicting the overall level of severity. Individual descriptors were included as categorical variables, so that each score for each descriptor could be explored separately, including interactions between descriptors. One- and two-descriptor models captured 55–75% of the variability in the overall evaluation (table 5). However, several three-descriptor models captured 90–91% of variability, which is a high level of predictability for overall severity assessment. All three-descriptor models included erosions and ulcers. Plots of least-squares means showed that levels on the Likert scale for two of the descriptors (incidental friability and bleeding) could be compressed (from five to four levels) without loss of predictability. Compression of the Likert scale for vascular pattern (to three levels) resulted in some loss of fit, but a pragmatic definition of a fourth level of vascular pattern was impracticable, so this was accepted. This left two leading three-descriptor models, including incidental friability, or bleeding. The latter captured 90% of the variability (pR2=0.90) and the former 91% (pR2=0.91), so the choice could not be made on statistical grounds alone. The panel reconvened and decided to include bleeding on the basis of clinical relevance and simplicity.
The terms vascular pattern and bleeding are of course included in the Baron index. Where the UCEIS differs is to define different levels for each of three descriptors, to exclude friability and to apply precise definitions. In theory there are 48 (4×4×3) possible response combinations to the three items. The final index can only assign a value to a fraction of combinations, since some will not be seen in practice and others will be combined after statistical analysis. Validation of potential grades is in progress, but remission might be defined as level 1 for all three descriptors (allowing blurring or loss of capillary margins with a recognisable vascular pattern, no visible bleeding and no erosions or ulceration). On the other hand, ‘severe disease’ might be defined as a level of at least 3 for vascular pattern and bleeding, with 2 for erosions and ulcers. Such an approach is likely to bring consistency to endoscopic evaluation of severity, but it is premature to define thresholds.
The ‘gold standard’ for assessing disease activity in UC should be a diagnostic test that can accurately predict future disease outcome, to augment clinical evaluation. Endoscopy is a surrogate end point and it needs to be established that the UCEIS correlates with, and predicts, clinical outcome. Future studies should test (head to head) whether this instrument can predict clinical outcome better than clinical assessment (without endoscopy) or biomarkers (eg, faecal calprotectin or lactoferrin). The burden of proof has to be on endoscopy, as an expensive and invasive test, to prove that it is better than non-invasive and less expensive alternatives.
A new index for disease activity in ulcerative colitis (the UCEIS) has been created. It illustrates that there is wide variation in the endoscopic interpretation of disease severity between observers. Just three descriptors can be combined to account for 90% of the overall assessment of endoscopic severity judged by a VAS. The UCEIS is undergoing independent validation with different videos and investigators, evaluating operating properties of the index (responsiveness and reliability). Minimal differences for this instrument remain to be evaluated, for its role in research, training and practice.
Acknowledgments
We sadly acknowledge the untimely death of Marc Lémann, one of the co-authors of this study who made unparalleled contributions to this and to so many other areas of gastroenterology. Biostatistical advice was both independent and conducted by the sponsors of the study (Procter and Gamble Pharmaceuticals, later Warner Chilcott), although it was established from the outset that the index would be freely available subject to copyright, but not to patent. We are particularly grateful to the investigators who evaluated video endoscopies in phase 2, from Austria (Walter Reinisch, Vienna); Belarus (Yury Marakhouski); Canada (Robert Bailey, Edmonton; Marc Bradette and Gilles Jobin, Quebec; Naoki Chiba, Guelph, Flavio Habal, Toronto; John Marshall, Hamilton); Croatia (Davor Stimac, Rijeka); Estonia (Riina Salupere, Tartu); Hungary (György Székely, Budapest); Italy (Silvio Danese, Milan); Latvia (Juris Pokrotnieks, Riga); Poland (Jaroslaw Regula, Warsaw); Romania (Mircea Manuc, Bucharest); Russia (Olga Alexeeva, Nizhegorodskiy); Serbia (Njegica Jojic, Belgrade) and the USA (Nelson Ferreira, Hagerstown, MD; Fred Fowler, Harrisbrurg, NC; Daniel Geenen, Milwaukee, WI; Norman Gilinsky, Cincinatti, OH; Howard Gus, Ocean, NJ; Asher Kornbluth, New York, NY; Mark Lamet, Hollywood, FL; Jacque Noel, Lafayette, LA; Michael Safdi, Cincinnati, OH; Jerrold Schwartz, Arlington Heights, IL; Guarang Shah, Jacksonville, FL; Larry Weprin, Dayton, OH; Estephan Zayat, Wichita, OH). We would also like to acknowledge Barry Rodgers-Gray for assistance with the figures, Mr Scott Hayes (Procter and Gamble), who provided the data acquisition and data management support for the study and Professor Bryan Warren, Oxford, who originally suggested using the endoscopic videos from a randomised controlled trial in this way.
References
Supplementary materials
Supplementary Data
This web only file has been produced by the BMJ Publishing Group from an electronic file supplied by the author(s) and has not been edited for content.
Files in this Data Supplement:
- Download Supplementary Data (PDF) - Manuscript file of format pdf
- Download Supplementary Data (PDF) - Manuscript file of format pdf
- Download Supplementary Data (PDF) - Manuscript file of format pdf
- Download Supplementary Data (PDF) - Manuscript file of format pdf
- Download Supplementary Data (PDF) - Manuscript file of format pdf
Footnotes
ICMJE disclosures have been submitted.
Funding Procter and Gamble, later Warner Chilcott. Sponsors paid for video image preparation, managerial support, statistical programming and for the time spent by independent gastroenterologists to evaluate the UCEIS. All authors gave freely of their time and have received no remuneration for the development of this index.
Competing interests None.
Ethics approval Ethics approval was provided by ASCEND: EUDRACT 2006-001310-32 and Oxford LREC 536407Q1605/58ORH.
Provenance and peer review Not commissioned; externally peer reviewed.
Data sharing statement Supplementary files and original data are available on request.