Article Text

Abstract
Background and aims Irritable bowel syndrome (IBS) is a common functional gastrointestinal disorder that may be triggered by enteric pathogens and has also been linked to alterations in the microbiota and the host immune response. The authors performed a detailed analysis of the faecal microbiota in IBS and control subjects and correlated the findings with key clinical and physiological parameters.
Design The authors used pyrosequencing to determine faecal microbiota composition in 37 IBS patients (mean age 37 years; 26 female subjects; 15 diarrhoea-predominant IBS, 10 constipation-predominant IBS and 12 alternating-type IBS) and 20 age- and gender-matched controls. Gastrointestinal and psychological symptom severity and quality of life were evaluated with validated questionnaires and colonic transit time and rectal sensitivity were measured.
Results Associations detected between microbiota composition and clinical or physiological phenotypes included microbial signatures associated with colonic transit and levels of clinically significant depression in the disease. Clustering by microbiota composition revealed subgroups of IBS patients, one of which (n=15) showed normal-like microbiota composition compared with healthy controls. The other IBS samples (n=22) were defined by large microbiota-wide changes characterised by an increase of Firmicutes-associated taxa and a depletion of Bacteroidetes-related taxa.
Conclusions Detailed microbiota analysis of a well-characterised cohort of IBS patients identified several clear associations with clinical data and a distinct subset of IBS patients with alterations in their microbiota that did not correspond to IBS subtypes, as defined by the Rome II criteria.
- Irritable bowel syndrome
- 16S ribosomal RNA
- sequence analysis
- human microbiome
- inflammatory bowel syndrome
- functional bowel disorder
- lamina proprial lymphocytes
- IBD
- inflammatory bowel disorders
- IBD models
- mucosa-associated lymphoid tissue
- mucosal immunology
- constipation
- gastroparesis
- intestinal transplantation
- gastric emptying
- quality of life
- motility disorders
- visceral sensitivity
- gastrointestinal motility
- functional dyspepsia
Statistics from Altmetric.com
- Irritable bowel syndrome
- 16S ribosomal RNA
- sequence analysis
- human microbiome
- inflammatory bowel syndrome
- functional bowel disorder
- lamina proprial lymphocytes
- IBD
- inflammatory bowel disorders
- IBD models
- mucosa-associated lymphoid tissue
- mucosal immunology
- constipation
- gastroparesis
- intestinal transplantation
- gastric emptying
- quality of life
- motility disorders
- visceral sensitivity
- gastrointestinal motility
- functional dyspepsia
Significance of this study
What is already known on this subject?
Irritable bowel syndrome (IBS) onset may follow enteric infections.
A low-grade inflammatory response has been described in IBS.
Various changes in the microbiota have been described in IBS but their primacy has not been defined.
What are the new findings?
A detailed assessment of the faecal microbiota in IBS does not reveal a uniform change in the microbiota.
Analysis of microbial populations in IBS reveals distinct clusters, of which some overlap with normal controls while others are quite different.
An increased Firmicutes:Bacteroidetes ratio best characterises those IBS subjects who differ from normal populations.
The microbial signature is related to the clinical phenotype in a subset of IBS patients.
How might it impact on clinical practice in the foreseeable future?
Microbial fingerprinting may help to identify IBS subpopulations with differing prognosis and varied therapeutic responses.
Introduction
Irritable bowel syndrome (IBS) is a common gastrointestinal (GI) disorder that affects 10–20% of adults in industrialised countries.1 Although it has a non-fatal prognosis, IBS patients report more ailments than the general population and commonly incur a diminution in quality of life.1 Characteristic symptoms include abdominal pain and/or discomfort, bloating, distension and altered bowel habits.1
No single unifying cause has been identified for IBS, but there is recent evidence suggesting the involvement of the gut microbiota. The clearest evidence is provided by subjects who develop IBS de novo following an episode of enteric infection—postinfectious IBS. Postinfectious IBS has been associated with a number of bacterial species.2–4 This and the hypothesis that small intestinal bacterial overgrowth might also contribute to IBS symptomatology5 have motivated investigation of antibiotics as therapeutic agents in IBS.6 Large double-blind studies of some antibiotics have shown an improvement (albeit modest, though statistically significant) in IBS symptoms. The improvement has been attributed to a reduction in total bacterial load and, perhaps, an associated suppression of certain causative bacterial species.6 7
The gut microbiota of IBS subjects has thus attracted considerable interest, and alterations in microbiota composition have been linked to IBS and IBS-related symptoms. To cope with the heterogeneity in IBS symptoms,8 these studies often employ the Rome criteria to identify IBS subtypes (reviewed by Salonen et al).9 Their meta-analysis of IBS microbiota, as determined by high-throughput methods, identified consistent microbiota alterations associated with fluctuations in Firmicutes-associated taxa; alterations in the proportions of the Bacteroidetes and Proteobacteria phyla also featured in several studies.10–15 However, in studies to date, the phenotypic characterisation of the subjects has often been suboptimal. For example, links to symptom pattern and severity have not been clearly established. Moreover, it is currently unclear if the gut microbiota alterations found were characteristic of IBS patients in general or only to subgroups thereof.
The aim of this study was, therefore, to identify differences in the intestinal microbiota between healthy and IBS subjects in a very well phenotyped cohort. Using faeces as a proxy for the distal bowel, we sought to identify phylum, genus and species level bacterial signatures of IBS. We further aimed to identify operational taxonomic units (OTUs) associated with IBS and their relationship to clinical patterns and physiological measures.
Methods
Recruitment of subjects
IBS patients fulfilling Rome II criteria16 were recruited from the Gastroenterology Clinic, Sahlgrenska University Hospital, Gothenburg, Sweden. The samples were collected between January and December 2004 to cover a complete calendar year and eliminate seasonal effects. All patients underwent appropriate diagnostic tests to rule out organic GI disorders as described in the online supplementary methods. Patients with other GI conditions explaining their symptoms, or with another severe coexisting disease, were excluded. Of the 37 patients, 27 were on no medication during the study; 3 were on a proton pump inhibitor, 2 used spasmolytics, 4 bulking agents, 4 selective serotonin reuptake inhibitors, 2 low dose tricyclics and 2 loperamide. We also recruited a group of healthy volunteers without previous or current GI symptoms or history of a chronic disease. These subjects were recruited through local advertisement and completed a GI symptom questionnaire to ensure the absence of current GI symptoms. Antibiotic treatment within the month before stool collection was an exclusion criterion. Subjects were not controlled for probiotic, prebiotic or synbiotic use. The study was approved by the Regional Ethical Review Board at the University of Gothenburg.
Patients who enrolled in the study completed the following questionnaires to assess their GI and psychological symptoms, as well as general quality of life (see online supplementary methods): the Hospital Anxiety and Depression (HAD) Scale17; Gastrointestinal Symptom Rating Scale-IBS18; Bristol Stool Form Scale—1 week diary to assess stool form19; and the Short Form-36 (SF-36).20 Some subjects (n=36) also underwent a rectal sensitivity test with a rectal barostat21 and colonic transit time measurement using radiopaque markers (n=28)22 (see online supplementary methods).
Statistical and clustering analysis
We sequenced approximately 30 000 16S rRNA gene V4 region amplicons per subject (see online supplementary methods), and determined the corresponding microbiota composition using established bioinformatics processes.23 In brief, quality filtering was applied using the Qiime settings of no ambiguous bases, a mean quality score above 25, a mean window quality score above 25, a maximum homopolymer run not exceeding a limit of six and no mismatches in the primer. Similar sequences were clustered at a 97% sequence identity into OTUs, which can be treated as sequence-based bacterial divisions. The reads were assigned to taxonomies using the Ribosomal Database Project (RDP) classifier.24 A confidence value of 0.5 was considered a positive identification. At each phylogenetic classification level, the overall data from each subject was normalised by scaling to an intensity of 1 in order to control for differing numbers of reads. To visualise the data, we employed principal coordinates analyses (PCoAs) based upon the Unifrac distances25; the UniFrac measurement indicates the extent to which microbial communities share branch length, based on a phylogenetic tree of all the amplicon sequences in the combined dataset. Secondary clustering analysis was carried out on the OTU abundances by adding 0.000001 to remove zeros followed by dual scaling a log transformed OTU dataset to limits of −3,3 and using unsupervised hierarchical cluster analysis with the Pearson correlation coefficient and average linkage. All sequence reads are deposited at MG-RAST (Project ID: 152).
Subsequent feature selection was carried out using the Kruskal–Wallis test. For phylum, class, order and family taxonomic levels, correction for multiple testing was applied using Holm's method.26 For the species and genus level analysis, the less stringent method of Benjamini and Hochberg was used.27 This method controls the false discovery rate and so is a less stringent condition than the control of the family-wise error rate. When applying statistics, a cut-off of 20% occupancy of a taxa was used to remove rare or poorly measured species. This means that a variable was removed from testing if it contained 46 or more zeros. Testing of rates of depression across the IBS groups was carried out using the Kruskal–Wallis test and confirmed in a pairwise manner using the asymptotic Wilcoxon–Mann–Whitney rank sum test.
Assigning species and Clostridium clusters
To confidently assign amplicon sequences to species level and Clostridium clusters, we extracted 72 928 V4 sequences from the 123 332 full-length 16S rRNA genes with complete species classifications (RDP release 10.23) using the same primer pair locations as were used for the amplification. In brief, an association table with species-specific cut-off BLAST scores was designed from an all-against-all BLAST search of the extracted V4 sequences. If the same-species score for a certain species was higher than the score of the first hit against a different species, then that species was considered assignable. The relaxed cut-off threshold was then set as the recorded score of the first hit against a different species, plus one. As this is less than the last true positive, it introduces a small degree of ambiguity. This was deemed necessary to maximise the number of species that could potentially be identified, especially in situations where a species had only one known V4 sequence. This methodology was applied at the level of OTU where the representative sequences were used to assign OTUs to species. In this way, a total of 32% of reads were classified to 168 species. To test each of these species, the associated OTUs were combined to generate a 168 * 57 dataset. A stricter cut-off score was also calculated as the score of the last same-species hit just prior to the first hit against a different species. The Clostridium clusters thresholds were defined in a similar way using combined all-against-all BLAST results from a list of species that were classified to Clostridium clusters according to the literature.
Results
Descriptive analysis
Fifty-seven subjects were enrolled: 37 IBS (mean age 37±12 years (mean±SD); 26 female subjects) and 20 non-IBS control subjects (mean age 39±9 years; 13 female subjects). Based on Rome II criteria,8 12 of these subjects had alternating-type IBS, 15 diarrhoea-predominant IBS and 10 constipation-predominant IBS. Data from questionnaires and physiological tests are summarised in online supplementary table 1. Time since first symptoms was >5 years in 35 of the 37 IBS patients and over a year in the remaining two. Using established HAD cut-off values for clinically significant (≥11) anxiety or depression, 11 and 8 patients had clinically significant anxiety and depression, respectively (30% and 22%). Thirty-two (86%) patients had SF-36 scores below 50 on the mental and/or physical component scores, indicating reduced quality of life. Based on normal values,21 22 11/36 patients had rectal hypersensitivity, whereas colonic transit was rapid in 8, slow in 3 and normal in 17 patients.
Identification of IBS subtypes by cluster analysis
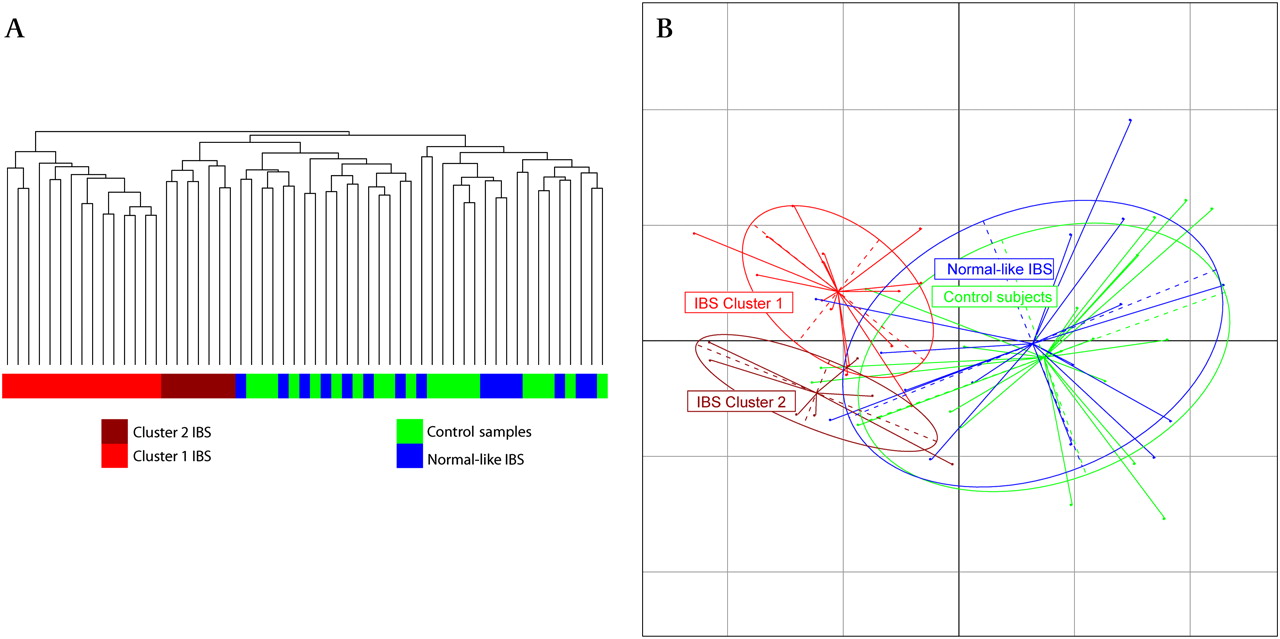
Hierarchical clustering based on the Pearson correlation coefficient was applied to the OTU tables. This identified a readily discernible split for a subsection of the IBS subjects, with two clusters representing 22 of the 37 IBS microbiota datasets, separating from the control samples (figure 1A). These clusters were not associated with medication, body mass index (BMI), total read numbers or Rome II categories (p value >0.05). Weighted Unifrac principal coordinates analysis (PCoA) revealed that these two clusters were clearly separated from each other and the control samples and the remaining normal-like IBS samples (figure 1B).

Clustering analysis of irritable bowel syndrome (IBS) and control samples. (A) Hierarchical trees based on scaled log transformed operational taxonomic unit data. (B) Principal coordinates analysis of weighted Unifrac distances showing the controls (green), high Firmicutes:Bacteroidetes (FB) ratio IBS (red) and normal FB ratio IBS (blue).
Analysis of α diversity (ie, diversity within a single microbiota) showed the IBS subjects, as a whole, to have average microbiota diversity lower than healthy controls (figure 2A). However, when the analysis was applied in a group-wise manner (figure 2B), the normal-like IBS showed similar diversity levels as the controls and the two IBS clusters showed different levels of diversity. Cluster 1 showed a diminished diversity, while cluster 2 had increased diversity when compared with the control samples. This difference in diversity could also be seen in the number of species that could be confidently assigned, with a median of 44 in cluster 1 compared with 53 in cluster 2. Differing depths of sequencing can be excluded as a reason for this observation since the average total read numbers were higher in cluster 1 than cluster 2, although this was not significant.

Faith's phylogenetic diversity curves. α Diversity curves showing total branch length with SDs for each group, for each number of sequences generated through rarefaction for (A) control and irritable bowel syndrome (IBS) samples and (B) control and IBS subgroups.
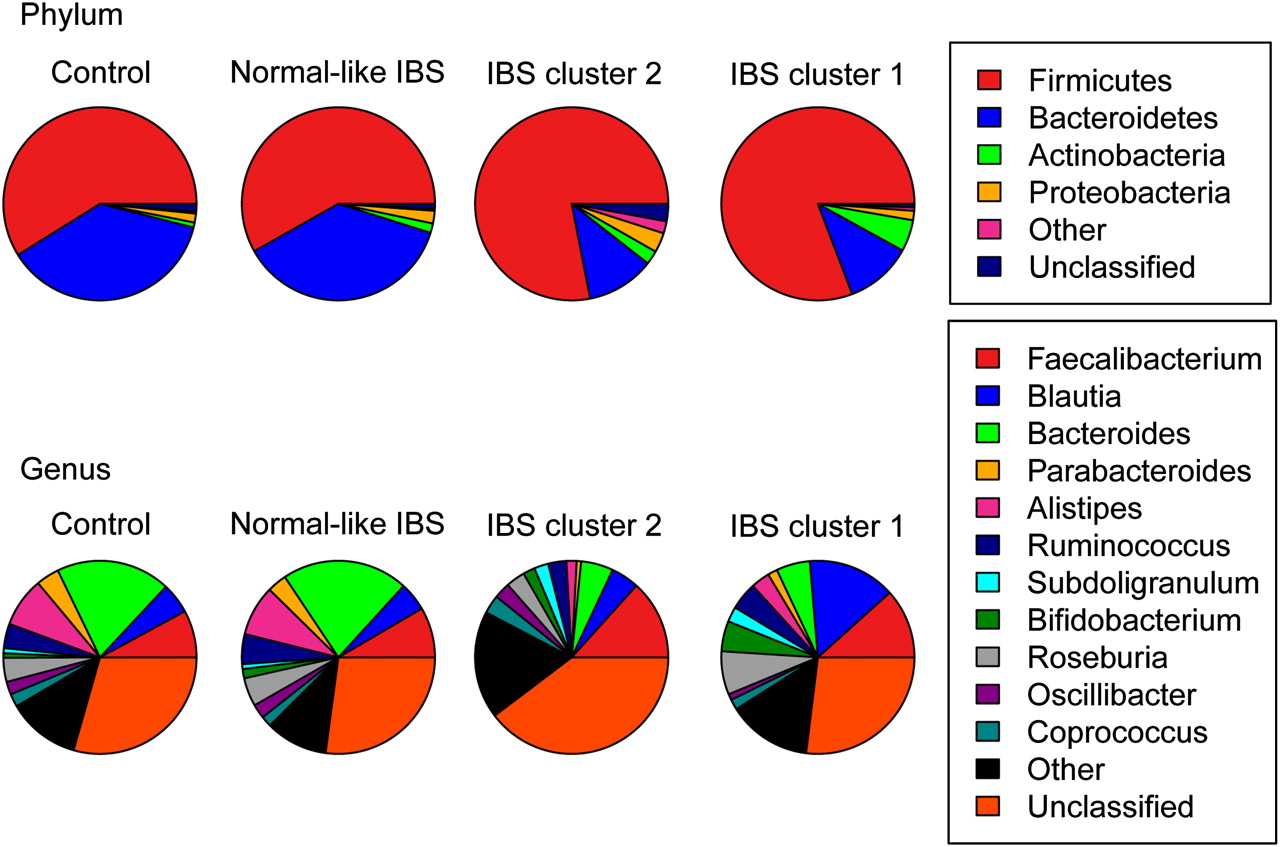
The separation of cluster 1 from cluster 2 was independent of the separation from the control samples along the first axis (figure 1B) but was significantly different from each other based on permutational multivariate analysis of variance (PMANOVA) with both weighted and unweighted Unifrac distances. We again applied the PMANOVA on the Unifrac distances and tested the two IBS clusters, the remaining IBS and the control samples against each other. The IBS clusters were significantly different from the remaining normal-like IBS samples, the control samples and each other (unweighted Unifrac: p<0.005, weighted Unifrac p<0.005). To further investigate clustering of subjects by their microbiota composition, the phylum and genus level datasets were visualised using pie charts (figure 3) and bar charts (online supplementary figure 1). The most striking feature was the change in the Firmicutes:Bacteroidetes (FB) ratio between the groups at the phylum level and the similarity of the normal-like IBS microbiota to the control samples, even at the genus level (figure 3, online supplementary figure 1). Hereinafter, the two IBS clusters will be collectively referred to as the high FB ratio IBS and the remaining IBS as normal-like IBS.

Visualisation of taxonomic levels. Pie charts showing proportion of reads in each phylum (top) and genus (bottom) for the controls, normal-like irritable bowel syndrome (IBS) and the IBS clusters.
Statistical analysis of the taxonomic level datasets
Multigroup analysis of the defined groups identified a number of taxa that were present at significantly different relative proportions between the high FB ratio IBS clusters, the normal-like IBS and the controls. These differences can be described as being between the high FB ratio IBS clusters and the controls, as the normal-like IBS showed similar proportions of these taxa to the controls with only slight differences. Taxa increased in the high FB ratio clusters were significantly enriched for Firmicutes-associated taxa (table 1 and online supplementary table_2). Bacteroidetes-associated taxa were decreased when compared with the control subjects' microbiota (table 2 and online supplementary table_2). The exception to this trend was Sporobacter which had highest abundance in IBS cluster 2 but was depleted in cluster 1. The most abundant Bacteroidetes-associated genera were depleted in both clusters (Bacteroides (p<0.0001) and Alistipes (p=0.001)).
Increased abundance taxa associated with high Firmicutes:Bacteroidetes (FB) ratio irritable bowel syndrome (IBS)
Increased abundance taxa associated with control samples
Phylum level analysis showed an increase in Actinobacteria (p<0.0001). Bifidobacteriaceae (p<0.001) was associated with a median of 95% of the reads in the phylum Actinobacteria. This compared with Actinomycetaceae (p<0.001) and Coriobacteriaceae (p<0.01) which were associated with less than 1% and 3% of reads, respectively. Further investigation of the Bifidobacterium result found that 95% of the associated reads mapped to one OTU that was present in all control and 36 of the 37 IBS samples. Performing a BLAST search using the 207 base pair representative sequence against the RDP database provided a 100% hit to Bifidobacterium adolescentis.
One genus that shows differential abundance in the data presented in figure 3 is Faecalibacterium. Faecalibacterium prausnitzii abundance was also investigated using targeted quantitative real-time PCR (online supplementary notes), in addition to the pyrosequencing analysis. In both datasets, there was a small increase in the abundance of this bacterium in the IBS samples but significance testing showed that this increase was well within the range of values expected, based on the high level of variance associated with the bacterium prevalence. Interestingly, the IBS sample variance was twice the variance in the control samples.
A total of 163 species were confidently identified as discussed in the Methods section. Of these, 11 species were associated with the separation of the high FB ratio IBS clusters from the healthy controls (table 3).
Species associated with high Firmicutes:Bacteroidetes (FB) ratio irritable bowel syndrome (IBS) versus control split
Statistical analysis of the combined abundances of species that belong to the Clostridium clusters identified Clostridium cluster XIVa as being significantly differently abundant across the groups, specifically characterised with an increased abundance in IBS cluster 1 (p<0.0005).
OTU signatures for IBS subtypes
Statistical analysis identified 111 OTUs that were significantly differentially abundant across the four groups (online supplementary table_3). Phylogenetic assignments assigned the vast majority of the OTUs that had higher abundances in the high FB ratio clusters to Firmicutes-associated taxa. Bacteroidetes-associated taxa were associated with OTUs that were more abundant in the control samples.
Correlation of differential microbiota composition with clinical data in IBS
Associations between the clinical data and composition of the microbiota were tested with the Kendall rank correlation coefficient within all IBS subjects and separately for the high FB IBS subjects, and for each of the subgroups. The significant correlations are reported in table 4. In total, eight clinical variables showed associations across 21 taxa over the four groups of subjects tested. Two phylum level associations that were returned as significant involved multiple clinical characteristics in the analyses. An increased abundance of Cyanobacteria was associated with satiety, bloating and an increased total gastrointestinal symptom rating scale-IBS (GSCR-IBS) score. Proteobacteria abundance was associated with an increased mental component and an increased pain threshold.
Associations between clinical characteristics of irritable bowel syndrome (IBS) and taxa
Another 17 taxa were associated with prolonged colonic transit times. These taxa can be summarised to two species and three families that were associated with a prolongation of colonic transit time and constipation. The order Actinomycetales and the family Actinomycetaceae were inversely associated with clinically significant depression indicating that people with IBS without clinically significant depression carry a greater load of this bacterium. Interestingly, the normal subjects carry significantly less of this bacterium than the non-depressed IBS (p value: 0.0017).
Clinical variables and IBS subtypes
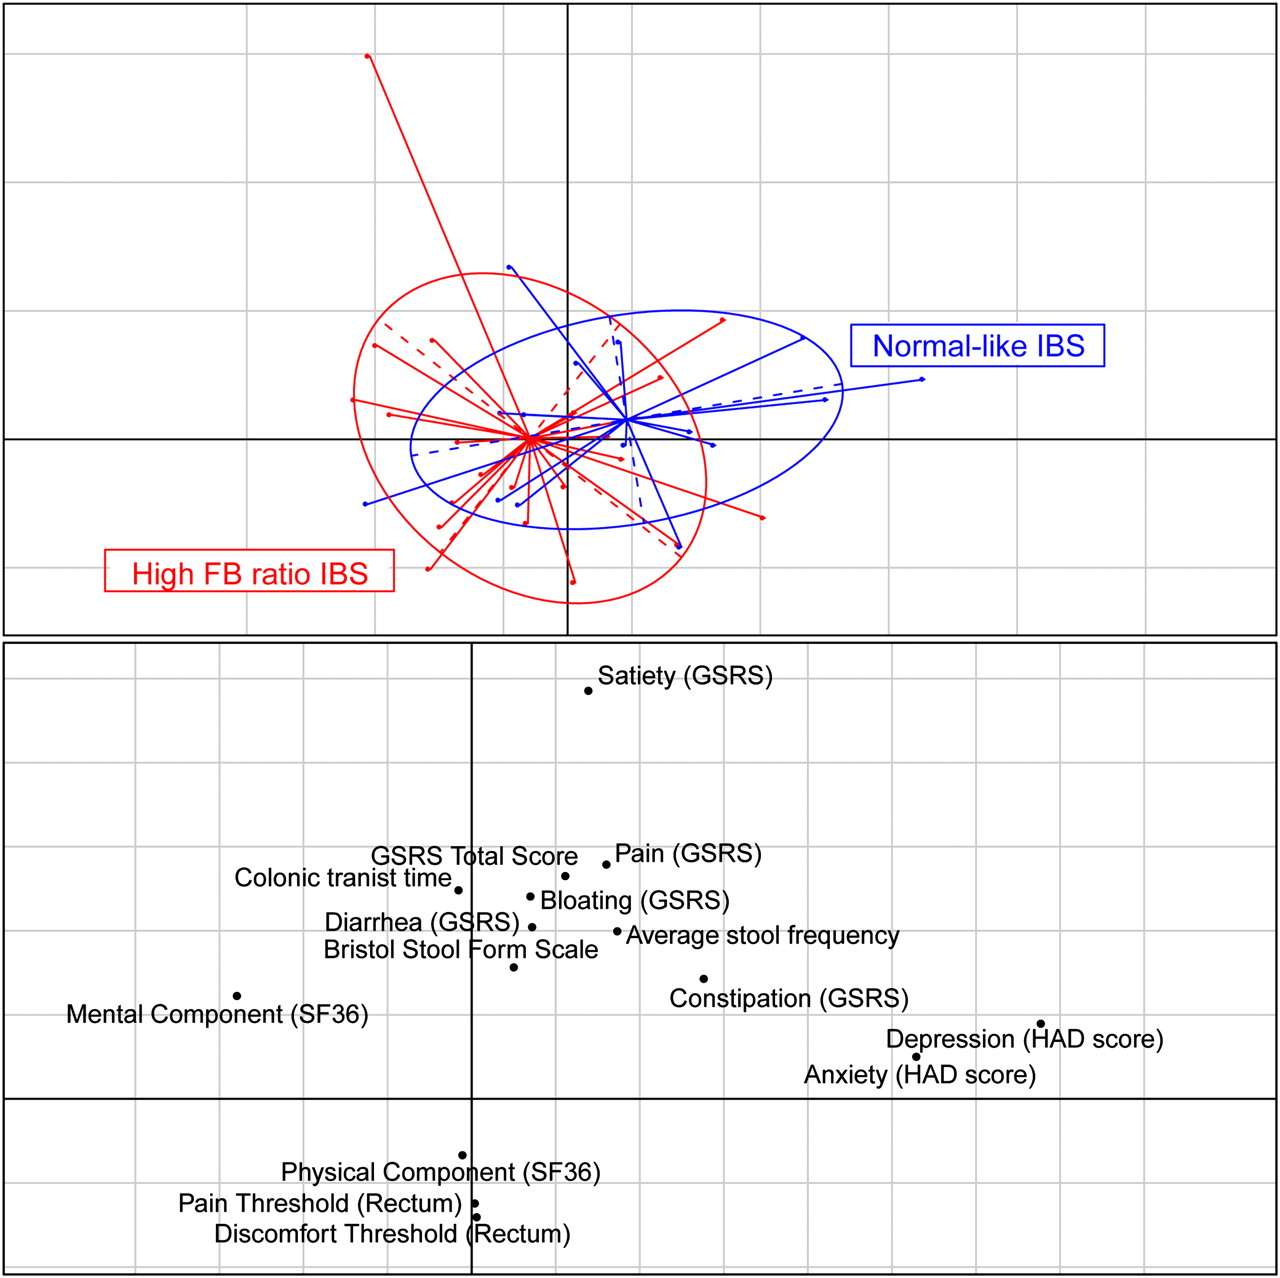
The rate of clinically significant depression in the high FB ratio IBS clusters was 2/22 (9%). This rate of clinically significant depression is comparable with that in the general Swedish population.28 This compares with the normal-like IBS group at 6/15 subjects or 40%. When tested using the HAD depression scores, it was found that the difference was significant based on the pairwise test between high FB ratio IBS clusters and normal-like IBS (p=0.02). The HAD depression score was the most differentiating clinical variable between the high FB ratio IBS and the normal-like IBS, evidenced by relationships between the microbiota and clinical variables, when visualised by correspondence analysis (figure 4). Correspondence analysis also showed a high correlation between clinically significant depression and anxiety (r=0.65, p value <0.00005). Other variables were not as discriminating between the two groups, but there are trends towards higher mental and physical component scores (SF-36) and rectal discomfort and pain thresholds in the high FB ratio IBS versus the normal-like IBS group (p>0.05).
Clinical information. Correspondence analysis showing high Firmicutes:Bacteroidetes (FB) ratio irritable bowel syndrome (IBS) (red) and normal-like IBS (blue) patients in the top panel and the clinical variables in the lower panel. GSRS, Gastrointestinal Symptom Rating Scale; HAD, Hospital Anxiety and Depression Scale; SF-36, short-form 36.
Discussion
We examined relationships between microbiota composition and clinical and physiological parameters in a cohort of well-characterised IBS patients, potentially facilitating mechanistic insights. Not surprisingly, given the heterogeneity that is intrinsic to IBS, clustering analysis of the microbiota data revealed different populations of IBS subjects. These groups were significantly different from each other. The first of these groups (n=15) clustered with the control samples and had no significantly associated microbiota composition features when compared with non-IBS controls. The second group consisted of two clusters (figure 1) that separated from the control samples. These IBS samples (n=22) were defined by large microbiota-wide changes. A number of associations were detected between microbiota composition and clinical or physiological phenotypes.
Previous studies have shown that the majority of the IBS samples formed a distinct cluster.10 29 However, to the best of our knowledge, this is the first study to robustly define IBS patients with no detectable changes in their faecal microbiota.
Correlation of differential microbiota composition with clinical data in IBS
Of the various parameters examined, the presence or absence of clinically significant depression was the single clinical feature that segregated in parallel with microbiota composition findings. Thus, while co-morbid depression was common among the normal-like IBS group, the prevalence of clinically significant depression among the high FB clusters was akin to the rate in the general population. While this observation deserves further study and requires confirmation, it does tempt one to speculate that microbiota analysis may permit differentiation of IBS patients into two groups: those in whom psychological comorbidity is highly prevalent and those in whom a more ‘organic’ pathophysiology, such as microbe–host immune interaction, may be more operative.
Statistical analysis showed that certain bacterial phylotypes were associated with clinical markers of IBS. Analysis of the IBS microbiota and separate analyses of the two subgroups showed microbial associations with colonic transit time, satiety, bloating, rectal pain threshold and depression.
Comparison with previous studies
Other groups have observed a significantly lower proportion of Bacteroides spp. in IBS patients than in healthy controls, but at the Bacteroidetes phylum level, no difference was detected between the groups.10 30 In the present study, we observed a reduction of Bacteroidetes that was confined to a high FB ratio subset of IBS patients. There was a general decrease in the two most common genera (Bacteroides and Alistipes). Similarly, at the OTU level, the Bacteroidetes-related genera involved were identified as Bacteroides, Alistipes and Parabacteroides.
Increased Firmicutes abundance has previously been recorded in IBS subjects.10–12 15 In our current study, this was combined with a decrease in the abundance of Bacteroidetes. This increase in the ratio of Firmicutes to Bacteroidetes was associated with over half of the IBS samples studied. The remaining normal FB ratio IBS samples had no detectable changes in the faecal microbiota.
In common with previous studies using molecular methods, we sampled the IBS microbiota at a single time-point. The intestinal microbiota is stable in healthy adults, including older adults in whom the microbiota is considered to be in flux,23 but it will be interesting in future studies to monitor the microbiota of IBS patients in sequential samples, including those which cover periods of remission, relapse and changes in bowel function.
Inflammation-linked microbiota
Elevated levels of serum antibodies specific for bacterial flagellins have been detected in postinfectious IBS patients.31 The possibility that flagellin-producing species might be relevant to the pathophysiology of IBS is supported by the documentation of a low level of mucosal inflammation within the GI tract, as well as a systemic pro-inflammatory cytokine phenotype, in all subtypes of IBS.32 Furthermore, though postinfectious IBS only explains a minority of cases of IBS, the documentation of the occurrence of IBS following bacteriologically-confirmed gastroenteritis in several studies2–4 represents a clear link between exposure to a bacterium, a sustained inflammatory response and IBS.
Of the 73 OTUs of the phylum Firmicutes that were differentially expressed across the groups, 70 were Clostridia/Clostridiales. The genus Lachnospiraceae incertae sedis accounted for 18 of these and has been shown to be enriched in diarrhoea-predominant IBS patients.33 Species belonging to L incertae sedis are known to express inflammatory flagellin proteins.34 These inflammatory flagellin-producing species were also classified as Clostridium cluster XIVa.
Clostridium cluster XIVa has also previously been shown to be associated with IBS.10 Our study noted an increased abundance of Clostridium cluster XIVa as being associated with the high FB ratio IBS.
Short-chain fatty acid producers and IBS
A number of studies have shown an increase in the amount of short-chain fatty acids (SCFAs) in IBS.15 35 Butyrate and acetate have many beneficial effects in relation to oxidative stress and inflammation,36 energy for the colonic epithelium,37 modulation of cell proliferation38 and protection against GI infections.39 40 However, butyrate promoted visceral hypersensitivity in a rat model41 and the butyrate-producing associated Clostridium cluster XIVa group42 and some specific butyrate-producing species such as Eubacterium hallii and Eubacterium desmolans43 were associated with IBS in this study. Taken together, these findings could explain the sensory dysfunction and poor tolerance of gas retention associated with IBS.44
Perhaps of greater significance is that the production of SCFAs has the ability to lower the pH in the colon.45 Duncan et al showed that tolerance of a reduced pH among the Firmicutes spp. varied for different species but, overall, the Clostridium cluster XIVa group showed the smallest reduction in growth rate, while the butyrate-producing associated Clostridium cluster IV growth rates were dramatically reduced.45 We detected no significant change in the overall abundance of Clostridium cluster IV.
B adolescentis are prominent in the adult gut microbiota. B adolescentis produces acetic acid and lactate, indicating it as a potential source of the increased SCFAs in IBS.46 Although we did not control for probiotics and probiotic use may have occurred in this population, we believe it unlikely that this increase in B adolescentis originated from an extraneous origin. Duncan et al45 and Collado and Sanz47 tested the tolerance of Bifidobacterium spp. to acidic pH conditions and showed that B adolescentis showed no deterioration in their growth rate but other species, including more abundant species, showed a reduced abundance when exposed to acidic conditions. These observations may explain why we recorded a significant increase in B adolescentis but not other species of Bifidobacterium in our analysis and the apparent disagreement with previous studies that demonstrated a reduction in Bifidobacterium, particularly B catenulatum, in IBS.13 14 48 It is unclear why our procedure apparently favoured detection of B adolescentis above other species, but differences in primer binding, amplification or DNA extraction efficiency for each species were likely contributors.
The reduction of Bacteroides proportion has been noted in this study and, interestingly, has also been associated with IBS.49 Bacteroidetes spp. experience progressive inhibition at reduced pH values.45 At least one Bacteroides spp. is known to have beneficial effects on mucosal tolerance.50
Antibiotic or probiotic consumption in IBS
We controlled for antibiotic use within 1 month of faecal sampling. While most constituents of the gut microbiota return to preantibiotic levels within 4 weeks, we concede that recent data shows that some species may fail to recover to preantibiotic levels for much longer periods after the end of antibiotic therapy.51 Given these findings, and the knowledge that Bifidobacterium spp. and some Bacteroides spp. that have been shown to be associated with IBS may be especially sensitive to longer-term effects of antibiotic use, we would advocate more prolonged antibiotic-free periods prior to faecal sampling in future studies. However, given the ubiquity of antibiotic use in the community and the advocacy, by some, of antibiotics for the treatment of IBS, this may be challenging in practice. We did not control for probiotic consumption, which might theoretically cause confounding effects upon microbiota composition. However, recent studies in our laboratory (Riboulet-Bisson, O'Toole et al, submitted) show very modest effects on the intestinal microbiota of mice and pigs administered large doses of bacteriocin-producing probiotic lactobacilli, and the effects in humans are also modest.52 53
Conclusion
Recently, the microbiota in IBS has been linked to immunological alterations and low grade inflammation in IBS. This study used a comparatively large number of well-characterised IBS subjects and deep level pyrosequencing to identify candidate microbiota elements that contribute to the pathology of IBS. This is the first study to define patient subgroups whose microbiota had markedly different characteristics and to associate microbial signatures to clinical variables within these subgroups. We have extended previous studies and provided new bacterial gut signatures and associations; some will require further investigation to fully define their role in IBS.
References
Supplementary materials
Supplementary Data
This web only file has been produced by the BMJ Publishing Group from an electronic file supplied by the author(s) and has not been edited for content.
Files in this Data Supplement:
- Download Supplementary Data (PDF) - Manuscript file of format pdf
- Download Supplementary Data (PDF) - Manuscript file of format pdf
- Download Supplementary Data (PDF) - Manuscript file of format pdf
Footnotes
Funding This study was supported by a Science Foundation Ireland CSET award to the Alimentary Pharmabiotic Centre, by the (Government of Ireland) Department of Agriculture Fisheries and Food/Health Research Board FHRI award to the ELDERMET project, by the Swedish Medical Research Council (grants 13409, 21691 and 21692), by the Marianne and Marcus Wallenberg Foundation and by the Faculty of Medicine, University of Gothenburg. MJC is supported by a fellowship from the Health Research Board of Ireland.
Competing interests None.
Patient consent Obtained.
Ethics approval This study was approved by the Regional Ethical Review Board at the University of Gothenburg.
Provenance and peer review Not commissioned; externally peer reviewed.
Data sharing statement All sequence reads are deposited at MG-RAST (accession numbers pending).