Article Text

Abstract
Objective Refractory coeliac disease type II (RCDII) is a severe complication of coeliac disease (CD) characterised by aberrant intraepithelial lymphocytes (IELs) of unknown origin that display an atypical CD3−CD7+icCD3+ phenotype. In approximately 40% of patients with RCDII these lymphocytes develop into an invasive lymphoma. In the current study we aimed to identify the physiological counterpart of these cells.
Design RCDII cell lines were compared with T-cell receptor positive (TCR+) IEL (T-IEL) lines by microarray analysis, real-time quantitative PCR and flow cytometry. This information was used to identify cells with an RCDII-associated phenotype in duodenal biopsies from non-refractory individuals by multicolour flow cytometry.
Results RCDII lines were transcriptionally distinct from T-IEL lines and expressed higher levels of multiple natural killer (NK) cell receptors. In addition to the CD3−CD7+icCD3+ phenotype, the RCDII lines were distinguishable from other lymphocyte subsets by the absence of CD56, CD127 and CD34. Cells matching this surface lineage-negative (Lin−) CD7+CD127−CD34− phenotype expressed a functional interleukin-15 (IL-15) receptor and constituted a significant proportion of IELs in duodenal specimens of patients without CD, particularly children, and were also found in the thymus. In patients without CD, the Lin−CD7+CD127−CD34− subset was one of four subsets within the CD3−CD7+icCD3+ population that could be distinguished on the basis of differential expression of CD56 and/or CD127.
Conclusion Our studies indicate that the CD3−CD7+icCD3+ population is heterogeneous and reveal the existence of a Lin− subset that is distinct from T, B, NK and lymphoid tissue inducer cells. We speculate that this IL-15 responsive population represents the physiological counterpart of aberrant cells expanded in RCDII and transformed in RCDII-associated lymphoma.
- Refractory coeliac disease
- aberrant intraepithelial lymphocytes
- NK cell receptor
- lymphoma
- IEL
- CD3−CD7+ population
Statistics from Altmetric.com
- Refractory coeliac disease
- aberrant intraepithelial lymphocytes
- NK cell receptor
- lymphoma
- IEL
- CD3−CD7+ population
Significance of this study
What is already known about this subject?
-
Refractory coeliac disease (RCD) is characterised by persistent pathology despite a gluten-free diet.
-
RCD is subdivided into two types; RCDII presents with a monoclonal expansion of aberrant CD3−CD7+icCD3+ intraepithelial lymphocytes (IELs), constituting over 20% of the IEL population and potentially transforming into an invasive lymphoma (enteropathy-associated T cell lymphoma).
-
Knowledge about the non-T-cell population in the healthy intestine is sparse: CD3−CD7+ were shown to contain natural killer (NK) and pre T cells and were found to be reduced in patients with CD compared with those without.
-
Interleukin-15 (IL-15) is upregulated in the duodenum of patients with RCDII and stimulates the survival and expansion of aberrant IELs.
What are the new findings?
-
Compared with TCR+CD3+ IEL (T-IEL) from patients with CD, aberrant IEL lines from those with RCDII overexpressed NK-cell associated genes; the RCDII cell lines were lineage-negative (Lin−), CD7+CD127−CD34−, distinguishing them from other intestinal lymphocyte populations.
-
In children without CD Lin−CD7+CD127−CD34− IEL constituted up to 30% of the IEL population of which up to 40% were icCD3+, displayed high expression of the IL-15Rβ chain (CD122) and proliferated in response to IL-15.
-
In patients without celiac disease, this Lin−CD7+CD127−CD34− population was one of four subsets present in the duodenal CD3−CD7+icCD3+ population.
Significance of this study
How might it impact on clinical practice in the foreseeable future?
-
Due to the low numbers of patients and the complicated pathology of RCD, the development of optimal diagnosis and treatment methods has remained a challenge. The addition of CD56, CD34 and CD127 to the current marker sets used for diagnosis of RCDII will help classify the expanded IEL population and may ultimately be linked to differential prognoses and responsiveness to treatment. Identification of the physiological cell population from which the aberrant IEL and lymphoma cells derive may help us understand what causes the resistance to a gluten-free diet and drives the expansion of these cells in RCDII and enteropathy-associated T-cell lymphoma and thus provide clues to its treatment.
Introduction
Coeliac disease (CD) is an enteropathy of the small intestine induced in HLA-DQ2+ and/or HLA-DQ8+ individuals by a polyclonal CD4+ T-cell response to gluten, leading to villous atrophy and crypt hyperplasia.1 In addition, the number of T-cell receptor (TCR)-αβ+ and TCR-γδ+ intraepithelial lymphocytes (IELs) is strongly increased2 and interleukin 15 (IL-15) is highly upregulated in the epithelium and in the lamina propria.3 ,4 Elimination of gluten from the diet usually restores the intestinal architecture, accompanied by a reduction in TCR-αβ+ IELs but not TCR-γδ+ IELs. However, 2–5% of patients with adult-onset CD develop refractory CD (RCD) with persisting epithelial damage and increased numbers of IELs,5 despite strict adherence to a gluten-free diet.
Based on immunophenotyping of the IEL population, RCD is subdivided into two types: RCD type I (RCDI) and RCD type II (RCDII). RCDI presents with <20% aberrant IELs, whereas in RCDII >20% of the IELs have an aberrant phenotype.6 For diagnostic purposes, aberrant IELs are defined as surface TCR−CD3−CD4−CD8−CD7+ but intracellular CD3+ cells that commonly display monoclonal TCR-γ gene rearrangements.6 ,7 In RCDII, the aberrant IELs gradually replace the normal IEL population and can undergo malignant transformation into lymphoma.8
The cellular origin of the aberrant CD3−CD7+icCD3+ population that expands in RCDII is still unclear. One view is that aberrant IELs originate from mature TCR+CD3+ IELs (T-IEL) that downregulate the TCR-CD3 complex due to overstimulation.7 This view is supported by the observation that aberrant IELs have intracellular expression of the CD3γ, CD3δ, CD3ɛ and ζ chains and commonly display monoclonal TCR-γ gene rearrangements.7–9 Intracellular CD3 expression, however, is not exclusive to mature T cells as pre T cells and some natural killer (NK) cells also express all CD3 chains intracellularly.10 ,11 Therefore, an alternative view is that aberrant IELs derive from a surface CD3−CD7+ IEL population that is already present in the healthy small intestine. By immunohistochemical analysis12 and three-colour flow cytometry13 the CD3−CD7+ IEL population was studied in patients with CD and those without, demonstrating a reduction of this population in patients with CD compared with those without. Later studies focused on the composition and characterisation of this IEL population in the intestine of people without CD.12 ,14–18 The CD3−CD7+ IEL population proved to contain NK cells17 and immature T cells.14–16 ,18 Due to limitations of the techniques applied and the small amount of cells available from biopsy material an accurate identification and quantification of rare (sub)populations within the IEL population is challenging. In the present study we therefore combined microarray analysis, real-time quantitative PCR (RT-qPCR) and multicolour flow cytometry to extensively characterise aberrant RCDII cell lines from patients with RCDII. Subsequently, we used this information to design a multicolour staining protocol to investigate the presence and phenotype of RCDII-like cells in duodenal biopsy material from patients with CD and those without as a first step to determine the cellular origin of aberrant IELs.
Materials and methods
Human specimens
Duodenal biopsies were obtained as previously described.9 Fetal tissues were obtained from elective abortions and gestational age was determined by ultrasonic measurement of the diameter of the skull or the femur. Thymic material was obtained as surgical tissue discards from four children without immunological abnormalities (2, 5, 7 and 8 months old) undergoing cardiac surgery. Thymocytes were isolated as described19 and stored at −80○C until further analysis.
All specimens were obtained after informed consent, medical ethical commission approval and in accordance with the local ethical guidelines of the VU Medical Center in Amsterdam (adult duodenal biopsies), the Leiden University Medical Center (paediatric duodenal biopsies) or the Erasmus MC in Rotterdam (fetal intestine, thymuses) and in accordance with the declaration of Helsinki.
Cell lines and cell culture
RCDII cell lines P1, P2, P3 and P4 were isolated from duodenal biopsies of patients with RCDII and maintained as described.9 Control cell lines for P1 were a CD4+ T-cell line (P1-CD4) and a CD8+ T-cell line (P1-CD8) isolated from the same biopsy as the RCDII cell line P1. A CD4+ T-cell clone (P3-CD4) and a CD8+ T-cell line (P1-CD8) was isolated from the same biopsy as the RCDII cell line P1 or P3, respectively. T-IEL lines (CD4+ and CD8+T: IEL1–5) were isolated from four patients with CD and one patient with Crohn's disease, as described for RCDII lines. IEL1-CD4 was derived from IEL1, IEL5-CD8 from IEL5. NK cells were negatively selected from peripheral blood mononuclear cells (PBMCs) by depletion using MACS beads (Miltenyi, Bergisch Gladbach, Germany).
RCDII lines and T cells were restimulated with mixed irradiated allogeneic PBMCs, 1 μg/ml phytohaemagglutinin, 20 Cetus units/ml interleukin (IL)-2 (Proleukin, Chiron corporation, Emeryville, California, USA) and 10 ng/ml IL-15 (R&D systems Europe, Abingdon, UK) approximately every 4 or 2 weeks, respectively and maintained on 10% normal human serum (NHS) containing 10 ng/ml IL-15 and 20 Cetus units/ml IL-2. After isolation, NK cells were cultured for 2 weeks in AMV-I medium containing 10% NHS and IL-15 (10 ng/ml).
Isolation of cells from duodenal biopsy specimen for flow cytometry
Cells were isolated from two or three duodenal biopsies by treatment with 1 mM DTT (Fluka, Buchs, Switzerland) for 20 min followed by the addition of 1 mM EDTA (Merck, Darmstadt, Germany) under rotation for 2 h at 37○C. Since DTT incubation decreases CD103 expression20 all CD45+ cells were considered IELs. The IELs were then washed with phosphate-buffered saline (PBS) containing 0.5% fetal calf serum (FCS) and fixed for 10 min at 4°C with PBS containing 0.1% paraformaldehyde and 0.5% FCS. After washing the cells were kept at 4°C until flow cytometric analysis.
Antibodies and flow cytometry
Fluorochrome-labelled antibodies specific for CD1a, CD2, CD3, CD4, CD5, CD6, CD7, CD8α, CD11a, CD16, CD18, CD25, CD27, CD28, CD30, CD31, CD33, CD34, CD38, CD40, CD44, CD45RA, CD45RO, CD54, CD56, CD62L, CD94, CD103, CD117, CD122, CD152, CD154, CD161, CD226, integrin β7, killer-cell immunoglobulin-like receptor (KIR)-3DL1 and NKG2D were purchased from BD Biosciences (San Jose, California, USA). Fluorochrome-labelled antibodies specific for CD8β, KIR2DL2/DL3/DS2, KIR2DL1/2DS1, KIR2DS4, KIR3DL1, CD244, NKp30, NKp44 and NKp46 were purchased from Beckman Coulter (Fullerton, California, USA). Fluorochrome-labelled antibodies specific for IL-15Rα, KIR2DL3, KIR2DL4, NKG2A and NKG2C were purchased from R&D systems. Anti-CD19 was from Exbio (Vestec, Czech Republic), anti-CD14 from Immunotools (Friesoythe, Germany), anti-CD7, CD127, CD45 and Ki-67 were from eBioscience (San Diego, California, USA) and anti-CD52 was from Genzyme (Cambridge, UK). The anti-KIR2DS2/2DL3 antibody was a kind gift from Dr C Retiere,21 the anti-KIR3DL2 antibody from Dr D Pende22 and the anti-KIRDL5 antibody from Dr C Vilches.23 For antibody clone names see table 1.
For surface staining, cells were incubated for 30 min with fluorochrome-conjugated antibodies. For intracellular CD3 or Ki-67 staining, the cells were subsequently lysed with BD lysing solution for 10 min at room temperature then washed thoroughly and treated with permeabilising solution 2 (BD) for 10 min at room temperature, after which the cells were incubated with anti-CD3 or anti-Ki-67 for an additional 30 min and washed again. Antibody-stained cells were acquired on an LSR II or FACS-Calibur (BD Biosciences) and the results were analysed with FACSDIVA V.6.1.2 or FlowJo V.7.6.3 software. Relative mean fluorescence intensity (MFI) was calculated as follows: (MFI staining antibody)/(MFI isotype control). Percentages obtained from FACS analysis were computed in 4-GraphPad.
RNA isolation and preparation
Total RNA was extracted from cell lines using the RNeasy Mini Kit (Qiagen, Venlo, the Netherlands) followed by DNAse digestion using the RNase-free DNAse kit (Qiagen). The RNA samples were labelled in duplicate with the Ambion Illumina TotalPrep RNA-amplification kit (Illumina, Son, The Netherlands) for the microarray study.
Microarray hybridisation and microarray data analysis
Biotinylated cRNA samples were hybridised on 2 Illumina HumanHT-12 V3 Expression BeadChips according to the Illumina BeadArray protocol. Samples were randomly distributed among the two BeadChips.
The intensities of the expression results were parsed into the R statistical computing environment using the beadarray package.24 Gene expression values were log2 transformed and normalised using the quantile method across all samples. Samples were grouped into lymphoma and control for a two-sample comparative study, fold changes and adjusted p values were calculated using the limma package.25 The Benjamini and Hochberg method was used to adjust p values for multiple-testing errors. The cut-off criteria for differential expression was set at a relative difference of more than sevenfold change and adjusted p value <0.001.
Unsupervised hierarchical clustering of the samples was done using the complete clustering method with the Euclidean distance metric. The result was plotted using the heatmap.2 function from the R plots package. Gene ontology clusters were determined with PANTHER (http://www.pantherdb.org/).
Real-time quantitative PCR
cDNA was synthesised using superscript reverse transcriptase III (Invitrogen, Grand Island, New York, USA), following the manufacturer's instructions. Gene-specific PCR primers were designed using the Roche web-based universal ProbeFinder software tool, V.2.45 (www.roche-applied-science.com). RT-qPCR was performed in a Step One Plus Real Time PCR System (Applied Biosystems, Carlsbad, California, USA). The reactions were set up in a Microamp 96 well plate (Applied Biosystems), using the forward and reverse primers (each at 400 nM) in Fast Start Universal SYBR Green Master Mix solution (Roche, Germany). The thermal profile for all reactions was 10 min at 95°C, followed by 40 cycles of 15 s at 95°C and 1 min at 60°C. All RT-qPCR measurements were done in triplicate. The Δthreshold cycle (CT) values were determined using GAPDH as the reference gene.
Statistics
Statistical analysis was conducted using two-tailed unpaired Student t test. A p value <0.05 was considered significant.
Results
Molecular analysis reveals higher expression levels of NK cell-associated genes on RCDII lines compared with TCR+ IEL lines
To define the differences between aberrant IELs and regular T-IELs in detail, aberrant cell lines from patients with RCDII (RCDII lines) and control T-IEL cell lines were subjected to microarray analysis. The RCDII cell lines were isolated from small intestinal biopsies of patients with RCDII (P1, P2 and P3) and displayed the characteristic phenotype of aberrant IELs: surface TCR−, CD3−, CD4−, CD8−, CD7+, CD103+, intracellular CD3+.9 The controls included five polyclonal CD103+ CD4+ and CD8+ TCRαβ+ T-IEL lines (T-IEL); a CD4+TCR+ cell line from patient P1 (P1-CD4); a CD4+TCR+ clone from patient P3 (P3-CD4); and a CD8+TCR+ IEL line from patient P1 (P1-CD8).
Unsupervised hierarchical clustering analysis revealed two main branches: one contained the RCDII lines while the other contained all control TCR+ cell lines, including those from patients P1 and P3 (figure 1A). Therefore, the RCDII lines were transcriptionally distinct from TCR+ cell lines, yet similar to each other. The RCDII lines had relatively high expression values of NK-cell-associated genes. The amount of KIR transcripts was roughly 5-fold to 20-fold higher in RCDII lines versus controls. Furthermore, the RCDII lines showed higher expression levels of phospholipase C γ2 (PLCG2), which plays a pivotal role in secretion of cytotoxic granules in NK cells.26 The RCDII lines also had higher expression levels of SH2 domain containing 1B (SH2D1B/EAT-2) which can act as an adapter molecule for the cell surface receptors CD84, CD244 and CD150 (SLAMF1).27 All RCDII cell lines expressed CD244 (table 1), a receptor expressed by NK cells and effector/memory T cells,28 while SLAMF1 expression was downregulated in the RCDII cell lines. In addition, several other genes that are associated with T-cell mediated immunity according to the PANTHER classification were downregulated in the RCDII lines compared with the T-cell lines, in particular granulysin (GNLY), lymphotoxin β (LTB) and tumour necrosis factor receptor 4 (figure 1A,B). The differential expression of seven genes (TNS3, SLAMF1, FoxD1, SH2D1B, PLCG2, LAT, LTB) was confirmed by RT-qPCR (figure 1B and data not shown). An additional 12 surface markers (CD154, CD278, CD6, CD44, CD7, CD244, CD82, CD160, CD127, CD18, CD5, CD158d) were analysed by flow cytometry (figure 2 and data not shown) and also corroborated the microarray results. Furthermore, analysis of TCR rearrangements revealed that none of the RCDII lines possessed functionally rearranged TCRα/β or TCRγ/δ loci.29 Together, these data showed that RCDII lines were distinct from mature T-cell lines and expressed several NK-cell-associated genes.
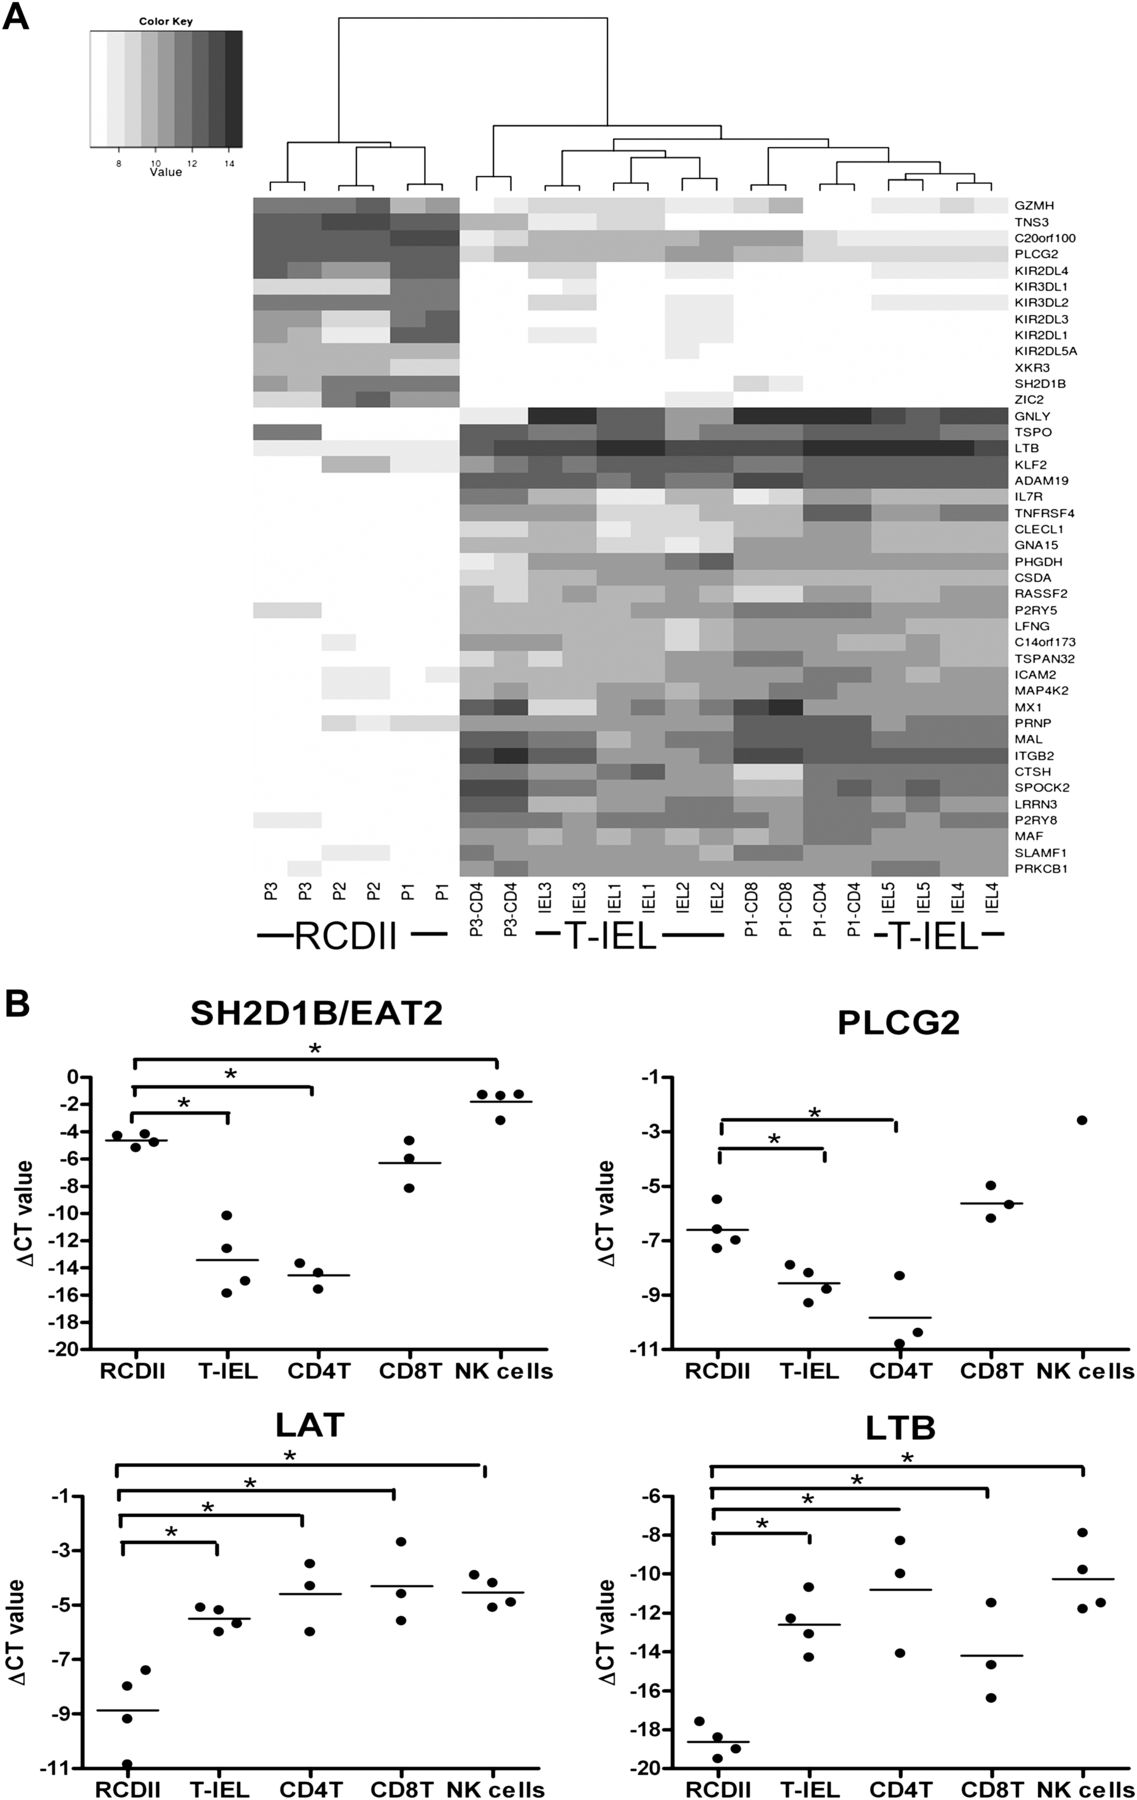
RCDII lines express higher levels of natural killer (NK) cell-associated genes compared with regular TCR+ cell lines (T-IEL). (A) Unsupervised hierarchical clustering analysis of the gene expression profiles of RCDII lines P1, P2 and P3 and TCR+ cell lines P1-CD4, P1-CD8, P3-CD4 and IEL1–5. The heat map depicts the log intensity values of differentially expressed genes with a false discovery rate of p<0.01 and a fold change difference of more than seven. Darker grey corresponds to higher log intensity values. KIR allocation was imprecise as KIR probes anneal to transcripts of multiple KIR genes. (B) Quantification of differential gene expression by real-time quantitative PCR. Relative expression of SH2D1B, PLCG2, LAT and LTB in RCDII lines (P1–P4), T-IEL lines (IEL1–4) and CD4+ T-cell lines (CD4T: P1-CD4, P3-CD4, IEL1-CD4), CD8+ T-cell lines (CD8T: P1-CD8, P3-CD8, IEL5-CD8) and NK cell lines from four independent donors (NK cells). The ΔCT value is depicted on the y-axis. IEL, intraepithelial lymphocyte; NK, natural killer; CT, threshold cycle; RCDII, refractory coeliac disease type II; T-IEL, T-cell receptor positive intraepithelial lymphocyte.
Flow cytometry analysis of refractory coeliac disease type II cell lines P1–P4

Confirmation of differentially expressed genes from figure 1 by flow cytometry analysis. RCDII lines (P1–P4) and T-IEL (IEL1-5, IEL1-CD4, P1-CD8, P3-CD8, IEL5-CD8) were analysed for expression of (A) CD158d (KIR2DL4), (B) CD5, (C) CD18 (ITGB2) and (D) CD127 (IL7R) by flow cytometry. On the left, a histogram of a representative staining for one RCDII and one T-IEL line (grey filling = isotype, no filling = antibody) is shown. The scatter plots on the right depict the relative mean fluorescence intensities (relative MFI = MFI antibody/MFI isotype) of all RCDII and T-IEL lines. *p<0.05. KIR, killer-cell immunoglobulin-like receptor; ITGB2, integrin beta 2; IL7RA, interleukin 7 receptor alpha; MFI, mean fluorescence intensity; RCDII, refractory coeliac disease type II; T-IEL, T-cell receptor positive intraepithelial lymphocyte.
RCDII lines display a previously undescribed lymphocyte phenotype
To confirm and extend the results of the microarray analysis, we determined the expression of a large set of cell surface markers on RCDII lines P1, P2, P39 and on RCDII line P4 by flow cytometry (table 1). RCDII line P4 (online supplementary figure 1) was derived from an additional patient with RCDII. Like T-IEL, all RCDII lines expressed the pan-leucocyte marker CD45 but lacked expression of B-cell marker CD19 and monocyte marker CD14 (table 1). Although the RCDII lines did not express the NK cell marker CD56 (with the exception of a small CD56+ fraction within RCDII line P3, see table 1), they each expressed a unique selection of NK cell receptors (table 1). Consistent with the microarray results (figure 1A), all RCDII lines but not the control T-cell lines expressed KIR2DL4/CD158d (figure 2A), which has thus far been detected on mature NK cells and memory T cells only. In addition, these cells expressed the IL-2/15Rβ chain (CD122), normally found on NK cells and memory T cells (table 1). These results confirm and extend previous studies30–32 and indicate that RCDII lines share features with T and NK cells.
The absence of the main lineage (Lin) markers (CD3, CD14, CD19, CD56) in combination with intracellular CD3 would be consistent with an immature lymphocyte phenotype. However, the RCDII lines did not express CD34, CD1a or CD117 (table 1), markers associated with T-cell and NK-cell precursors.33 ,34 Furthermore, RCDII lines P1, P2, P3 did not express RAR-related orphan receptor C (RORC) transcripts (data not shown) or the CD127/IL-7 receptor on the cell surface (table 1, figure 2D). RCDII line P4 was partly CD127 (IL-7Rα) positive, but ROR-C negative (data not shown). Therefore, the RCDII lines also did not match the phenotype of lymphoid tissue inducer cells (LTi) cells, a Lin− CD127+RORC+ cell population present in the small intestine.35 ,36
Together, these results demonstrate that the RCDII lines share features with T and NK cells and display a previously undescribed IEL phenotype: Lin−CD7+CD127−CD34−.
Lin−CD7+CD127−CD34− IELs are also found in people without CD
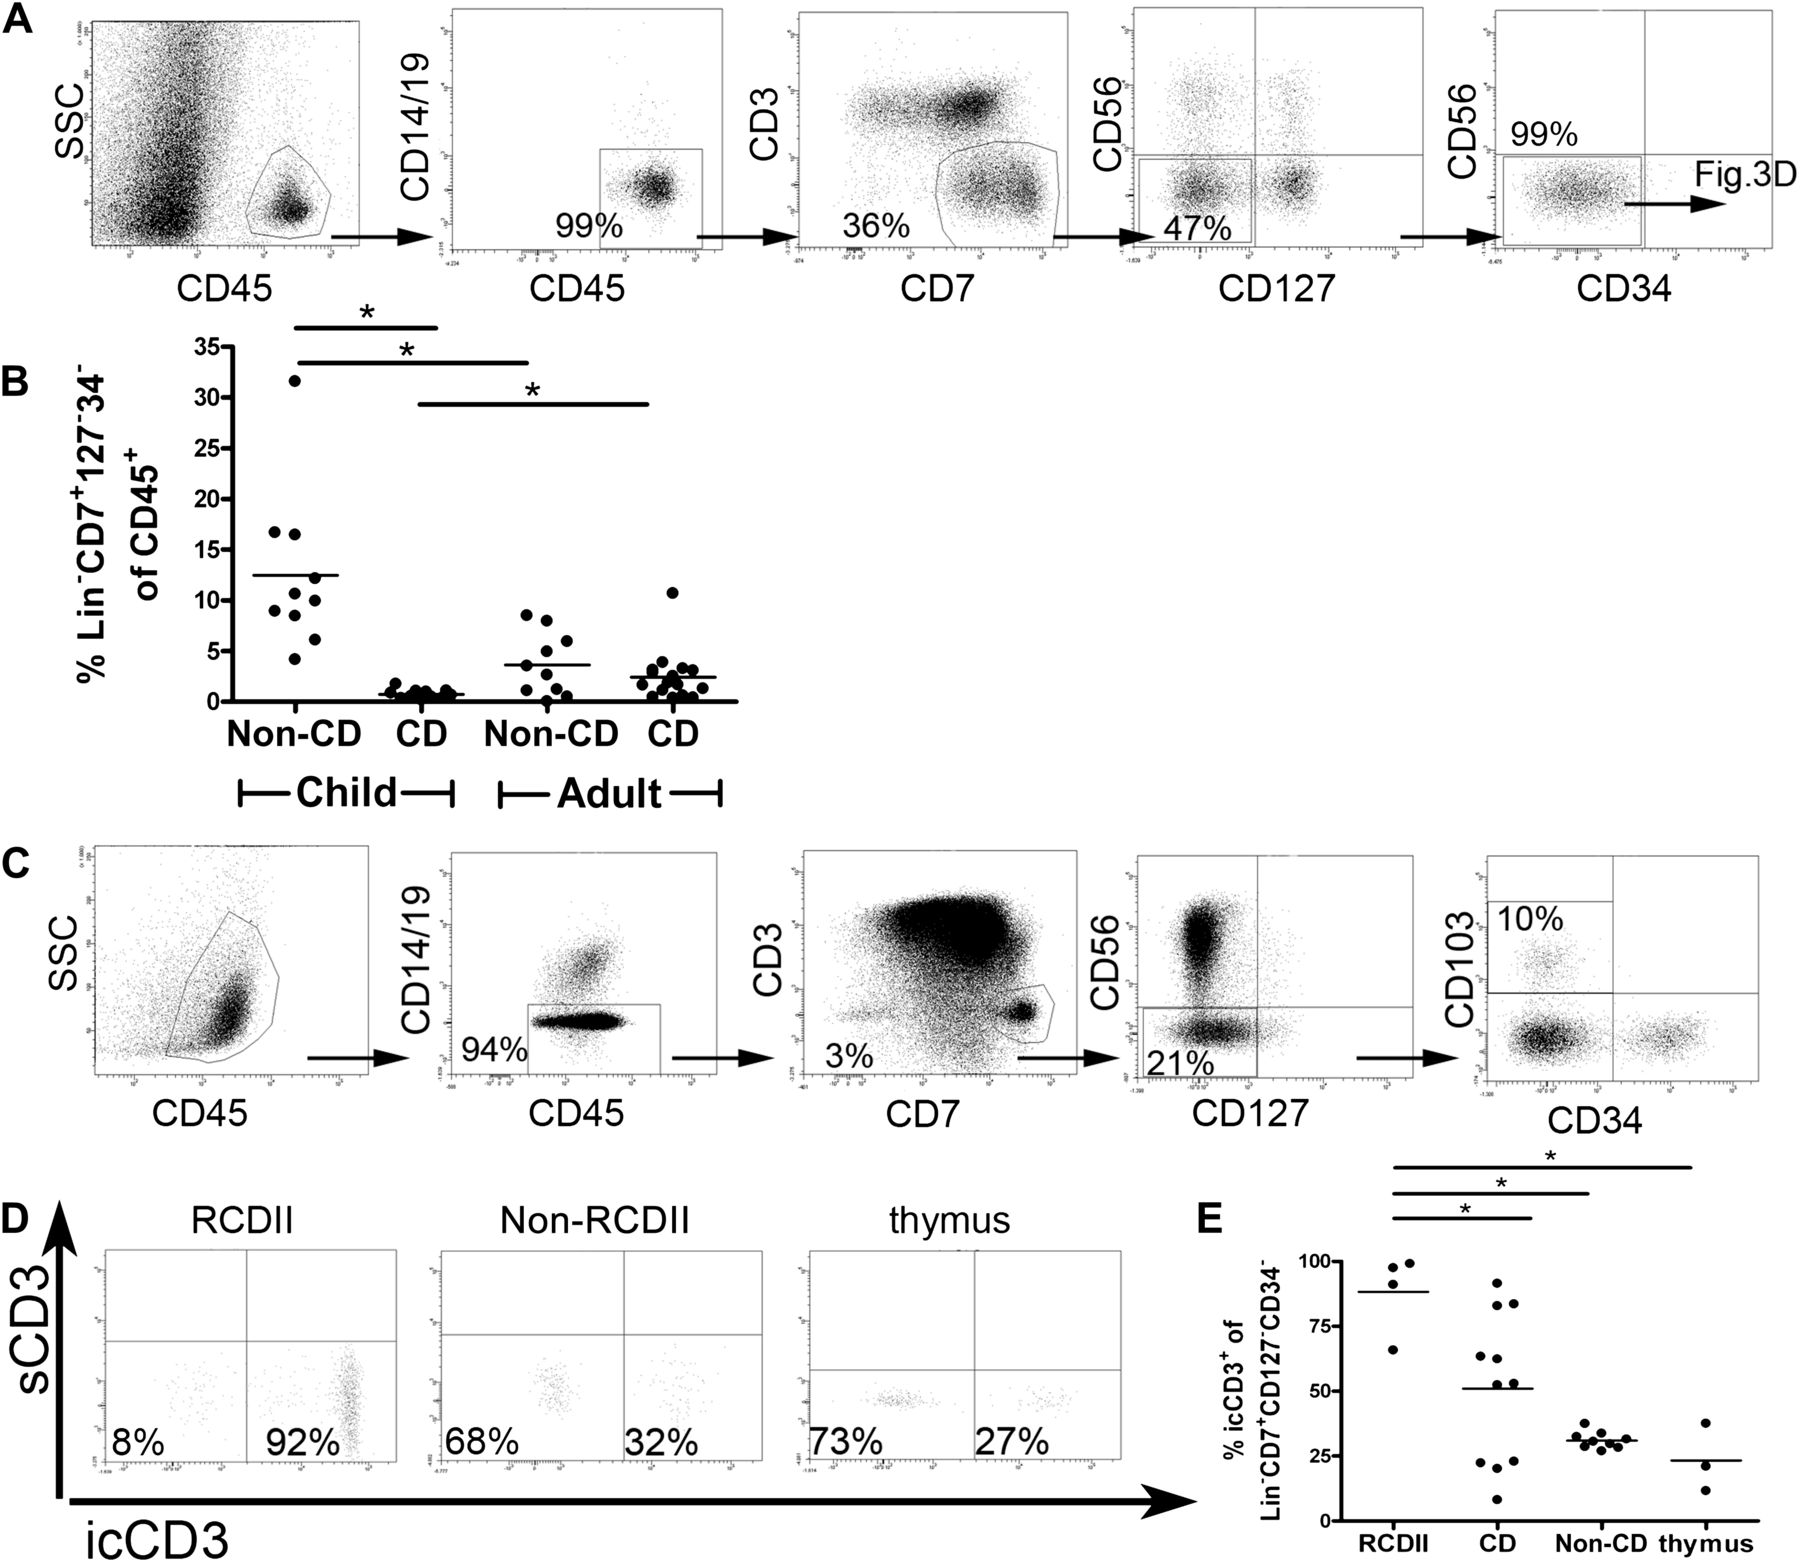
Next we investigated if cells with a Lin−CD7+CD127−CD34− phenotype were also present in people without CD. Multicolour flow cytometric analysis of IELs from duodenal biopsies of children and adults without CD showed that cells with this phenotype were indeed present (figure 3A). These cells constituted on average 4% (range 0–8%, n=10) of the CD45+SSClow population in adults without CD and were more abundant (average 13%, range 4–32%, n=10) in children without CD (figure 3B). In children with CD, this subset formed on average 0.7% (range 0–2%, n=11) of the CD45+SSClow population while this was on average 1.8% (range 0–10%, n=16) in adults with CD. Thus, Lin−CD7+CD127−CD34− IELs are present in the duodenum of people without CD and in those with CD.

Lin−CD7+CD127−CD34− IELs are a physiological lymphocyte population in people with and without CD. (A) FACS analysis of cells isolated from the epithelium of duodenal biopsies from a child without CD. Each plot shows the cells gated in the previous plot with the calculated percentages from the previous gate. The experiment shown is qua gating and populations representative of adults without CD (n=10) and children without CD (n=10). (B) Fraction of Lin−CD7+CD127−CD34− IELs in duodenal biopsies expressed as a percentage of the CD45+SSClow population. This graph summarises data from 11 children with CD (CD), 10 children without CD (no CD), 16 adults with CD (CD) and 10 adults without CD (no CD). (C) FACS analysis of a healthy thymus (8-month-old child) using the same gating strategy and calculations as described in A. Plots are representative of four donors. (D) Representative FACS plot depicts intracellular CD3 staining of Lin−CD7+CD127−CD34− IELs in a patient with RCDII, an individual without RCD and a thymus sample. (E) Percentages of intracellular CD3+ cells within Lin−CD7+CD127−CD34− IELs in patients with RCDII (n=4), patients with CD (n=11), and those without CD (n=9) and thymus samples (n=3). *p<0,05 (unpaired Student t test). CD, coeliac disease; IEL, intraepithelial lymphocyte; RCD, refractory coeliac disease; s, surface; ic, intracellular.
In contrast to the duodenum, few Lin−CD7+CD127−CD34− IELs were found in the ileum (average 0.3%, n=2; data not shown) and colon (average 0.1%, n=3; data not shown). Furthermore, Lin−CD7+CD127−CD34− IELs were not detected in two fetal intestinal samples (data not shown). Most CD3−CD7+ cells in the fetal intestinal samples were CD56+ or CD127+ cells (data not shown). In human thymic cell suspensions, Lin−CD7+CD127−CD34− cells expressing CD103 constituted on average 0.1% (range 0.0–0.3%, n=4) of CD45+SSClow thymocytes (figure 3C). These findings indicate that the postnatal duodenum is the preferential intestinal site for Lin−CD7+CD127−CD34− IELs, and suggest that this population may be thymus derived.
The classical definition of aberrant IELs in RCDII includes the presence of intracellular CD3ɛ. Indeed, the large majority (average 88%, range 66–99% n=4) of Lin−CD7+CD127−CD34− IELs in RCDII duodenal biopsies expressed CD3 intracellularly (figure 3D,E), while this was on average 51% (range 8–91, n=11) in people with CD and 31% (range 27–37, n=9) in people without CD (figure 3D,E). On average 23% (range 11–37%, n=3) of Lin−CD7+CD127−CD34− IELs in the thymus showed intracellular CD3 expression (figure 3D,E).
In conclusion, a sizeable fraction of the Lin−CD7+CD127−CD34− cells in the duodenum and in the thymus expressed intracellular CD3ɛ.
Lin−CD7+CD127−CD34− form a subpopulation of CD3−CD7+icCD3+ cells
As the diagnosis of RCDII and enteropathy-associated T-cell lymphoma (EATL) is made on the basis of the identification of a CD3−CD7+icCD3+ cell population either by histological or flow cytometric means,6–8 ,37 we inverted our gating strategy to determine the specific phenotype of the CD3−CD7+icCD3+ population. Using this strategy we observed that in patients without RCD (patients with CD and those without CD) this duodenal CD3−CD7+icCD3+ cell population was composed of four distinct populations: CD56+CD127−, CD56+CD127+, CD56−CD127− and CD56−CD127+ (figure 4A). In patients with RCDII (n=4) only two populations were observed: CD56−CD127− and CD56−CD127+ cells (figure 4B). In the thymus the CD3−CD7+icCD3+ cells predominantly expressed CD56+ or were CD56−CD127− (figure 4C). These findings revealed that the duodenal CD3−CD7+icCD3+ IEL population is heterogeneous and that a subset of aberrant IELs in patients with RCDII biopsies express IL-7R (CD127).

CD3−CD7+icCD3+ cells form a heterogeneous population. FACS analysis of CD45+SSClowCD14−/CD19− intraepithelial cells isolated from duodenal biopsies of (A) people without RCD (no CD: n=9, CD: n=11), (B) patients with RCDII (n=4) and (C) healthy thymuses (n=3). Representative dot plots are shown on the left; each plot depicts the cells gated in the previous plot. The graphs on the right summarise the results: the average (±SD) size of each of four subsets of CD3−CD7+icCD3+ cells is shown, based on the presence or absence of CD127 and CD56. RCD, refractory coeliac disease.
Lin−CD7+CD127−CD34− IELs express the IL-2/15 receptor β chain and proliferate in response to IL-15
Expression of the cytokine IL-15 is elevated in the duodenum of patients with CD and RCD.3 As IL-15 is critical for the survival and expansion of RCDII cell lines3 ,38 we examined the expression of the IL-2/15 receptor β chain (CD122) on IEL subsets from non-coeliac (n=5), coeliac (n=2) and RCDII (n=1) duodenal biopsies (figure 5A,B). Lin−CD7+CD127−CD34− IELs expressed CD122 (figure 5A). In fact, CD122 expression levels on these cells were higher than on NK cells, which are known to be IL-15 responsive. However, CD122 expression levels on Lin−CD7+127+34− cells were lower than on NK cells and no CD122 was detected on T cells (figure 5B). CD122 expression by PBMC from the same patients showed a different pattern as Lin−CD7+CD127−CD34− cells in blood had a lower CD122 expression than NK cells, while T cells, like in biopsies, were negative for CD122 expression (figure 5C).

CD122 (IL2/IL-15Rβ) expression on T, Lin−CD7+CD127−CD34− IELs, Lin−CD7+CD127+CD34− and NK cells. (A) Representative experiment of the CD122 expression of IEL subsets of a child without CD. The MFI of surface CD122 expression of T cells (CD3+), Lin−CD7+CD127−CD34− IELs, Lin−CD7+CD127+CD34− IEL and NK cells (CD3−CD56+CD127+/−) is depicted between square brackets. The CD122 expression is shown on the x-axis and the cell count on the y-axis. All IELs depicted here are CD45+SSClowCD14−CD19−CD7+CD34−. (B) CD122 MFI expression of IEL subsets. Expression of CD3, CD56 and CD127 is used to differentiate the subpopulations as explained for (A) within CD45+SSClowCD14−CD19−CD7+CD34− cells from biopsies. (C) CD122 MFI expression of PBMC subsets. Expression of CD3, 56 and CD127 is used to differentiate the subpopulations within CD45+SSClowCD14−CD19−CD7+CD34− cells in PBMCs from the same donors as in (B). (B) and (C) summarise data from eight donors (no CD, n=5; CD, n=2; RCDII, n=1). Lines connect data from individual donors. IEL, intraepithelial lymphocyte; MFI, mean fluorescence intensity; NK, natural killer; PBMC, peripheral blood mononuclear cell; RCDII, refractory coeliac disease type II.
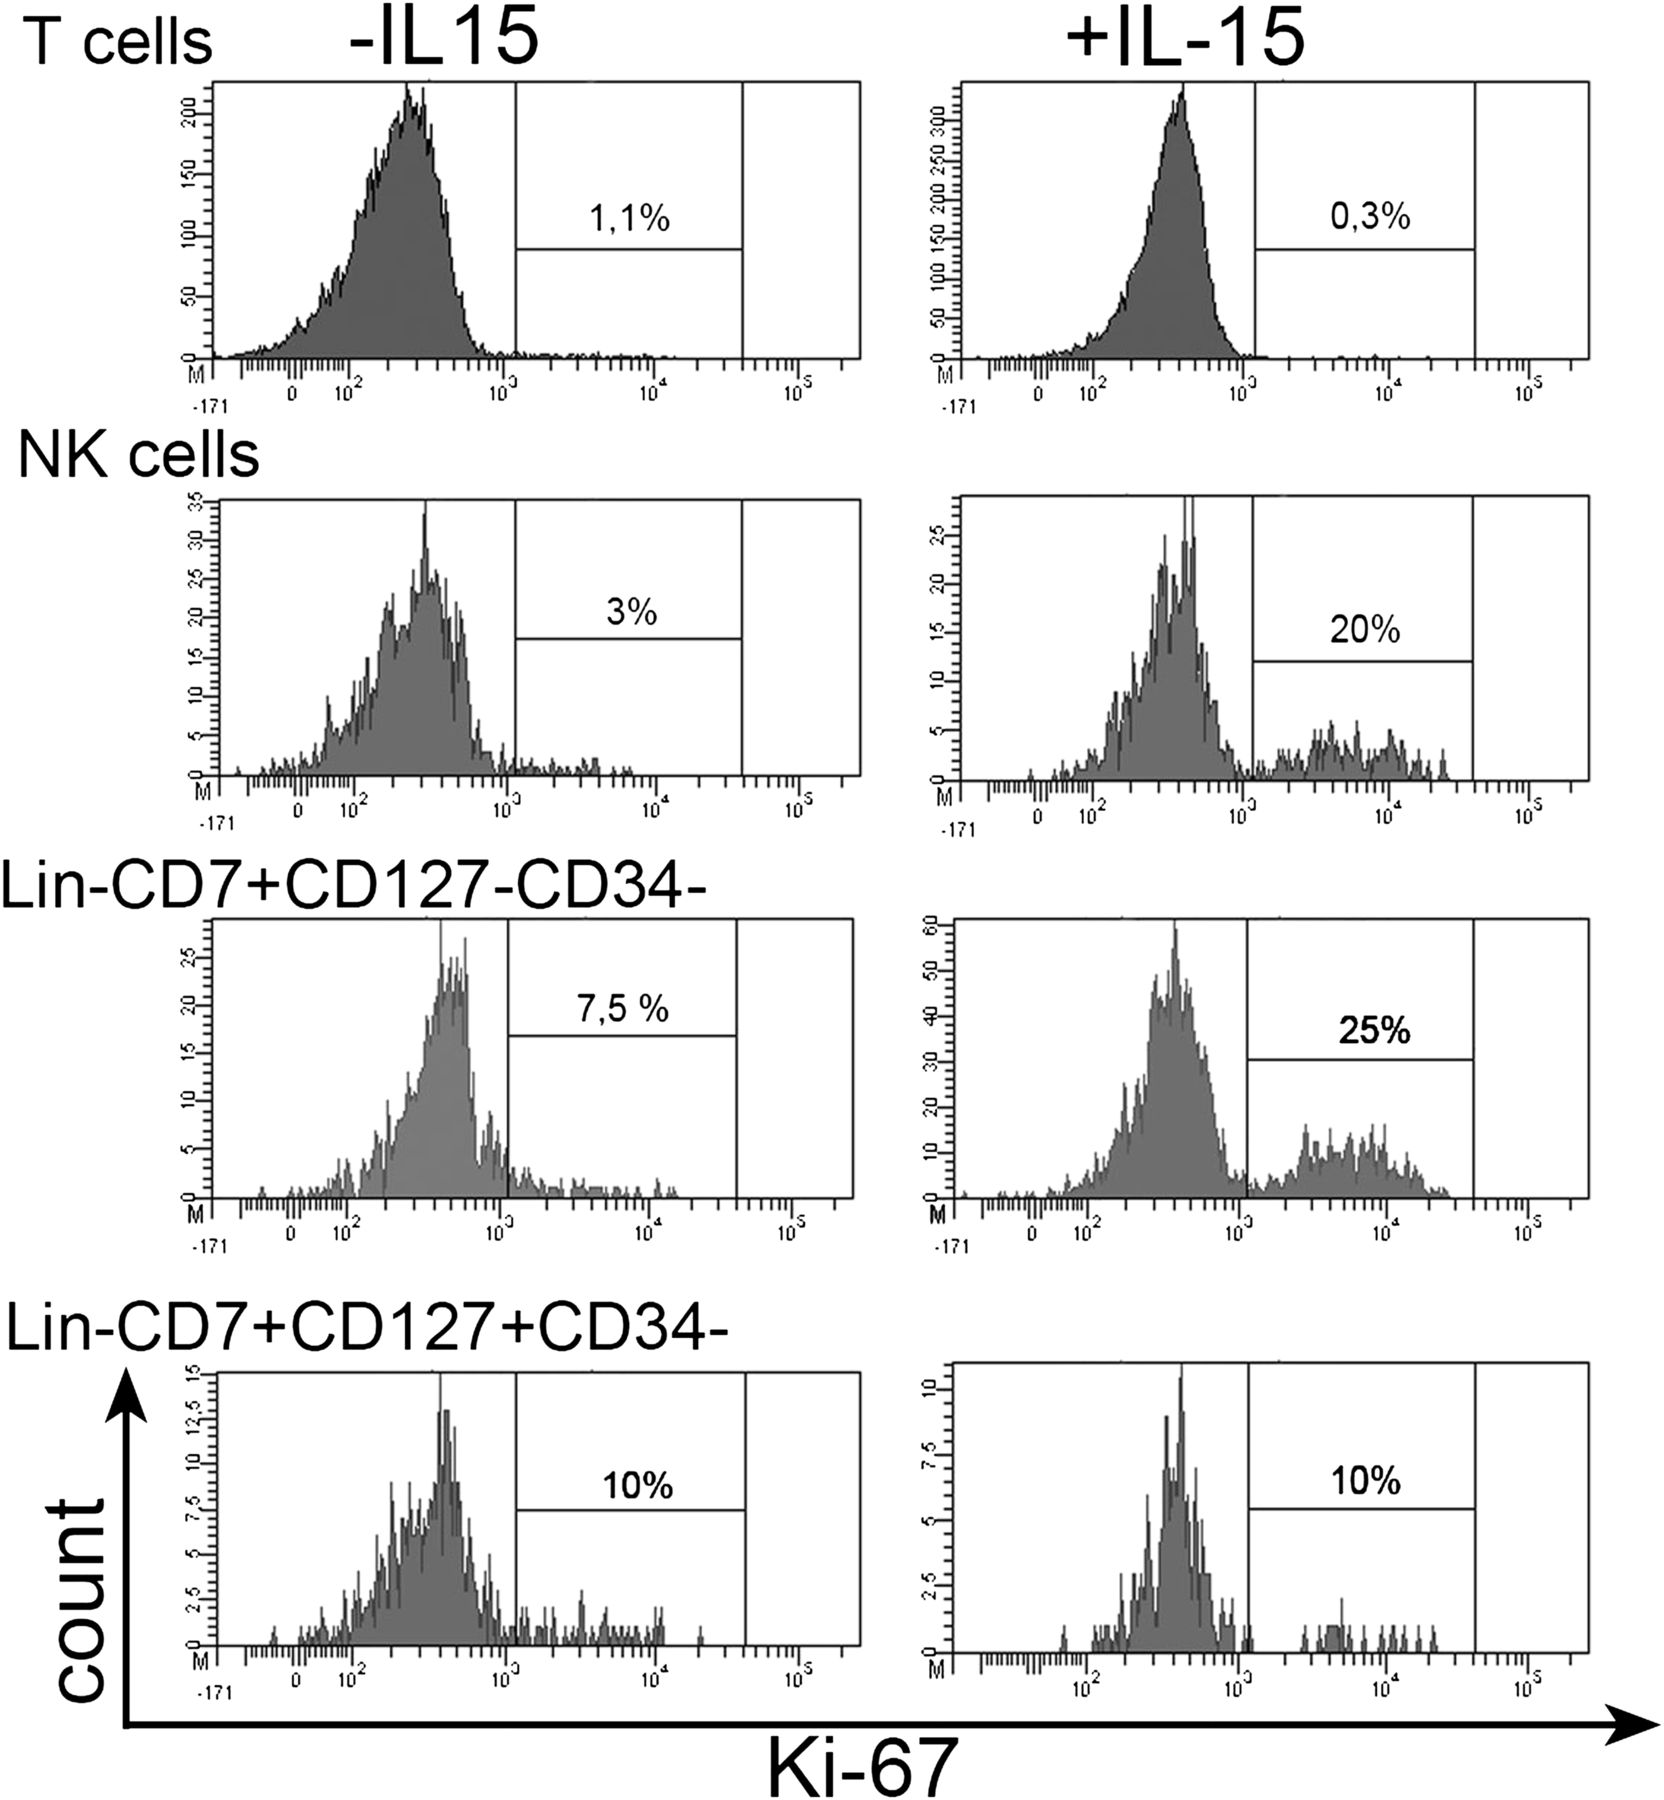
As Lin−CD7+CD127−CD34− IELs expressed the IL-2/15 receptor β chain (CD122) in the absence of the IL-2 receptor α chain (CD25, data not shown), they expressed a receptor for IL-15 but not a high-affinity IL-2 receptor. To test whether these cells were indeed IL-15 responsive, IELs released from paediatric non-celiac biopsies were incubated with IL-15 for 3 days. In the presence of IL-15, approximately 25% of Lin−CD7+CD127−CD34− IELs were positive for the nuclear proliferation marker Ki-67, compared with approximately 5% in the absence of IL-15 (figure 6). A similar picture was observed for the NK cells among the IELs (figure 6), which also expressed CD122 (figure 5). In contrast, no increase in Ki-67+ cell numbers was detectable for Lin−CD7+127+34− cells and CD3+T cells (figure 6), which did not express CD122 (figure 5). Together, these results indicate that duodenal Lin−CD7+CD127−CD34− IELs proliferate in response to IL-15 via the IL-2/15 receptor β chain.
Lin−CD7+CD127−CD34− IELs proliferate in response to IL-15. IELs released from the biopsy of a child without CD were incubated for 3 days with 10 ng/ml IL-15 and subsequently analysed by flow cytometry. Intracellular Ki-67 staining upon incubation in the absence (left) or presence (right) of IL-15 is shown for T cells (CD3+), NK cells (CD3−CD56+CD127+/−), Lin−CD7+CD127−CD34− cells and Lin−CD7+CD127+CD34− cells among IELs, gated as in figure 5. One experiment is shown, representative of two. IEL, intraepithelial lymphocyte; IL, interleukin; NK, natural killer.
Discussion
In this study we performed an in-depth analysis of aberrant RCDII lines isolated from biopsies of patients with RCDII to uncover the cellular origin of these aberrant cells. Compared with TCR+CD3+ IELs, these RCDII lines expressed more NK-cell-associated transcripts, including KIR. The RCDII lines lacked surface expression of lineage markers, as well as the expression of CD127 and CD34 (Lin−CD7+CD127−CD34− IELs), but highly expressed the IL-15/2Rβ chain (CD122). Cells with this phenotype were also found in duodenal biopsies of people without CD and in the healthy thymus, but were less frequent in ileal and colonic epithelium and undetectable in the fetal intestine.
Characteristic for aberrant cells in RCDII, Lin−CD7+CD127−CD34− IELs do not match any previously described physiological (non-pathological) IEL subset. In the duodenum of people without CD, particularly children, these cells constituted up to 30% of CD45+SSClow cells. Strikingly, these cells were 18-fold more frequent in children without CD compared with children with CD. This difference in numbers between people with CD and those without CD mirrors previous studies regarding the CD3−CD7+ population.12 ,13 Even after correction for the twofold to fourfold increase in total IEL numbers in active CD,39–42 absolute numbers of Lin−CD7+CD127−CD34− IELs remain reduced in children with CD compared with those without CD.
Lin−CD7+CD127−CD34− cells that expressed the gut-homing receptor CD10343 were also present in the human thymus. This may point to a thymic origin of these cells in the gastrointestinal epithelium. The low frequency of these cells in the ileum and colon compared with the duodenum suggests that the latter would be a preferential site for homing of such thymic emigrants. Strikingly, Lin−CD7+CD127−CD34− IELs were not detected in the fetal intestine. Therefore, if these cells in the duodenum are indeed of thymic origin, this suggests migration from the thymus later in life. Together, the data fit a scenario in which the frequencies of these intestinal cells peak when the thymus is highly active, that is, during the first postnatal decade.
Data from this study support and extend further studies focusing on the intestinal CD3−CD7+ cell population, which included immature T cells and NK cells.12–18 ,44 Using multicolour flow cytometry we could further define the different subpopulations in this heterogeneous CD3−CD7+ cell population. Additional markers such as icCD3, CD56, CD127 and CD34 proved that Lin−CD7+CD127−CD34− IELs are distinct from T cells, NK, LTi and early CD34+ precursor cells. It is tempting to speculate that the Lin−CD7+CD127−CD34− IELs represent intermediate NK/T-lymphocyte precursors that undergo extrathymic differentiation, as was shown for other intestinal IEL subsets.18 ,45–47
In fetal thymic organ cultures, a minority of the CD3−CD7 cells developed into T cells.14 In line with a pre T cell phenotype, RCDII cell lines P1, P2 and P4 (but not P3) contained partial TCR rearrangements.29 Lin−CD7+CD127−CD34− IELs may therefore be identical to the immature T cells contained within the CD3−CD7+ cell population. However, the RCDII lines and duodenal Lin−CD7+CD127−CD34− IELs in vivo expressed the IL-2/15 receptor β chain (CD122) which could be detected on CD3−CD7 cells in the epithelium,13 but is normally found on NK-cell but not T-cell precursors.33 Thus it will be important to test the ability of Lin−CD7+CD127−CD34− IELs to differentiate into T or NK cells in in vitro differentiation systems. This will be the subject of further investigation.
The presence of copious amounts of IL-15 in RCD is likely to contribute to the expansion and survival of (aberrant) IELs.3 ,9 ,38 In CD it induces NK programming of TCRαβ+CD8+ IELs.30 ,31 ,48 ,49 Lin−CD7+CD127−CD34− IELs, regardless of the disease status, expressed the IL-2/15 receptor β chain in the absence of the IL-2 receptor α chain. In line with this finding, in children without CD Lin−CD7+CD127−CD34− IELs proliferated in response to IL-15, providing a potential link between the upregulation of IL-15 and the outgrowth of cells with a Lin−CD7+CD127−CD34− phenotype.
Microarray analysis showed that, compared with regular T-IEL lines, the RCDII lines expressed lower levels of several T-cell-associated genes, but higher levels of NK-cell-associated genes. Notably, the RCDII lines each expressed a unique combination of KIR, normally expressed after the appearance of NKp46 (present on P3 only) and CD56 (present on a small fraction of P3 only) in NK-cell development or well after the completion of TCR rearrangements in T cells. It is therefore conceivable that IL-15, a critical cytokine in NK-cell development, induces the expansion and survival, and the acquisition of NK-cell receptors on aberrant IELs in RCDII.
Quantification of the CD3−CD7+icCD3+ population provides the basis for diagnosis of RCDII.6–8 ,37 Our results demonstrate that in people without CD, and in patients with CD, the CD3−CD7+icCD3 cells are heterogeneous and composed of four subsets based on the expression of CD127 and CD56, one of which displays the Lin−CD7+CD127−CD34− IEL phenotype. In patients with RCDII, CD56−CD127− and CD56−CD127+ subsets were observed, which fits the observation that lymphomas arising in patients with RCDII are usually CD56−.50 This diverse phenotype of CD3−CD7+icCD3+ cells in vivo, however, was mirrored in the RCDII cell lines, as a sizeable fraction of P4 expressed CD127 and a minor fraction of P3 expressed CD56. Proliferation and a (pre)malignant transformation of aberrant IELs in RCDII and EATL could therefore take place at different time points of cellular development, potentially ranging from pre T/NK cells to nearly mature T cells with near-complete TCR rearrangements.
In conclusion, our studies indicate that ‘aberrant’ IELs in RCDII may be derived from a preexistent Lin−CD7+CD127−CD34− IEL population present in the duodenum of people with and without CD.
Acknowledgments
We thank Drs C. Vilches, D. Pende and C. Retiere for providing KIR specific antibodies and R. Ruslan, R. Versteegh, K. van der Ploeg, S. de Boo, M. Romera Hernandez and H. Binh Nguyen for experimental support.
References
Supplementary materials
Supplementary Data
This web only file has been produced by the BMJ Publishing Group from an electronic file supplied by the author(s) and has not been edited for content.
Files in this Data Supplement:
- Data Supplement 1 - Online figure
Footnotes
FS and JMLT contributed equally to this manuscript, as did senior authors JvB and FK.
-
Funding This research received a specific grant from the Coeliac Disease Consortium (grant number: BSIK03009), Centre for Medical Systems Biology within the framework of the Netherlands Genomics Initiative/Netherlands Organization for Scientific Research and by the Dutch Digestive Disease Foundation (WO 06-21,0515), Landsteiner Foundation for Blood Transfusion Research, Innovational Research Incentives Scheme Vidi grant (grant number: 91710377).
-
Competing interests None.
-
Patient consent Obtained.
-
Ethics approval Local ethical guidelines of the VU Medical Center in Amsterdam (adult duodenal biopsies), the Leiden University Medical Center (paediatric duodenal biopsies), the Erasmus MC in Rotterdam (fetal intestine, thymuses) in accordance with the declaration of Helsinki.
-
Provenance and peer review Not commissioned; externally peer reviewed.
-
Data sharing statement The complete microarray data from this study are available via the GEO website: http://www.ncbi.nlm.nih.gov/geo/. The GEO series record is GSE33078.