Article Text

Abstract
Objective The microbiome contributes to the pathogenesis of inflammatory bowel disease (IBD) but the relative contribution of different lifestyle and environmental factors to the compositional variability of the gut microbiota is unclear.
Design Here, we rank the size effect of disease activity, medications, diet and geographic location of the faecal microbiota composition (16S rRNA gene sequencing) in patients with Crohn’s disease (CD; n=303), ulcerative colitis (UC; n = 228) and controls (n=161), followed longitudinally (at three time points with 16 weeks intervals).
Results Reduced microbiota diversity but increased variability was confirmed in CD and UC compared with controls. Significant compositional differences between diseases, particularly CD, and controls were evident. Longitudinal analyses revealed reduced temporal microbiota stability in IBD, particularly in patients with changes in disease activity. Machine learning separated disease from controls, and active from inactive disease, when consecutive time points were modelled. Geographic location accounted for most of the microbiota variance, second to the presence or absence of CD, followed by history of surgical resection, alcohol consumption and UC diagnosis, medications and diet with most (90.3%) of the compositional variance stochastic or unexplained.
Conclusion The popular concept of precision medicine and rational design of any therapeutic manipulation of the microbiota will have to contend not only with the heterogeneity of the host response, but also with widely differing lifestyles and with much variance still unaccounted for.
- Crohn's disease
- ulcerative colitis
- colonic microflora
- diet
Data availability statement
Data are available on reasonable request. All data relevant to the study are included in the article or uploaded as supplementary information. Sequence data are available at NCBI SRA PRJNA414072.
This is an open access article distributed in accordance with the Creative Commons Attribution Non Commercial (CC BY-NC 4.0) license, which permits others to distribute, remix, adapt, build upon this work non-commercially, and license their derivative works on different terms, provided the original work is properly cited, appropriate credit is given, any changes made indicated, and the use is non-commercial. See: http://creativecommons.org/licenses/by-nc/4.0/.
Statistics from Altmetric.com
Summary box
What is already known on this subject?
Gut microbiota diversity and stability is lower in patients with IBD.
Microbiota-based classification between disease and control has been successful, but not between active and inactive disease.
Differentially abundant microbes between these groups have also been identified, but these often differ between country of origin, study and methods.
What are the new findings?
We found temporal intra-individual microbiota changes indicative of disease activity.
Geographic location was a major determinant of microbiota variation, even though a majority of compositional variance remains unexplained.
How might it impact on clinical practice in the foreseeable future?
Ethnicity, diet, and geographical locations need to be considered in future microbiota studies with implications for the prospect of personalised therapeutics.
Furthermore, longitudinal sampling is important to leverage intra-individual variance for increasing potential diagnostic and prognostic power.
Introduction
Clinical and experimental research has linked the gut microbiota with the pathogenesis of Crohn’s disease (CD) and ulcerative colitis (UC).1–5 Reduced microbial diversity and other non-disease-specific changes in the microbiome, which probably reflect changes secondary to inflammation, have been reported by several investigators. In addition, some have recently reported apparent disease-specific changes.6–9 However, diet, medications, ethnicity, geography and a multitude of lifestyle or environmental variables may confound the interpretation and replication of microbiome studies. This is particularly problematic with small studies. Few large-scale longitudinal studies across stages of disease activity have been conducted,9-11 particularly with intercontinental comparisons. Therefore, we undertook a study over different time points of a large population of patients with CD and UC from two socioeconomically developed but geographically separated regions (Ireland and Canada), during periods of active (relapse) and inactive (remission) disease and ranked the contribution of variables to microbiota composition.
The results confirm microbiota compositional instability in patients with fluctuating disease activity, but show that geographic location (which may reflect ethnic and lifestyle differences) ranks higher in its contribution to microbiota variance than common variables such as prior surgical resection, age, gender and diet. However, the majority of the compositional variance remains unaccounted. The findings have implications for the prospect of personalised therapeutics based on microbial manipulation.
Methods
Study populations, sample and data collection
All patients had well-established diagnoses by conventional and investigative criteria.10 Patients were not invited to comment on the study design and were not consulted to develop patient-relevant outcomes or interpret the results. Patients were not invited to contribute to the writing or editing of this document for readability or accuracy. An active state of IBD was defined as a faecal calprotectin measurement of ≥250 µg/g.11 Patients from Cork, Ireland (n=283) and Manitoba, Canada (n=409), were sampled at three separate time points approximately 16 weeks apart (table 1). All subjects completed a Food Frequency Questionnaire (FFQ) to capture long-term dietary habits through frequencies of medium food servings of 157 items.12 13 The FFQ used in Ireland was adapted for the Canadian participants to reflect common food items consumed by the Canadian population.14 These frequencies were normalised to per month counts and were grouped into 30 broader food categories.
Subject characteristics and sample sizes for the Irish and the Canadian cohorts
Sample processing and sequencing
All samples were processed in a single laboratory in Cork using the same protocols. Irish subjects brought samples to a morning-time gastroenterology clinic which were promptly delivered to the microbiology laboratory and frozen at −80°C. Canadian samples were stored at −80°C, before shipment to Cork on dry ice. There were no inadvertent episodes of freeze-thawing. An experiment was conducted to investigate the time delay in transporting the Canadian samples (see ‘Results).
Aliquots of approximately 0.2 g were transferred into tubes with one 3.5 mm glass bead, 0.1 mL of 1.0 mm zirconia/silica beads and 0.1 mL of 0.1 mm glass beads (Biospec, Bartlesville, USA). QIAamp Fast DNA stool kit (Qiagen, Germany) was used for DNA extraction. First, 1 mL of InhibitEX buffer was added to the faecal samples, which were disrupted by bead-beating in a Mini-Beadbeater-24 (Biospec) for 30 s, thrice at maximum speed (3450 strokes/min). Samples were heated at 95°C for 5 min and subsequently processed according to the kit instructions resulting in genomic DNA eluted in 200 µL ATE buffer (10 mM Tris-Cl pH 8.3, 0.1 mM EDTA, 0.04% NaN3 (sodium-azide)). DNA concentrations were measured using a NanoDrop 2000 Spectrophotometer (Thermo Scientific, USA) and stored at −80°C until 16S rRNA gene amplicon sequencing library preparation. Library preparation was performed following Illumina (San Diego, USA) recommendations. Aliquots of 15 ng of extracted DNA were subjected to PCR amplification of the 16S rRNA V3-V4 hypervariable region in a total volume of 30 µL. Primers (forward: 5’-CCTACGGGNGGCWGCAG-3’, reverse: 5’-GACTACHVGGGTATCTAATCC-3’) were selected from Klindworth et al15 and Illumina adapters, containing overhang nucleotide sequences, were added to the gene-specific sequences.16 The PCR primers (Eurofins Genomics, Germany) at a concentration of 0.2 µM were used with the Phusion High-Fidelity DNA polymerase (Thermo Scientific, USA). PCR amplification was performed on a 2720 Thermal Cycler (Applied Biosystems, USA) at 98°C for 30 s, followed by 25 cycles of 98°C for 10 s, 55°C for 15 s, 72°C for 20 s and 72°C for 5 min. Post-PCR products of the amplified 16S rRNA gene band was verified in an agarose gel and purified using Agencourt AMPure XP magnetic beads (Beckman-Coulter, USA) and eluted in 50 µL of EB Buffer (Qiagen). After purification, 5 µL of DNA was amplified in a second PCR employing Nextera XT Index primer (Illumina) run at 98°C for 30 s, and followed by eight cycles of 98°C for 10 s, 55°C for 15 s, 72°C for 20 s and 72°C for 5 min, followed by a second purification step with Agencourt AMPure XP magnetic beads. The amplicons containing the Nextera indexes were finally eluted in 25 µL of EB Buffer and DNA concentration quantified using Qubit high-sensitivity double stranded DNA assay kit (Thermo Scientific). A randomised pooled library was created by adding 40 ng of each sample. Finally, a diluted sample of this library with a 30 nM concentration was sent for MiSeq sequencing (Illumina) to Eurofins Genomics.
An additional −80°C frozen aliquot containing approximately 0.5 g of faecal material was used to measure calprotectin concentration in an ImmunoCap 250 autoanalyser employing EliA Calprotectin Immunoassay V.2 (Phadia-Thermo Scientific, Sweden). The BÜHLMANN fCAL ELISA kit was deployed for faecal calprotectin measurement in the Canadian cohort. Results were expressed as μg/g faeces for both assays.
Bioinformatic analysis and statistics
First, ‘cutadapt’17 was used to remove the adapter sequences from the V3-V4 region of the 16S rRNA amplicon reads allowing for an error rate of 0.2. USEARCH (V.8.1.1861) script ‘fastq_merge’ was employed to merge forward and reverse reads. The QIIME script ‘split_libraries’ was used to demultiplex retaining reads with a minimum average PHRED quality of Q25 and a length of 390–465 bp. De novo clustering of operational taxonomic units (OTUs) was carried out using ‘cluster_otus’ in USEARCH, while chimaeras were removed using ‘uchime_ref’ with the ChimeraSlayer GOLD database.18 The Mothur implementation of the Ribosomal Database Project (RDP) classifier (V.11.4) was used to classify OTU taxonomy (phylum and genus) with a bootstrap cut-off of 80%, and all others assigned as unclassified at that particular rank.19 For species classification and Clostridium clusters, SPINGO (V.1.3)20 was performed against the RDP database (V.11.4) with similarity score of 0.5 and bootstrap cut-off of 0.8.21 Sequence data are available at NCBI SRA PRJNA414072.
All downstream analysis was performed in R V.3.6.0. Alpha and beta diversity was calculated using R package ‘phyloseq’ while plots were constructed in ‘ggplot2’. Differential taxa abundance was done using ‘MetagenomeSeq’ (V.1.26.3), while differences in diet consumption were calculated using Wilcoxon tests. Heatplots were constructed using the ‘made4’ library with Spearman’s correlations combined with hierarchical Ward-clustering. Hierarchical clusters were cut using ‘dynamicTreeCut’ with a minimum cluster size of 75 samples and tested with Fisher’s tests for the categorical data and the Wilcoxon tests for quantitative data. Spearman’s correlations were used to assess correlations between food groups/taxa/metadata and principal coordinates analysis (PCoA)/principal component analysis (PCA) axes. Adonis from the ‘vegan’ library based on Bray-Curtis dissimilarity was performed to investigate and rank the effect of 14 environmental factors including medications on overall microbial composition. The FFQ data were condensed into one factor, the Healthy Food Diversity (HFD) Index, as previously described,22 using individual food items. For the different therapies and disease activities, the variance was adjusted for IBD group to quantify effects between active/inactive and treated/untreated, rather than the effect of healthy/IBD sufferer. Cumulative explained variance was calculated in a greedy stepwise approach, whereby environmental factors contributing with the highest R2 value (p<0.1) were iteratively added to the model in the previous iteration. To distinguish between health/disease and active/inactive disease, gradient boosted trees models were generated via ‘xgboost’ based on either proportional normalised OTUs present in at least 5% of the samples, or ratios between these OTUs of two time points from patients with non-changing disease states. Optimal model parameters were determined with bootstrapping of 1000 iterations and fivefold cross-validations. For each binary classification, n leave-one-out models were generated to predict the class of the nth sample. OTU importance was determined by the gain an OTU added to a model and the frequency with which each OTU was used for a model. Performance of each classification was measured by area under the receiver operating characteristics. P values were adjusted for multiple testing where appropriate, using the Benjamini and Hochberg method.23
Results
Microbial composition in IBD differs from that of controls
We collected 1815 stool samples from 303 patients with CD, 228 patients with UC and 161 healthy controls from the regions of Manitoba, Canada (59% of subjects) and Cork, Ireland. The samples were longitudinally collected from subjects who were either in relapse (active; 34% of 1515 IBD samples) or in remission (inactive) with time intervals of on average 16 weeks (95% CI: 15.6 to 17.0). See table 1 for subject characteristics.
The 16S rRNA V3-V4 region of all samples were amplified, sequenced and subjected to quality and chimaera filtering in Cork, resulting in a mean of 21 647 (95% CI: 21 298 to 21 996) usable reads per sample. These were clustered into 3148 OTUs with ≥97% identity and analysed further. To ensure that the time lag in mailing the Canadian samples to Cork did not confound microbiota results, we analysed four fresh samples stored in duplicates for up to 7 days at room temperature. There was no significant difference between time points in terms of microbiota alpha diversity, nor was any OTU differentially abundant between samples processed at different time points (online supplementary figure 1).
Supplemental material
Beta diversity analysis based on Bray-Curtis distances (figure 1A) showed a significant disease-associated shift along Principal components (PCs) 1 and 2, with CD samples located furthest from healthy controls, followed by UC. Samples from patients with active disease were further from controls than those from patients in remission (inactive) for both UC along PC1 (p<0.013) and CD along PC2 (p<0.012).
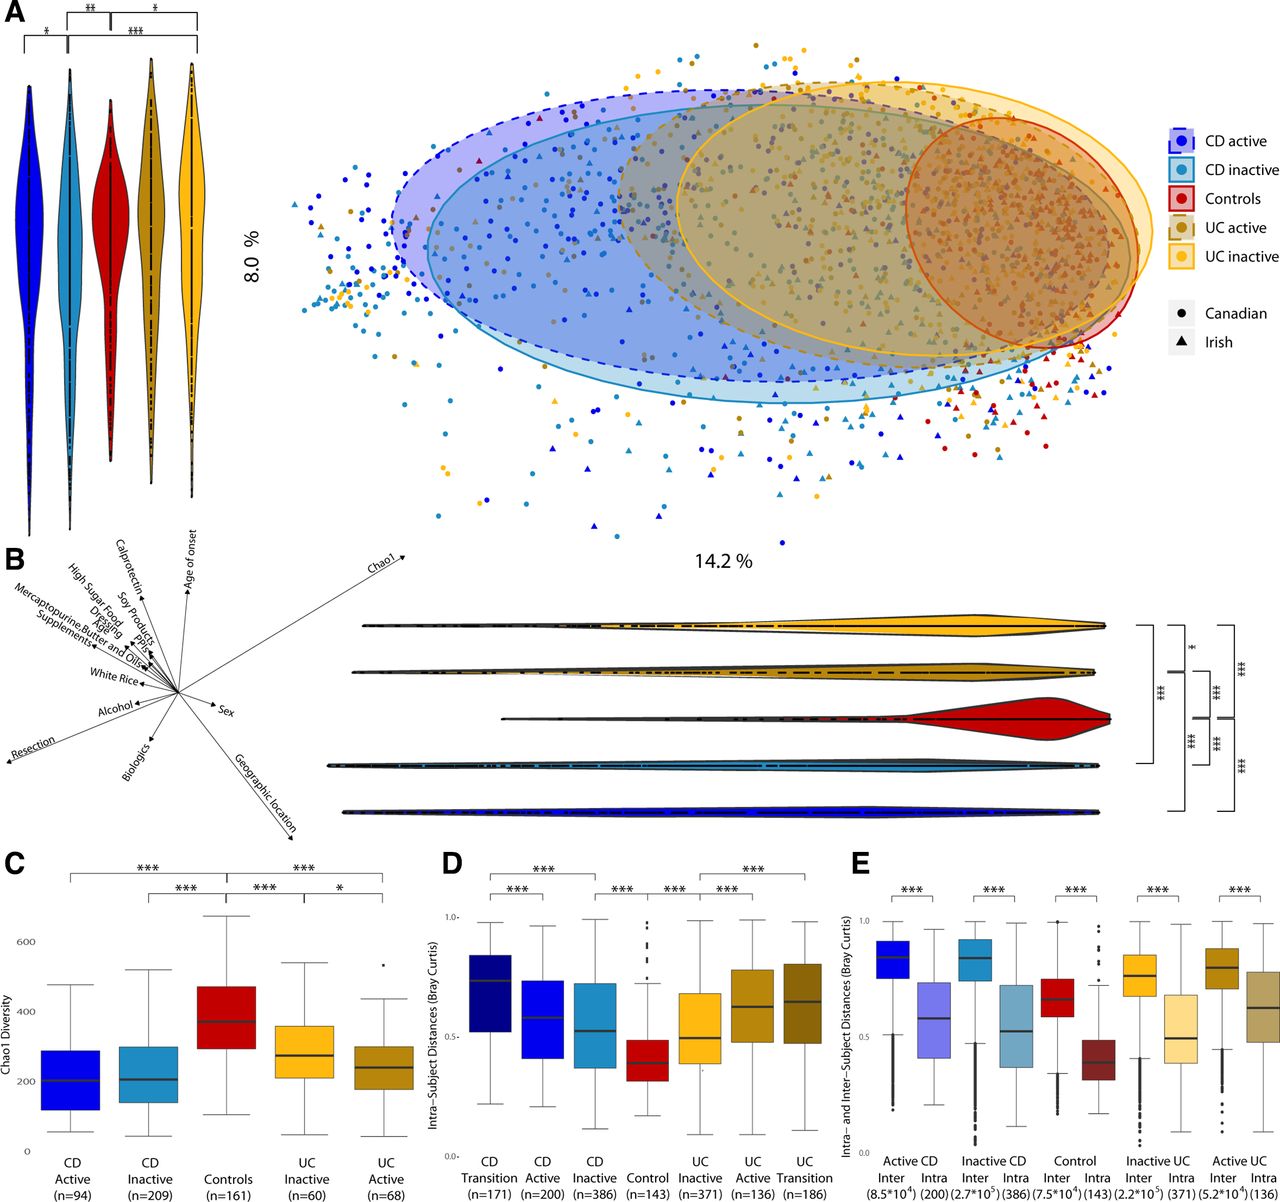
Microbiota composition and diversity in Crohn’s disease (CD), ulcerative colitis (UC) and control subjects. (a) Principal coordinates analysis (PCoA) based on Bray-Curtis distances with proportional normalisation on all operational taxonomic units (OTUs) present in >5% of samples, with samples grouped by disease and activity state. Violin plots show projections of PCoA points into PC1 and PC2. (b) Spearman’s correlations between PC axes and food groups/metadata and alpha diversity. Only categories with significant correlations are represented. The direction and length of the arrows indicate the direction and strength of the correlation. (c) Comparison of Chao1 alpha diversity for disease type and status of patients with IBD vs healthy controls.(d) Comparison of distances between time points from the same subject based on intra-individual Bray-Curtis distances. (e) Comparison of intra-individual and inter-individual Bray-Curtis distances. *p<0.05; **p<0.01; ***p<0.001.
Several food groups and other metadata (discussed later) were significantly correlated to PC1 and/or PC2 axes and, thus, associated with the overall variation in microbiota composition (figure 1B; online supplementary table 1). Among the strongest correlates were geographic location, resection, age of onset and food supplements. However, the overall strongest correlation was for alpha diversity, which was lower in patients with IBD. Irrespective of correlations with beta diversities, alpha diversity was significantly lower in patients with CD and UC compared with controls (figure 1C; online supplementary table 2), and also in active versus inactive UC. For individual subjects (pairwise version of figure 1C), active UC showed significantly lower alpha diversity than the corresponding inactive sample from the same subject (online supplementary figure 2).
Supplemental material
Species associated with disease
The OTUs were classified to species level and filtered down to 200 species present in at least 5% of the samples in order to remove outlier taxa with low prevalence. MetagenomeSeq analysis showed a greater number of species with significantly higher abundance in disease compared with controls. Of these, 68 were significantly decreased and 35 significantly increased in CD relative to controls. Similarly, 60 species were significantly decreased, and 27 species were increased in UC compared with controls (figure 2; online supplementary tables 3–5). The most significantly increased species in CD compared with controls were Ruminococcus gnavus and Eggerthella lenta. In contrast, several Eubacteria (E. eligens and E. rectale) and Faecalibacterium prausnitzii species were decreased in CD when compared with controls. E. lenta was also increased in UC versus controls along with Holdemania filiformis and Clostridium innocuum, whereas E. eligens and Clostridium aminobutyricum were decreased in UC relative to controls. There were no significant differences between active and inactive CD, or active and inactive UC.

Differential species abundances (volcano plots) between disease groups and disease state. Points above the horizontal line are significant while the X-axis position of each point indicates the direction of fold change. The size of each point refers to the abundance of the species across the cohort while the colour indicates the family rank. CD, Crohn’s disease;UC, ulcerative colitis.
A microbial signature for CD has been suggested using a Boolean algorithm on eight differentially abundant taxa resulting in accuracies between 64%–82% and 77%–85% to distinguish patients against UC and healthy controls, respectively.7 Applying the same algorithm and genera to our dataset generated lower accuracies of 61% (UC vs CD) and 68% (control vs CD). A more powerful approach, particularly for heterogeneous datasets,24 is the Machine Learning technique Extreme Gradient Boosting. With this method, we observed an area under the curve (AUC) of 0.88 (84% accuracy) for CD versus control, and 0.88 (83% accuracy) for UC versus control, with E. rectale and Clostridium cluster XIVa being the most important discriminatory OTUs in both diseases, respectively (figure 3; online supplementary table 6). The AUC for CD versus UC was, however, much lower (0.67; 64% accuracy). Repeating the classification within each location only marginally changed the AUCs (figure 3), whereas intercontinental cross-validation reduced AUCs somewhat with an average of 0.071 (online supplementary figure 3; online supplementary table 7). Curiously, classifying disease activity was only possible by using longitudinal within-subject change between two consecutive time points as ratios of each OTU, as opposed to OTUs from a single time point. With the former method, we obtained higher AUCs of 0.81 (81% accuracy; Hydrogenoanaerobacterium saccharovorans most important) for CD, 0.73 (85%; Bifidobacterium) for UC and 0.91 (89% accuracy; Anaerostipes hadrus) for patients combined (figure 4; online supplementary table 8).
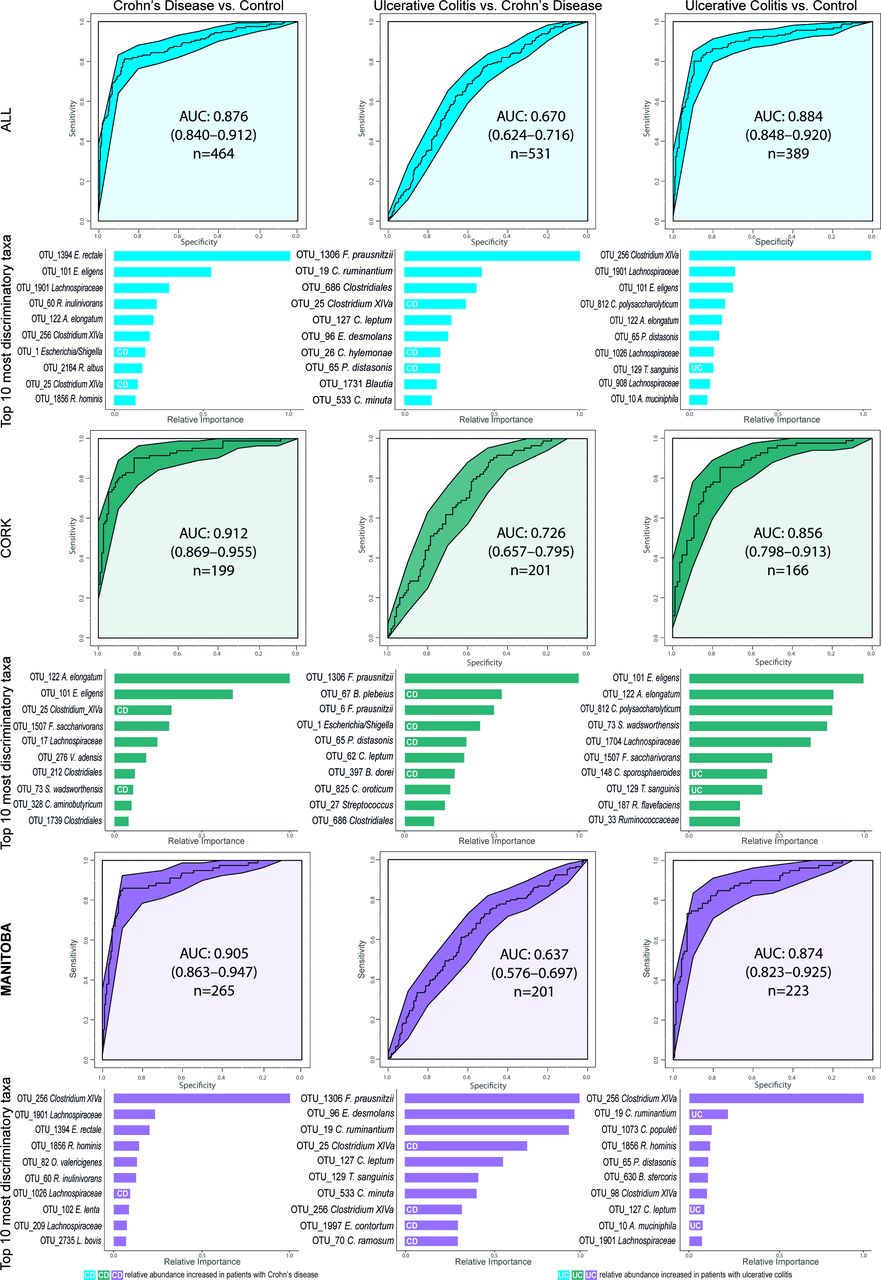
Machine learning classification of the subject cohorts, first combined and then separated by geographic location. Receiver operating characteristic curves (ROC) for the boosted tree models on the bases of proportional normalised operational taxonomic units (OTUs) present in >5% of samples. Below each ROC curve, variable importance plots show the relative importance for the 10 OTUs with the highest gain for each comparison alongside their highest known classification. The white UC and CD labels within the bars indicate which OTUs are increased in their respective patient group, bars without mark indicate that their respective taxon is increased in the other class of the model. A model with an area under the curve (AUC) of 0.5 has no discriminatory capacity, whereas an AUC of 1 indicates perfect separation of the response variables.

Single and dual time-point machine learning classification of disease activity for patients with Crohn’s disease (CD) and ulcerative colitis (UC) separately and combined cohorts based on proportional normalised operational taxonomic units (OTUs) present in >5% of samples. The receiver operating characteristics (ROC) curves for the boosted tree models on the second row were generated based on the ratio of each OTU between two consecutive time points. Only subjects that did not transition between disease states were included, Canadian and Irish combined. Below each ROC curve are variable importance displayed indicating the relative importance for the 10 OTUs with the highest gain for each model.
Hierarchical clustering reveals groups dominated by prevalent species
In view of the heterogeneity of UC and CD, we assessed potential stratification based on microbiota composition. Hierarchical clustering revealed 10 subgroups (clusters) based on their proportional species composition, with several clusters dominated by particular species (figure 5). Clusters ranging in size between 79 and 328 samples were often distinguished by varying relative family abundances. Among these, clusters 7–10 had significantly more (mainly Canadian) patients with IBD than the other clusters. Cluster 1 (Bacteroides vulgatus), cluster 7 (Escherichia/Shigella) and cluster 8 (Akkermansia muciniphila for 1/3 of subjects) contained significantly more subjects postresection, while clusters 1, 2 (Prevotella copri) and 10 had more subjects taking biologics (antitumour necrosis factor) (online supplementary figure 4; online supplementary table 9).

Hierarchical clustering of stool microbiota. Heatplot of operational taxonomic units (OTUs) classified at species level with Spearman’s correlations and ward-linkage clustering. The vertical colour bar represents the family of each species. The samples were divided into 10 clusters (tertiary horizontal colour bar) using dynamicTreeCut. The first horizontal colour bar indicates the disease and status of each sample, the second horizontal bar shows samples of the same patient that clustered adjacent to each other. The species names on the right of the plot, along with the cluster number, are the drivers of the clustering. The bar chart shows the taxonomic composition at family level of each sample ordered by phylum. The principal coordinates analysis (PCoA) at the bottom is the same as figure 1 but labelled by the 10 clusters. CD, Crohn’s disease; UC, ulcerative colitis.
Temporal stability
Temporal stability was assessed by comparing within-subject Bray-Curtis distances across multiple time points. Patients with CD or UC had significantly greater within-subject differences (reduced microbiota stability) compared with controls (figure 1D; online supplementary table 10). In addition, we observed significantly higher within-subject transitional microbiota differences in samples taken across different activity stages for both CD and UC, than in samples from patients whose disease activity did not change. Inter-individual differences were also substantially larger than intra-individual differences for all cohorts (figure 1E).
We further investigated temporal stability by testing whether samples from the same subject had a higher tendency to be adjacent to each other in the hierarchical tree clustering (figure 5). Of all samples in this tree, 36% were closest to samples from the same subject. In support of the temporal observations above (figure 1D; online supplementary table 11), samples from the same (either CD or UC) subject, but with transitioning activity states, were less likely to be next to each other than with a sample with non-changing activity state. Samples from the same control subjects were more likely to be next to each other than samples for patients with CD or UC.
Age, diet and geography affect the microbiota
Separating the beta diversity PCoA into the two geographical locations (online supplementary figure 5) showed that CD microbiota from Manitoba subjects were to a higher degree responsible for the horizontal shift observed in figure 1A and online supplementary figure 6, primarily attributed to resection (see next section). There were otherwise no major differences between disease, activity and control cohorts across the two locations. The alpha diversity for Cork controls and UC inactive subjects was significantly increased compared with the Manitoba cohort (online supplementary figure 7). As the latter cohort were older than the Cork cohort (table 1), we adjusted for geographical location, but still found the same two Cork cohorts having significantly higher alpha diversities than the corresponding Manitoba cohorts. Age was also negatively correlated with alpha diversity for Cork inactive and Manitoba active CD cohorts (online supplementary figure 8a). We observed significant shifts in microbiota composition between the two locations along both principal components also for separate cohorts (online supplementary figure 6). Thus, a number of species were significantly different between the two locations with 68 species for CD (13 active, 51 inactive), 57 for UC (13 active, 27 inactive) and 20 different between the control groups (online supplementary figure 9; online supplementary tables 12–18). The carbohydrate fermenting Clostridium leptum was the most significantly abundant species in Manitoba subjects for both CD and UC compared with Cork, overall and for inactive states.
Several food groups (high sugar foods, brown pasta, poultry, red meats, alcohol and brown bread) were significantly correlated with overall microbiota composition, as illustrated by correlations to the two PC axes in figure 1B (online supplementary table 1). Across both geographical locations, consumption of high sugar foods, nuts, butter and oils were increased in subjects with IBD, while controls consumed more fruit, vegetables, high-fibre and breakfast cereals, sauces and alcohol (figure 1b; online supplementary table 19). Additionally, 20 food groups were consumed differently between the population cohorts (online supplementary figure 10) with potatoes, beans, white bread, processed meats, sauces and breakfast cereals significantly increased in the Cork cohort, while among others vegetables, high-sugar foods, nuts, pasta and rice were increased in the Manitoba group.
We found microbiota diversity to be positively correlated with the HFD Index for all cohorts combined and for Manitoba UC inactive (online supplementary figure 8b). Unexpectedly, microbiota diversity in patients with inactive UC in Cork was negatively correlated with the HFD Index, in contrast to their Canadian counterparts. A microbiota-independent PCA based on the 157 food items showed that the long-term dietary habits of patients with CD and UC were somewhat different from controls with a significant shift away from controls along PC2 (figure 6A). The main drivers of this shift were brown pasta/rice and dressing (higher in controls) and butter and oils (higher in IBD) (figure 6B; online supplementary table 20).
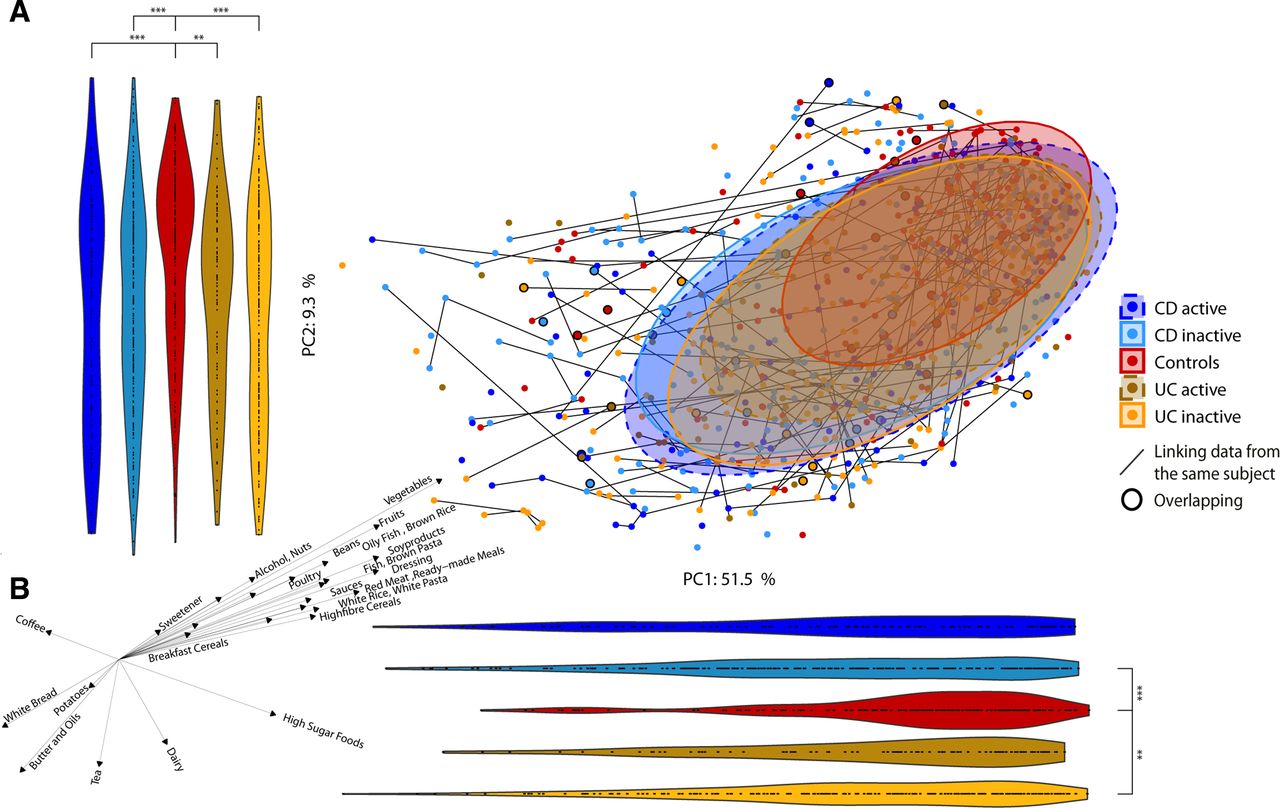
Food composition in Crohn’s disease (CD), ulcerative colitis (UC) and control subjects. (a) Principal component analysis (PCA) of the food groups coloured by disease and disease status. Violin plots represent the points in the PCA projected to the principal component (PC)1 and PC2 axes to assess shifts in the groups. Patients with greater than one identical questionnaire are indicated by black circles. (b) Spearman’s correlations between PC axis of PCA and food groups/metadata. Only features with significant correlations are represented. The direction and length of the arrows indicate the direction and strength of the correlation. *p<0.05; **p<0.01; ***p<0.001.
Medications and bowel resection associated with a changing microbiota
Both microbiota diversity and composition were significantly associated with bowel resection and the use of some medications. Resected subjects had lower alpha diversity than non-resected subjects and controls (online supplementary figure 11), and also showed a significant shift in beta diversity away from non-resected subjects and from healthy controls (online supplementary figure 12). Resection was a treatment primarily within our CD cohorts; thus, when comparing these subjects it became evident that resection in Manitoba had a particularly marked effect on the microbiota composition (online supplementary figure 13). The significant shifts along PC2 away from controls and non-resected subjects had the same directions for both countries, but was much more pronounced for Manitoba.
There were up to 63 species differentially abundant (online supplementary tables 21–25) between any of these resection/non-resection groups, including F. prausnitzii and C. leptum being increased in non-resected subjects, and Blautia producta, Bacteroides fragilis and R. gnavus being increased in resected subjects.
Subjects on proton pump inhibitors (PPIs) medication were located further away from controls than non-users and had also significantly lower alpha diversity (online supplementary figure 11; online supplementary table 26). Two out of 10 significantly increased species in PPI users belonged to the Streptococcus genus (S. agalactiae and S. mutans). The only medicated subjects with microbiota composition closer to controls (higher PC1 values) were those taking 5-aminosalicylates (online supplementary figure 12). Similarly, alpha diversity (online supplementary figure 11) was significantly higher for patients on 5-aminosalicylates, and controls, compared with those who were not. However, these changes were not attributable to any particular species.
Finally, we tested how much microbiota variance (beta diversity) was explained by the 25 environmental factors for 650 subjects at one randomly selected time point (figure 7). Presence or absence of a CD diagnosis had the greatest impact on the microbiota, followed by geographic location, previous surgical resection, alcohol consumption and UC diagnosis. Diet (summarised in the HFD Index), anthropometrics and medications also explained some variation in the microbial composition. The reason why smoking and disease activity showed non-significance may be due to the relatively small and uneven sizes of these groups (table 1). It should, however, be noted that when combined, these factors explain <9.7% of the total microbiota variance.

Factors explaining microbiota variance. Association between 25 tested environmental factors and the microbiota beta diversity of n=650 individuals (291 Crohn’s disease (CD), 236 ulcerative colitis (UC), 120 controls; one randomly chosen time point per subject) at operational taxonomic unit (OTU) level in terms of explained fraction of the variance in Bray-Curtis dissimilarity. Of available 692 subjects, 42 were excluded due to missing values in the metadata. Adjusted permutational multivariate analysis of variance p values: *p<0.05; **p<0.01; ***p<0.001. 5-ASA, 5-aminosalicylic acid; NSAID, non-steroidal anti-inflammatory drug; NS, not significant.
Discussion
The relationship between microbiota and pathogenesis of IBD is well established, but there is limited information to rank the influence of known variables on microbiota composition, including longitudinal follow-up at different phases of disease activity. Our results show that disturbances in faecal microbial composition are most marked in active disease, particularly in CD. The longitudinal study design allowed for microbiota dynamics to be investigated, showing that inter-individual variance was greater than intra-individual, and that the microbiota was more unstable in CD and UC compared with controls. This is consistent with earlier reports of smaller cohorts.9 25 26 The greatest changes in microbiota composition were linked with transitions across active and inactive phases of disease. The importance of longitudinal sampling became even more apparent with machine learning models capable of separating active and inactive disease, even though specific taxa were not linked with different activity states. This was only possible when using intra-individual ratios of each OTU between two consecutive time points, but not when using OTUs from single time points. Biologically, this is intuitively obvious since inflammation and other disease-related factors (such as medications to treat inflammation, antibiotic use, surgery, etc) are more likely to lead to microbiota variability in patients with IBD than in controls. Thus, frequent and long-term sampling might permit an improved classification, and potentially relapse-predicting, models.27
As expected, faecal microbiota alpha diversity was reduced in both CD and UC, but in contrast to microbiota composition, diversity did not vary significantly with disease activity. Of the microbial species found to be significantly increased in CD compared with controls, we concur with previous reports for R. gnavus28 29 and Fusobacterium nucleatum,30 although the opposite has also been reported for the former species.30 We found decreased abundance in CD for Ruminococcus albus, E. rectale and F. prausnitzii compared with controls, in agreement with previous studies30 31 and meta-analysis.32 Eubacterium and Roseburia species were among the most important taxa for classifying CD and UC compared with controls.
Some species were particularly prominent in certain subgroups of patients. For example, clusters associated with B. vulgatus, A. muciniphila and Escherichia/Shigella were prominent in patients with prior surgical resections, which has also been noted by others.33 It has been proposed that reduced stool pH with 5-aminosalicylate might account for blooms of Bifidobacteria and Lactobacilli, theoretically reducing mucosal inflammation and minimising alterations in the microbiota.34 Patients receiving 5-aminosalicylic acid drugs may also have a microbiota closer to that of controls because of milder disease than those requiring biologics.
Significant associations between compositional changes and habitual diet were observed and which are consistent with reports of dietary constituents as potential risk factors for IBD.35 Remarkably, about 90% of the microbiota variance in IBD remains unaccounted for, either not measured or due to stochastic factors. This is higher than what was previously observed (84%) in a large Belgian-Dutch cohort,36 where UC had a relatively small effect on overall variance. Geographic location (which may reflect variance in lifestyle, diet and ethnicity) had the second greatest non-disease-related influence in our cohort and was recently shown to have significant impact among infants.37 Although similar trends were evident in both geographic locations studied by us, the work of others has highlighted ethnicity38 and geographic location39 as important considerations for studies of the microbiota. This might also contribute to some of the inconsistency in microbiota studies of IBD. Regardless, both microbiota and host heterogeneity, which may be interdependent, will represent a challenge for the prospect of personalised prognostics or therapeutics based on microbiota manipulation.
Data availability statement
Data are available on reasonable request. All data relevant to the study are included in the article or uploaded as supplementary information. Sequence data are available at NCBI SRA PRJNA414072.
Ethics statements
Ethics approval
This study was approved by the Cork hospitals’ research ethics committee and the University of Manitoba Health Research Board.
Acknowledgments
The authors would like to thank research nurses Margot Hurley and Catherine O’Riordan for their assistance.
References
Supplementary materials
Supplementary Data
This web only file has been produced by the BMJ Publishing Group from an electronic file supplied by the author(s) and has not been edited for content.
Footnotes
Twitter @ClaessonLab
AGC and JE contributed equally.
Contributors MJC, FS, LT and CNB designed and managed the project; AGC, JE and EL-M performed the analyses; FS, CNB, CM and DS provided clinical samples and expertise; AGC, JE, MJC and FS wrote the manuscript; MJC, RDS and FS secured funding. KAS and MTB created and managed the database for Canadian subjects, KV administered the FFQ to Canadian subjects, MS handled the stool samples and measured fCAL in Canadian subjects. AGC and JE contributed equally.
Funding This research was supported in part by Science Foundation Ireland (grant numbers SFI/12/RC/2273, 11/SIRG/B2162 and 17/CDA/4765) and European Crohn’s and Colitis Organisation (year 2014).
Disclaimer FS is a co-founder of Alimentary Health, Tucana Health (now 4D pharma Cork) and Atlantia Food Clinical Trials. MJC is a co-founder of SeqBiome.
Competing interests MTB reports grants and personal fees from AbbVie Canada, grants and personal fees from Janssen Canada, grants and personal fees from Pfizer Canada, grants from Shire Canada, grants and personal fees from Takeda Canada, personal fees from Mylan Pharmaceuticals, other from AbbVie, Janssen, Pfizer, Boerhinger Ingelheim, Celgene, outside the submitted work; FS reports other from Alimentary Health/Precision Biotics, other from 4D pharma, Cork, other from Atlantia Food Clinical Trials, personal fees from Kaleido Biosciences, outside the submitted work; MJC reports personal fees from Mars PetCare, other from Second Genome, outside the submitted work.
Patient and public involvement Patients and/or the public were not involved in the design, conduct, reporting or dissemination plans of this research.
Provenance and peer review Not commissioned; externally peer reviewed.