Article Text

Abstract
Background: Current understanding of T cell epitopes in coeliac disease (CD) largely derives from intestinal T cell clones in vitro. T cell clones allow identification of gluten peptides that stimulate T cells but do not quantify their contribution to the overall gluten specific T cell response in individuals with CD when exposed to gluten in vivo.
Aims: To determine the contribution of a putative dominant T cell epitope to the overall gliadin T cell response in HLA-DQ2 CD in vivo.
Patients: HLA-DQ2+ individuals with CD and healthy controls.
Methods: Subjects consumed 20 g of gluten daily for three days. Interferon γ (IFN-γ) ELISPOT was performed using peripheral blood mononuclear cells (PBMC) to enumerate and characterise peptide and gliadin specific T cells before and after gluten challenge.
Results: In 50/59 CD subjects, irrespective of homo- or heterozygosity for HLA-DQ2, IFN-γ ELISPOT responses for an optimal concentration of A-gliadin 57–73 Q-E65 were between 10 and 1500 per million PBMC, equivalent to a median 51% of the response for a “near optimal” concentration of deamidated gliadin. Whole deamidated gliadin and gliadin epitope specific T cells induced in peripheral blood expressed an intestinal homing integrin (α4β7) and were HLA-DQ2 restricted. Peripheral blood T cells specific for A-gliadin 57–73 Q-E65 are rare in untreated CD but can be predictably induced two weeks after gluten exclusion.
Conclusion: In vivo gluten challenge is a simple safe method that allows relevant T cells to be analysed and quantified in peripheral blood by ELISPOT, and should permit comprehensive high throughput mapping of gluten T cell epitopes in large numbers of individuals with CD.
- CD, coeliac disease
- IFN-γ, interferon γ
- IL, interleukin
- GFD, gluten free diet
- PBMC, peripheral blood mononuclear cells
- tTG, tissue transglutaminase
- EMA, endomysial antibodies
- PPD, purified protein derivative of Mycobacterium bovis
- SFU, spot forming units
- coeliac disease
- T cell epitopes
- gluten
- interferon γ
- ELISPOT
- antigen challenge
Statistics from Altmetric.com
- CD, coeliac disease
- IFN-γ, interferon γ
- IL, interleukin
- GFD, gluten free diet
- PBMC, peripheral blood mononuclear cells
- tTG, tissue transglutaminase
- EMA, endomysial antibodies
- PPD, purified protein derivative of Mycobacterium bovis
- SFU, spot forming units
Gluten specific HLA DQ2 and DQ8 restricted CD4 T cells are central to the pathogenesis of coeliac disease (CD). Understanding the specificity (epitopes) of T cells and their consistency between individuals in vivo is critical for the development of alternatives to current diagnostics and dietary treatment.
To best reflect their in vivo specificity, frequency, and behaviour, freshly isolated primary T cells in culture for less than one day are ideal as longer term culture leads to the potential for proliferation of naïve T cells and alteration in T cell phenotype and function.1–3 Secretion of cytokines, such as those abundantly expressed in the inflamed small intestinal mucosa in CD (interferon γ (IFN-γ) and interleukin 4 (IL-4)),4 is characteristic of effector and memory T cells.1,3 In contrast, naïve T cells secrete abundant IL-2 and only with successive days in culture do they acquire the ability to secrete IFN-γ and IL-4.3 However, in almost all chronic immune mediated diseases, the frequencies of “relevant” antigen specific CD4 T cells in peripheral blood are close to or several orders of magnitude below the levels of detection for most short term assays, including cytokine ELISA, intracellular cytokine staining, or staining by peptide MHC multimers using FACS analysis.1,5,6
In CD research, T cells cultured and expanded in the presence of gluten proteins in vitro over several weeks (polyclonal “T cell lines”) and then isolated after further in vitro culture as homogeneous (monoclonal) “T cell clones” with a single T cell receptor have been typical.6,7,8,9,10,11,12,13,14,15,16,17,18,19 Whether T cell lines and clones are informative regarding in vivo T cell specificity is determined by whether they are derived from T cells that previously encountered gluten in vivo (memory) rather than naïve T cells, and whether antigen presentation in vitro reflects in vivo processes. In CD, such experiments are further complicated by gluten being partially digested in the gut20 and then deamidated by mucosal tissue transglutaminase (tTG) before recognition by T cells.13
That most gliadin specific T cell clones from peripheral blood of healthy10 and CD9 individuals are not HLA DQ2 restricted and not specific for deamidated gliadin,13 while nearly all CD intestinal biopsy derived T cell clones specific for gliadin are HLA-DQ2 or DQ8 restricted7,8 and specific for deamidated gliadin,13 has led to the view that studies of peripheral blood T cells in CD are not informative.13
This assessment may be true for T cell clones isolated in vitro, but six days after eating gluten polyclonal effector T cells specific for gluten appear in the peripheral blood of CD subjects normally following a gluten free diet (GFD).21 Presumably gluten specific T cells are present in peripheral blood due to antigen driven expansion in the intestine and subsequent spillover/recirculation via the systemic circulation. Such T cells are measurable by overnight culture of peripheral blood mononuclear cells (PBMC) and single cell cytokine secretion (IFN-γ ELISPOT). This technique identified p57–73 (QLQPFPQPQLPYPQPQS) in A-gliadin as a potent stimulus for IFN-γ secretion by HLA DQ2 restricted CD4 T cells.21 Glutamine at position 65 in p57–73 is specifically deamidated by tTG Q→E65 (QE65) and causes at least a sixfold increase in peripheral blood T cell reactivity. The peptide p57–73 QE65 includes two overlapping sequences, DQ2-α-I (PFPQPELPY) and DQ2-α-II (PQPELPYPQ), that are common epitopes for CD intestinal gliadin specific T cell clones.14,17,18 Interestingly, intraduodenal instillation of LQLQPFPQPQLPYPQPQLPY causes villous atrophy and intraepithelial lymphocytosis comparable with gluten in volunteers with CD.22
Despite the consistency of findings using peripheral blood effector T cells after gluten challenge and intestinal biopsy derived clones, there have been no further reports utilising in vivo gluten challenge, and questions remain regarding the interpretation and reproducibility of this technique. If short term gluten challenge does induce effector T cells in peripheral blood representative of intestinal gluten specific T cells in CD, the technique would be valuable for many CD related as well as other broader studies of antigen specific intestinal responses.
The aims of this study were: (1) to establish the quantitative nature of IFN-γ ELISPOT for detection of p57–73 QE65 and gliadin specific T cells; (2) to determine the phenotype, HLA restriction, and intestinal integrin expression of peripheral blood gliadin specific T cells evoked by in vivo gluten challenge; (3) to define the clinical requirements (prior antigen exposure) for gluten challenge to predictably induce gluten specific T cells in blood; and (4) to exploit IFN-γ ELISPOT and gluten challenge to determine the consistency and contribution of T cells specific for p57–73 QE65 to the polyclonal T cell response to deamidated gliadin in a large number of subjects with CD, as there have been conflicting reports on the consistency of responses to this peptide in CD.14,17,18
MATERIALS AND METHODS
Subjects and antigen challenge
The study was approved by local ethics committees in Oxford and Melbourne. CD was diagnosed according to ESPGAN criteria.23 Demographics of subjects are shown in table 1. Long term GFD CD subjects were recruited by invitation to those attending the Coeliac Clinic at the John Radcliffe Hospital (n = 49) or through the local newsletter of the Coeliac Society of Victoria (n = 10)–all believed they were strictly compliant with a GFD and were endomysial (EMA) or tTG IgA negative, and none used immunosuppressants. Patients newly diagnosed with CD (EMA positive) attending the Coeliac Clinic (Oxford) from April to October 2000 who had not commenced a GFD were invited to participate—all except one agreed (n = 13). Healthy controls (EMA negative) were recruited from the Gastroenterology Unit and research staff at the John Radcliffe Hospital (n = 9) and followed a GFD for four weeks prior to gluten challenge. Gluten challenge consisted of four slices (4×50 g) of white bread daily for three days. Exceptions were in four subjects who only ate two slices of bread due to vomiting and abdominal pain which resolved within six hours (there were no other more severe adverse reactions), and three other subjects who ate four slices of bread daily for 10 days. Peripheral venous blood was drawn in all cases on day 6 after commencing the gluten challenge. Blood was also obtained before the three day gluten challenge (day 0, n = 12) and on day 7 (n = 28) for comparison with day 6, and during the 10 day challenge blood was collected on days 0, 6, and 10. Seven subjects agreed to two three day gluten challenges at least three months apart. HLA-DQA and HLA-DQB genotypes were determined using peripheral blood DNA and polymerase chain reaction with sequence specific primer mixes.24–26 HLA-DQ genotype data for subjects is shown in table 2.
Demographics of the subjects
HLA-DQ genotype of the subjects
Peptides
Synthetic peptides (>70% purity) were purchased from Research Genetics (Huntsville, Alabama, USA); their sequences are shown in table 3. Initially, A-gliadin p57–73 QE65 was used but subsequently substituted for homologues corresponding to Genbank sequences differing by one amino acid at the C terminal, AG01 E9 and AG02 E9, with bioactivity identical to A-gliadin p57–73 QE65 (manuscript in preparation). Digestion of gliadin (Sigma G-3375) and deamidation with guinea pig liver tTG (Sigma T-5398) is described elsewhere.21
Details of peptides
IFN-γ ELISPOT
ELISPOT for IFN-γ has been described previously.21 Mycobacterium tuberculosis purified protein derivative (PPD RT49) (Serum Institute, Copenhagen, Denmark) (5 μg/ml) or tetanus toxoid (Commonwealth Serum Laboratories, Melbourne, Australia) (10 light forming units/ml) was used as a positive control. Spot forming units (SFU) in individual wells were counted using an automated ELISPOT reader (AID ELISPOT Reader System; AID Autoimmun Diagnostika GmbH, Germany). Intra-assay per cent coefficient of variation of SFU/106 PBMC was 18% based on six duplicate assays of p57–73 QE65 (25 μg/ml) incubated with 0.5×10⁶ cells in five CD subjects in Oxford and, in Melbourne, 14% based on six duplicates in six CD subjects (all with >20 SFU/well).
Cell depletion and anti-class II antibody blocking
PBMC were depleted with precoated anti-CD4 and anti-CD8 magnetic beads (Dynal, Norway), and anti-β7 and anti-αE integrin coated beads prepared according to the manufacturer’s instructions using antirat IgG coated beads and antimouse IgG coated beads incubated with rat antihuman β7 IgG (clone FIB504; PharMingen) and mouse antihuman αE integrin IgG (clone 2G5; Beckman Coulter), respectively. As tTG-gliadin, p57–73 QE65, and PPD IFN-γ ELISPOT responses were completely abolished by CD4 depletion and unaffected by CD8 depletion in initial experiments, ELISPOT responses of depleted PBMC were expressed as a percentage of CD8 depleted PBMC IFN-γ ELISPOT responses to control for “non-specific” aggregation and depletion. MHC class II restriction was determined as previously described using anti-HLA-DR and anti-HLA-DQ antibody.21
Statistics
ELISPOT responses to medium alone were subtracted from responses to antigen. Non-parametric (Wilcoxon paired rank sum or Mann Whitney) tests were used to compare data. A probability level of 0.05 was considered significant. Dose-response curves and depletion and blocking data were based on subjects whose PBMC stimulated at least 20 SFU/well to the antigen studied.
RESULTS
IFN-γ ELISPOT dose-response to deamidated gliadin and p57–73 QE65
In CD subjects on a long term GFD, PBMC collected six days after commencing gluten challenge showed reproducible and dose dependent IFN-γ ELISPOT responses to p57–73 QE65 (n = 8) (fig 1A) and tTG deamidated chymotrypsin digested gliadin (“tTG-gliadin”) (n = 5) (fig 1B). IFN-γ ELISPOT responses to p57–73 QE65 were maximal at between 10 and 100 μg/ml (median 20 μg/ml), and half maximal (EC50) at 0.5–5 μg/ml (median 2 μg/ml). Dose-response curves for the two DQ2.5cis+2.2 subjects were similar to five with DQ2.5cis and one with DQ2.5cis+8. Optimal concentrations for tTG-gliadin and gliadin were not clearly reached even at 500 μg/ml. However, PBMC IFN-γ ELISPOT responses to gliadin were equivalent to approximately 10 times lower concentrations of tTG-gliadin.

Peripheral blood mononuclear cell (PBMC) interferon γ (IFN-γ) ELISPOT dose-response relationship for individual coeliac disease subjects to A-gliadin p57–73 QE65 (n = 8) (A) and chymotrypsin digested gliadin with or without deamidation by tissue transglutaminase (tTG), and tTG alone (n = 5) (B). Results are expressed as per cent of an individual’s maximal response to any concentration of p57–73 QE65 or tTG-gliadin, respectively.
Peripheral blood CD4+ α4β7+ HLA-DQ2 restricted gliadin specific T cells
The frequency of peripheral blood p57–73 QE65 specific T cells was not sufficient for FACS based analysis and therefore expression of CD4, CD8, and αE (CD103) and β7 integrin proteins associated with homing to the intestinal epithelium (αEβ7) and lamina propria (α4β7)28,29 was determined by depletion of freshly isolated PBMC using immunomagnetic beads. In PBMC from nine subjects, both tTG-gliadin and p57–73 QE65 IFN-γ responses were abolished by depletion with anti-β7 integrin coated beads, but were generally unaffected by anti-αE integrin coated beads (fig 2A). IFN-γ ELISPOT responses to purified protein derivative of Mycobacterium bovis (PPD) were unaffected by depletion with anti-αE integrin coated beads and only modestly reduced by depletion with anti-β7 integrin coated beads. FACS analysis demonstrated that treatment of PBMC with anti-β7 integrin and anti-αE integrin coated beads depleted CD4+ β7+ PBMC by 99% and CD4+ αE+ PBMC by 47% (data not shown).
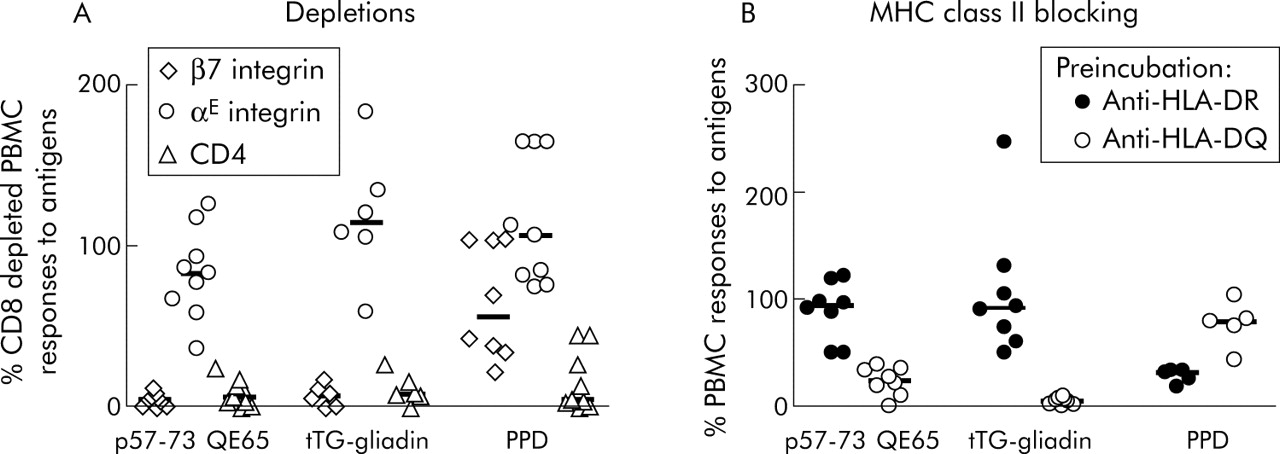
Interferon γ (IFN-γ) ELISPOT responses of peripheral blood mononuclear cells (PBMC) to p57–73 QE65 (25 μg/ml) (n = 9), tissue transglutaminase (tTG) deamidated gliadin (100 μg/ml) (n = 6), and purified protein derivative of Mycobacterium bovis (PPD 5 μg/ml) (n = 8) (median marked) after depletion using anti-integrin-β7 or -αE, or anti-CD4 immunomagnetic beads, in HLA-DQ2+ coeliac disease subjects on a long term gluten free diet, six days after commencing a three day gluten challenge (A). Results are expressed as per cent of CD8 depleted PBMC responses to antigens; not every subject responded to each antigen. IFN-γ ELISPOT responses of PBMC to p57–73 QE65 (50 μg/ml) (n = 8), tTG deamidated gliadin (100 μg/ml) (n = 8), and PPD (5 μg/ml) (n = 5) (median marked) following preincubation for one hour with anti-HLA-DR (L243) or anti-HLA-DQ (SPvL3) antibody (B). Results are expressed as per cent of PBMC responses to antigens without preincubation with antibody.
Preincubation of PBMC from eight CD subjects (HLA DQ2.5cis, n = 2; DQ2.5cis+2.5cis, n = 3; DQ2.5cis+2.2cis, n = 3) on day 6 after commencing gluten challenge with anti-HLA-DQ antibody (SPvL3) reduced IFN-γ ELISPOT responses to tTG-gliadin (100 μg/ml) to a median of 5% compared with no antibody (interquartile range 2–7%, p<0.008, by one tailed Wilcoxon rank sum test, n = 8), p57–73 QE65 (50 μg/ml) to a median of 24% (interquartile range 15–34%, p<0.008, n = 8), and PPD (5 μg/ml) to a median of 80% (range 5–80%, not significant, n = 5; three subjects did not respond to PPD) (fig 2B). Preincubation with anti-HLA-DR antibody (L243) did not significantly reduce IFN-γ ELISPOT responses to any of the antigens compared with no antibody (tTG-gliadin: median 92%, interquartile range 67–118%, n = 8; p57–73 QE65: median 94%, interquartile range 69–109%, n = 8; PPD: median 32%, range 18–34%, n = 5).
Low frequency p57–73 QE65 T cells in untreated CD disappear with a GFD
In newly diagnosed CD (n = 13), IFN-γ ELISPOT responses to both p57–73 QE65 (25 μg/ml) and tTG-gliadin (100 μg/ml) were close to minimum detection limits. The median response to p57–73 QE65 was 13 SFU/106 PBMC (range 2–18, n = 11) compared with 7 for medium alone (range 4–11; p<0.003 by one tailed Wilcoxon paired rank sum test) (fig 3A); for tTG-gliadin the median response was 26 (range 8–246, n = 11) compared with 9 for tTG alone (range 3–39, n = 11; p<0.01) (fig 3B). One, two, and eight weeks after commencing GFD, IFN-γ ELISPOT responses to p57–73 QE65 were no different from medium alone. IFN-γ ELISPOT responses to tTG-gliadin were maintained at one week (median 34, range 3–181, n = 4) but undetectable at two weeks (n = 5) and eight weeks (n = 7). IFN-γ ELISPOT responses to PPD did not change with a GFD (fig 3C).

Interferon γ (IFN-γ) ELISPOT responses (spot forming units (SFU)/106 peripheral blood mononuclear cells (PBMC), median marked) to p57–73 QE65 (25 μg/ml) (A), tissue transglutaminase (tTG) deamidated gliadin (100 μg/ml) (B), and purified protein derivative of Mycobacterium bovis (PPD 5 μg/ml) (C) in patients with a new diagnosis of coeliac disease before adopting a gluten free diet (GFD) (“None”) (n = 11), and immediately before (Day 0) and on day 6 after a three day gluten challenge performed after following a strict GFD for one (n = 4), two (n = 5), or eight (n = 7) weeks.
Gluten challenge induces peripheral blood T cells after two weeks of a GFD
Three day gluten challenge was performed one, two, and eight weeks after patients newly diagnosed with CD commenced a GFD. After one week of a GFD, gluten challenge did not induce IFN-γ ELISPOT responses to p57–73 QE65 or tTG-gliadin (fig 3A, B) but after a GFD for two weeks and even more so after eight weeks, gluten challenge induced highly significant increases in IFN-γ ELISPOT responses to p57–73 QE65 (two weeks day 0: median 8 SFU/106 PBMC (range 0–8); day 6: 22 (5–50); day 0 v day 6, p<0.022 Wilcoxon paired rank test one tailed, n = 5; eight weeks day 0: 3 (1–6); day 6: 66 (8–119); p<0.011, n = 7) and tTG-gliadin (two weeks day 0: 11 (range 4–12); day 6: 28 (6–116); p<0.022, n = 5; eight weeks day 0: 4 (2–26); day 6: 68 (7–157); p<0.01), but not PPD (fig 3A–C) or tTG alone (data not shown). Responses to p57–73 QE65 induced by gluten challenge by eight weeks after commencing GFD (n = 7) were not significantly different from those in CD subjects on a long term GFD (median 83 SFU/106; n = 59, p = 0.17 Mann Whitney test).
Gliadin specific T cells in healthy HLA-DQ2 subjects after gluten challenge
Gluten challenge weakly induced IFN-γ ELISPOT responses to gliadin (500 μg/ml) in healthy HLA-DQ2 subjects after four weeks of a GFD (day 0 median: 3 SFU/106 PBMC, interquartile range 0–5; day 6 median: 21, interquartile range 2–32; n = 9 p<0.01) (fig 4A). Deamidation did not enhance IFN-γ ELISPOT responses to gliadin in healthy subjects before or on day 6 after gluten challenge (median ratio day 6 SFU tTG-gliadin to no tTG: 0.6) (fig 4B). In one healthy subject, there was induction of IFN-γ ELISPOT responses to gliadin (500 μg/ml) (day 0 20 SFU/106 PBMC, day 6 171) similar to those seen in CD subjects except that deamidation did not increase the response to gliadin (no tTG: 175 SFU/106; +tTG: 171). Gluten challenge did not induce responses to the A-gliadin 57–73 QE65 homologue, AG01 E9 (20 μg/ml), in any healthy subject (fig 4C).

Interferon γ (IFN-γ) ELISPOT responses of peripheral blood mononuclear cells (PBMC) from individual HLA-DQ2+ healthy subjects after a gluten free diet (GFD) for four weeks (n = 9) (A) and coeliac disease (CD) subjects on a long term GFD (n = 12) (D) to tissue transglutaminase (tTG) deamidated gliadin (500 μg/ml) before and on day 6 and day 10 after commencing a three day gluten challenge. IFN-γ ELISPOT responses of the same healthy (B) and CD (E) subjects to gliadin (500 μg/ml) with or without tTG deamidation (mean (SEM)). Individual IFN-γ ELISPOT responses to the p57–73 QE65 homologue, AG01 E9 (20 μg/ml) (see table 1 for sequence), in healthy (C) and CD (F) subjects. Individual IFN-γ ELISPOT responses of all HLA-DQ2+ CD subjects on a long term GFD (n = 59) to medium alone or p57–73 QE65 (25 or 50 μg/ml), AG01 E9 (20 μg/ml), or AG02 E9 (100 μg/ml) (see table 3 for sequences) (G), and according to HLA-DQ genotype (H). IFN-γ ELISPOT responses to tTG deamidated gliadin (500 μg/ml) on day 6 after a three day gluten challenge correlated with p57–73 QE65 in 17 individual CD subjects (I). SFU, spot forming units.
Consistency and magnitude of the p57–73 QE65 T cell response in coeliac disease
In agreement with our earlier study,21 11/12 CD subjects showed induction of tTG-gliadin specific IFN-γ ELISPOT responses following gluten challenge (tTG-gliadin day 0: median 43, range 7–250; day 6: median 238, range 17–546, p<0.02; gliadin 500 μg/ml day 0: median 20, range 2–150 SFU/106 PBMC; day 6 median 81, range 1–203, NS) (fig 4D, E) that was matched by potent induction of responses to AG01 E9 (20 μg/ml day 0: median 0, range 0–8; day 6: median 139, range 0–663, n = 12, p<0.003) (see fig 4F).
Median IFN-γ ELISPOT response of PBMC collected from 59 CD subjects on a long term GFD to “optimal” concentrations (20–100 μg/ml) of p57–73 QE65 (or AG01 E9 or AG02 E9) on day 6 after gluten challenge was 83 SFU/106 (range 1–1500, interquartile range 27–151) (fig 4G). In 50/59 (85%) subjects, IFN-γ ELISPOT PBMC responses to p57–73 QE65 were between 10 and 1500 SFU/106, and to medium alone less than 10 SFU/106 in 57/59. After a three day gluten challenge in 26 CD subjects, ELISPOT was performed on day 7 as well as on day 6; responses to p57–73 QE65 were maintained but were usually lower on day 7 than on day 6 (day 6: median 91, interquartile range 59–180; day 7: median 69, interquartile range 37–151; p<0.012 by Wilcoxon paired rank sum two tail test). In six of seven subjects who underwent gluten challenge on two occasions between three and 12 months apart, responses to p57–73 QE65 were present on both occasions (first challenge day 6: median 108 SFU/106, range 46–1500; second challenge day 6: median 39, range 0–170). In three subjects, consumption of bread for 10 days was not associated with greater responses to tTG-gliadin or AG01 E9 on day 6 and had fallen by day 10 (fig 4F).
HLA-DQ2 gene dosage was not associated with significant differences in the frequency of p57–73 QE65-specific SFU/106 PBMC using Mann Whitney one tail non-parametric testing: DQ2.5cis+2.5cis: median 79, interquartile range 27–652, n = 10; DQ2.5cis+2.2cis: median 93, interquartile range 19–154, n = 16; DQ2.5cis+8: median 105, range 3–522, n = 5; DQ2.5cis: median 70, interquartile range 0–135, n = 23; DQ2.5trans: median 38, range 9–762, n = 5) (fig 4H).
Correlation between tTG-gliadin and p57–73 QE65 IFN-γ ELISPOT responses
In CD subjects (n = 17), day 6 post-gluten challenge IFN-γ ELISPOT responses to tTG-gliadin (500 μg/ml) and p57–73 QE65 (25 μg/ml, n = 5) or AG01 E9 (20 μg/ml, n = 12) were significantly correlated (r = 0.80, p<0.0001) (see fig 4I). Median IFN-γ ELISPOT responses to p57–73 QE65 (25 μg/ml) or AG01 E9 (20 μg/ml) were 51% (range 0–155%) of those to tTG-gliadin (500 μg/ml), although in 3/17 CD subjects responses to p57–73 QE65 were less than 5% (<9 SFU/106 PBMC) of those to tTG-gliadin (fig 4I).
DISCUSSION
In model murine systems, there is persuasive evidence that gastrointestinal and systemic T cell responses are intimately linked. Oral administration of antigen is followed by proliferation of antigen specific T cells in gut associated and systemic lymphoid tissue.30 Identical T cell clones are found within the gut lamina propria and thoracic duct,31 implying their presence in venous blood and trafficking to tissues where their cognate antigen is presented. Autoantigen (myelin basic protein) specific T cells transferred to a syngeneic recipient disappear from blood after three days and are exclusively found in tissue expressing myelin basic protein (central nervous system).32 Such data would be consistent with gluten challenge stimulating gluten specific memory T cell proliferation in gut associated lymphoid tissue followed by passage of effector T cells via the thoracic duct to peripheral blood. Presumably, gluten specific T cells circulate in blood until they migrate to tissues (small intestine) expressing an appropriate addressin where they are activated by encounter with their cognate antigen (gluten).
In this study, the phenotype of peripheral blood gluten specific T cells induced by in vivo gluten challenge was determined by immunomagnetic bead depletion of PBMC as the frequency of relevant T cells was insufficient for FACS based methods. Depletion of PBMC with magnetic beads coated with anti-CD4 or anti-β7 integrin, but not anti-CD8 or anti-αE integrin, consistently abolished IFN-γ ELISPOT responses to deamidated gliadin and p57–73 QE65. Furthermore, anti-HLA-DQ but not anti-HLA-DR blocked IFN-γ ELISPOT responses to deamidated gliadin and p57–73 QE65 in HLA-DQ2.5cis homozygotes and heterozygotes. Therefore, IFN-γ ELISPOT detects CD4 T cells in peripheral blood specific for deamidated gliadin and p57–73 QE65 that are likely to be almost exclusively HLA-DQ2 restricted, are induced by in vivo gluten exposure, and are very likely to express the α4β7 integrin that ligates MAdCAM-1 and is associated with homing to the intestinal lamina propria.28,29
These findings appear to be in conflict with those of Molberg et al that gliadin specific T cell clones originally derived from peripheral blood or duodenal biopsy material cultured with gliadin are qualitatively different.13 However, there are several differences between patients with CD eating gluten to evoke effector T cells in their blood that are assayed by overnight culture, and in vitro culture of peripheral blood or biopsies with predigested gliadin followed by several additional weeks of culture to generate polyclonal or monoclonal T cells. Molberg et al report that T cell clones isolated from CD duodenal tissue are specific for gliadin epitopes generated by endogenous tTG mediated deamidation occurring while biopsies are in short term culture being pulsed with gliadin.15 Transglutaminase activity in culture medium alone while pulsing peripheral blood T cells sufficient to deamidate gliadin to the same degree as intestinal biopsies seems unlikely. It is also unclear whether peripheral blood (and intestinal) clones specific for gliadin are derived from naïve or memory T cells.
In addition, the frequency of IFN-γ secreting p57–73 QE65 specific T cells is very low (<1/100 000) in peripheral blood except for a window of several days after gluten exposure in individuals normally following a strict GFD. Three day gluten challenge increases the frequency of p57–73 QE65 specific T cells in peripheral blood by up to eight times levels in untreated CD when a GFD is followed for two weeks, and up to 200 times after a GFD is followed for eight weeks or longer. Conversely, gluten challenge is not effective in inducing peripheral blood T cells specific for deamidated gliadin and p57–73 QE65 if a strict GFD has not been followed for at least two weeks. Induction of gliadin specific T cells by gluten challenge is similar after a GFD for eight weeks in newly diagnosed CD as it is after a long term GFD. We specifically excluded CD subjects on a “long term GFD” if they showed positive EMA or tTG-IgA as markers of suboptimal compliance with GFD.
IFN-γ ELISPOT detected ⩾10 SFU/106 PBMC specific for p57–73 QE65 or one of two near identical homologues in 85% of 59 HLA-DQ2+ CD subjects on a long term GFD drawn from two countries. The frequency of T cells detected by IFN-γ ELISPOT specific for p57–73 QE65 was typically half that for deamidated gliadin (500 μg/ml), indicating that p57–73 QE65 is generally but not always the “dominant” epitope in CD after wheat ingestion. HLA-DQ2 gene dose was not associated with the frequency of p57–73 QE65-specific T cells in peripheral blood after gluten challenge.
In conclusion, in vivo gluten challenge in CD induces peripheral blood gluten specific HLA-DQ2 restricted CD4 T cells expressing an intestinal lamina propria homing integrin. A-gliadin p57–73 QE65 includes the dominant T cell epitopes for HLA-DQ2 associated CD. Gluten challenge provides a unique opportunity to use peripheral blood for rapid mapping, and quantitative assessment of relevant gluten epitopes, assess other grains toxic in CD, and monitor T cell responses during the development of therapeutics.
Acknowledgments
Supported by grants from Oxford University Challenge Seed Fund, Graham Bird Memorial Fund, Ramaciotti Foundation, and Cancer Council of Victoria. RPA is the DW Keir Fellow in Clinical Research and Lions Cancer Council Fellow, DvH is a Wellcome Clinician Scientist Fellow, JT-D holds a National Health and Medical Research Council Postgraduate Medical Scholarship, and AVSH is a Wellcome Trust Principal Research Fellow. The cooperation of the Coeliac Society of Victoria and assistance of volunteers for these studies is gratefully acknowledged. RPA is a consultant to BTG International Plc.
REFERENCES
Supplementary materials
Competing Interest: RP Anderson, DA van Heel, JA Tye-Din, DP Jewell, and AVS Hill are co-inventors of intellectual property relating to the application of gluten T cell epitopes in coeliac disease. RP Anderson is a consultant to BTG International Plc. M Barnardo and M Salio, competing interests: none declared.