Article Text

Abstract
Background: Saliva has a high nitrite concentration, derived from the enterosalivary recirculation of dietary nitrate, and is the main source of nitrite entering the acidic stomach. Acidification of nitrite in the presence of secondary amines or amides generates potentially carcinogenic N-nitroso compounds. The reaction is inhibited by ascorbic acid and catalysed by thiocyanate.
Aim: To determine whether there is intragastric regional variation in the chemical conditions promoting luminal nitrosation following nitrate ingestion.
Methods: Using microdialysis probes, we measured concentrations of nitrite, ascorbic acid, total vitamin C, and thiocyanate simultaneously in saliva, the distal oesophagus, cardia, and the proximal and distal stomach of 17 healthy volunteers before and following intragastric nitrate (2 mmol) administration.
Results: The median pH in the distal oesophagus, cardia, and proximal and distal stomach were 7, 2.6, 1.9, and 1.7, respectively, before, and were similar following nitrate administration. Mean nitrite concentration in the distal oesophagus was similar to that of saliva, being 29.1 μM and 36.7 μM, respectively, before nitrate and increasing to 181.6 μM and 203.3 μM after nitrate ingestion. Within the stomach, mean (SEM) nitrite concentration following nitrate was higher in the cardia (45.5 (12.7) μM) than in the mid (7.8 (3.1)) (p<0.01) or distal (0.8 (0.6)) (p<0.1) stomach, and ascorbic acid concentration was lower at the cardia (13.0 (6.1)) than in the mid (51 (19.2)) (p<0.02) or distal (86 (29)) (p<0.01) stomach. Consequently, the median ascorbic acid to nitrite ratio was lowest at the cardia (0.3) (p<0.01) versus the mid (7.8) or distal (40) stomach. Thiocyanate concentration was similar throughout the stomach.
Conclusions: The conditions favouring luminal generation of N-nitroso compounds from dietary nitrate are maximal at the most proximal cardia region of the acidic stomach and may contribute to the high incidence of mutagenesis at this site.
- diet
- nitrate
- nitrosation
- vitamin C
- gastric cancer
- cardia
- microdialysis
Statistics from Altmetric.com
The epithelium of the most proximal cardia region of the stomach and adjacent gastro-oesophageal junction is remarkable for its high incidence of metaplasia and adenocarcinoma.1–3 The mutagen responsible remains unknown. Identifying the mutagen is particularly important as the incidence of cancer at this anatomical location has increased markedly over the past 20 years.4–6
Cancer of the gastro-oesophageal junction and cardia differs from cancer of the more distal stomach with respect to associated gastric physiology. The former occurs in patients with normal gastric secretory function.7–9 In contrast, cancer of the more distal stomach usually develops against a background of Helicobacter pylori induced atrophic gastritis and hypochlorhydria.9
A reliable method of inducing cancers of the oesophagus or stomach in experimental animals is by administering N-nitroso compounds.10,11 Such compounds can be generated endogenously from nitrite in the upper gastrointestinal tract.12 The acidic conditions present in the stomach convert nitrite to nitrous acid and related nitrosating species which are able to react with secondary amines and amides forming potentially carcinogenic N-nitroso compounds.13
The major source of nitrite entering the healthy acid secreting stomach is saliva and arises from the enterosalivary recirculation of dietary nitrate.14 Following its absorption, approximately 30% of circulating nitrate is taken up by the salivary glands and secreted into the mouth.14 Bacteria on the dorsum of the tongue then reduce about 25% of the nitrate to nitrite.15,16 The salivary glands also actively take up and secrete thiocyanate and its concentration in saliva is approximately 1 mmol/l and even higher in smokers.17 The latter anion may also be secreted directly into gastric juice.17 Thiocyanate is a powerful catalyst of nitrosation of secondary amines by acidified nitrite.18 This delivery of nitrite and thiocyanate into the acidic environment of the stomach has therefore been regarded as a potentially important source of endogenous formation of carcinogenic N-nitroso compounds.12
Ascorbic acid is actively secreted into gastric juice19,20 and plays a key role in preventing acid catalysed luminal nitrosation.21,22 It does this by effectively competing with the secondary amines and amides for nitrosating species formed by acidification of nitrite.21,22 In this reaction acidified nitrite is reduced to nitric oxide and ascorbic acid oxidised to dehydroascorbic acid.23,24 Stoichemically, one molecule of ascorbic acid can reduce two molecules of acidified nitrite to nitric oxide.23,24 However, in the presence of dissolved oxygen, nitric oxide can be oxidised back to nitrite/nitrous acid.23–25 This recycling means that more than half the molar equivalent of ascorbic acid to nitrite is required to prevent formation of N-nitroso compounds.23–25 The ratio of ascorbic acid to nitrite is recognised to be a major determinant of generation of N-nitroso compounds within the acidic lumen of the stomach.24
We recently reported that the luminal concentrations of nitric oxide generated from the reaction between salivary nitrite and ascorbic acid in acidic gastric juice were maximal at the most proximal cardia region of the stomach.26 Nitric oxide is mutagenic at high concentrations, and we postulated that its diffusion into the adjacent epithelium could contribute to the high incidence of metaplasia and neoplasia at this localised anatomical site.
Our above observation regarding nitric oxide has stimulated us to compare the different anatomical regions of the upper gastrointestinal tract with respect to their concentrations of chemicals relevant to luminal nitrosation. Our findings indicate that the potential for acid catalysed luminal nitrosation arising from dietary nitrate is greatest in the most proximal cardia region of the stomach.
AIM
The aims of this study were to: (i) measure the concentrations of the chemicals relevant to acid catalysed luminal nitrosation (that is, nitrite, ascorbic acid, total vitamin C, and thiocyanate) at different anatomical locations within the lumen of the human upper gastrointestinal tract; and (2) determine the effects of nitrate intake on their concentrations.
MATERIALS AND METHODS
The study involved 17 healthy asymptomatic volunteers. Each was confirmed to be H pylori negative by the 14C urea breath test.27
Microdialysis probe
We used CMA flexible microdialysis probes (MAB 7.8.10; Biotech Instruments Ltd, Herts, UK) (fig 1A) to allow measurement of the chemicals relevant to acid nitrosation within localised regions of the upper gastrointestinal tract. The probes have a fine 1 m long inlet tube leading to the microdialysis chamber and a similar outlet tube returning from this chamber. The inlet tube is attached to a microdialysis pump (Univentor 864 microdialysis syringe pump; Biotech Instruments Ltd) capable of driving six syringes simultaneously and perfused at 150 μl/h with distilled water degassed with helium. Due to the equilibration across the semipermeable membrane, the concentration of solutes in the sample obtained from the outlet tube (termed microdialysis sample) provides a measure of their concentration in the test solution.28 It takes 10 minutes for the perfusate to return from the microdialysis chamber to the end of the outlet tube and therefore one includes this lag time before starting and completing the microdialysis sample collection.
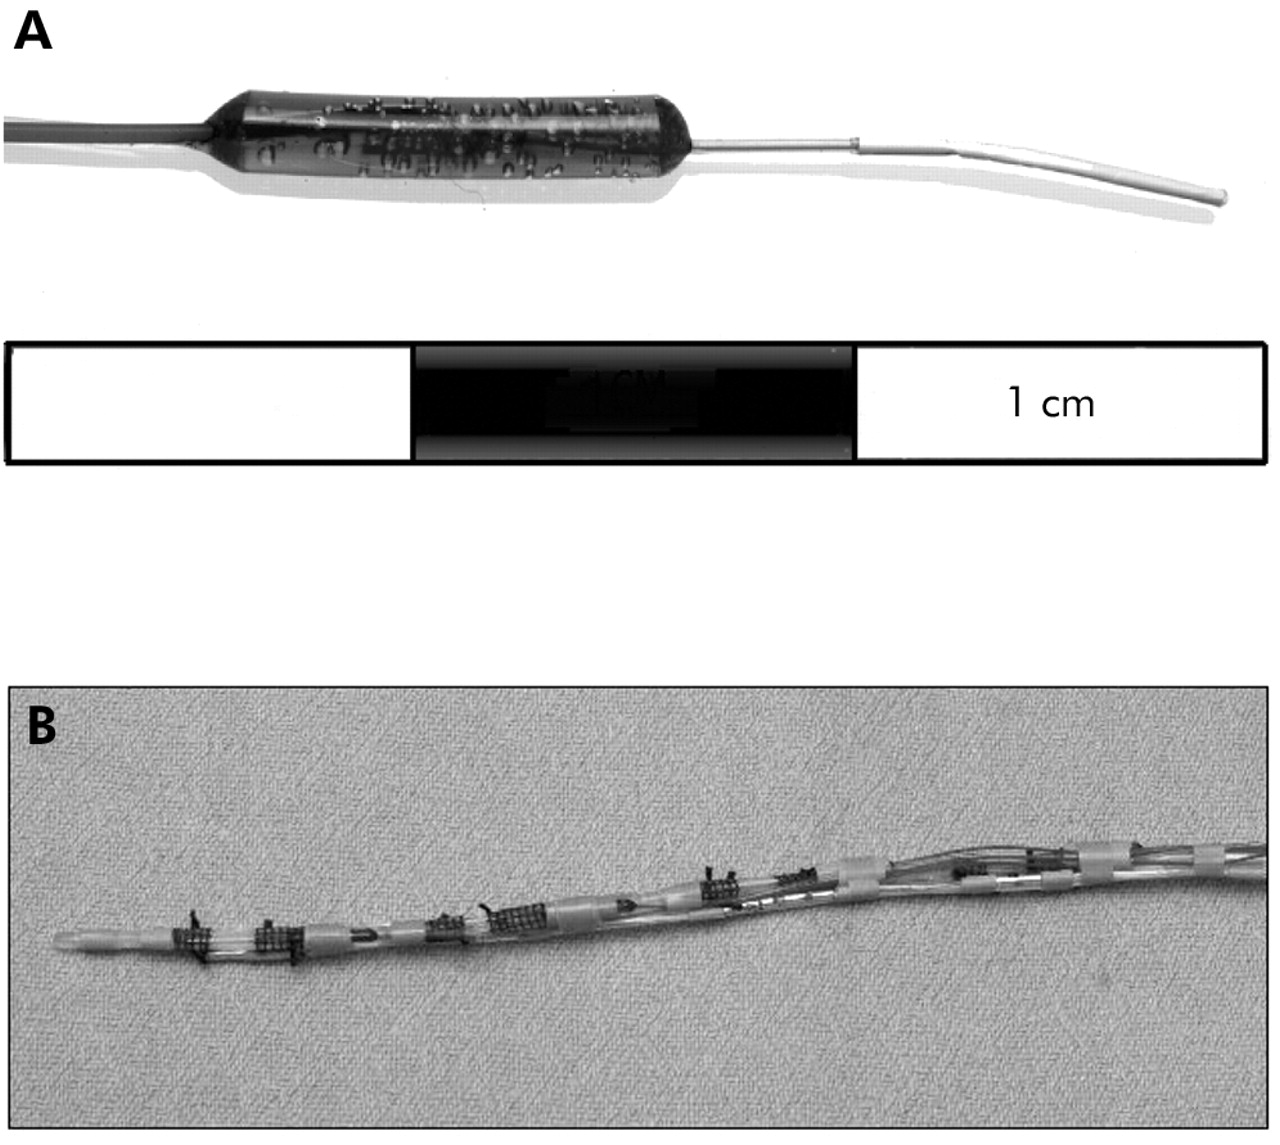
(A) Photograph of the microdialysis probe. The semipermeable membrane is on the most distal 1 cm segment of the probe. (B) Photograph of assembled apparatus. It consists of four microdialysis probes mounted on the outside of a nasogastric tube. The inlet and outlet tubes from each probe are contained within the lumen of the nasogastric tube. A Teflon feeding tube and multichannel pH sensor probe are also attached to the outside of the nasogastric tube.
We undertook extensive validation studies to confirm the reliability of the microdialysis probes to determine the concentration of nitrite, ascorbic acid, total vitamin C, and thiocyanate in both aqueous solutions and human gastric juice at 37°C.29 In these studies, the concentration of the chemical in the microdialysis sample is compared with that in the solution in which the probe is placed and the former expressed as a percentage of the latter representing the recovery value. Eight studies were performed in both aqueous solution and gastric juice for each chemical and at each of the following pH values: 1.5, 2.5, 3.5, 5.5, and 7.0. Recovery of greater than 60% was obtained under every condition studied and the standard errors for each set of eight experiments ranged from ±1.1% to ±6.8%. We also performed studies in which we added 1 ml boluses of nitrite into hydrochloric acid at varying pH and containing various concentrations of ascorbic acid in order to simulate the conditions occurring near the gastro-oesophageal junction. Under these dynamic conditions where nitrite was in excess of ascorbic acid, the microdialysis probe showed the same recovery as for the static studies. Under dynamic studies in which ascorbic acid was in excess of nitrite, the microdialysis sample showed no nitrite whereas some nitrite was detected in the sample taken directly from the test solution. By measuring nitric oxide in the test solution, we were able to show that all of the nitrite added to the stomach in the presence of excess ascorbic acid had been converted to nitric oxide. The nitrite detected in the sample taken directly from the stomach was artefactual due to nitric oxide reverting to nitrite within the NaOH solution into which the sample is collected. This artefact did not occur with the microdialysis probe as nitric oxide diffuses out of the collecting tubes during its 10 minute passage along it and prior to collection in the NaOH solution.
Assembly of microdialysis probes for in vivo studies
Four microdialysis probes were secured in individual recesses created 5 cm apart in a 3.3 mm diameter nasogastric tube (Rusch Manufacturing, Lurgan, UK). Their inlet and outlet tubes were contained within the lumen of the tube. A multiple channel pH catheter (Synectics Medical Ltd, Enfield, UK) was attached to the outside of the nasogastric tube with pH sensors positioned alongside each microdialysis probe and an additional sensor located 1 cm proximal to the cardia microdialysis probe (fig 1B). Outputs from the pH sensors were digitalised (DAS 1201 data acquisition board; Keithley Instruments Ltd, Reading, Berkshire, UK), monitored on a computer screen during the procedure, and stored on computer for subsequent analysis.
Prior to each study, recovery of each probe fully assembled on the nasogastric tube was assessed for each individual chemical at 37°C at pH 1.5, 2.5, and 7. Following each study, individual probes were then removed from the nasogastric tube, cleaned, and sterilised with Cidex (Johnson and Johnson, Newark, New Jersey, USA) before being remounted into a fresh nasogastric tube.
Clinical procedure
Subjects presented in the morning having fasted since the previous evening. In addition, they were instructed to avoid nitrate rich foods for 24 hours prior to the procedure. The probe assembly was passed perorally and positioned so that the pH sensor sited 1 cm proximal to the cardia microdialysis probe recorded oesophageal pH (>4) and the pH sensor at the cardia microdialysis probe recorded gastric pH (<2.5). This ensured that the cardia microdialysis probe was located just distal to the gastro-oesophageal junction as the pH step up corresponds to the squamocolumnar junction under fasting conditions.30 The position of the assembly was checked by an abdominal x ray. Subjects lay semirecumbent throughout the study. The pH being recorded by each sensor was closely monitored during each study and the position of the tube adjusted if required to maintain its correct location relative to the gastro- oesophageal junction.
After confirmation of satisfactory positioning, the first 15 minute collections of the microdialysis samples were discarded and the following 40 minutes collected for analyses. Following this basal collection, 2 mmol potassium nitrate in 25 ml water was administered intragastrically via a fine Teflon feeding tube attached to the nasogastric tube. This dose of nitrate is equivalent to that in a standard portion of lettuce.31 Forty minutes after administering potassium nitrate, further microdialysis collections were obtained for 40 minutes. The delay between administration of nitrate and commencing collections is to allow time for nitrate to be absorbed, secreted in saliva, and converted in the mouth to nitrite.
The microdialysis samples for ascorbic acid and total vitamin C were collected into a glass vial (No 1) containing 25 μl of a solution of 2% metaphosphoric acid and 0.5% sulphamic acid and were further diluted with equal volumes of metaphosphoric/sulphamic acid solution for ascorbic acid and with 12 mg/ml dithiothreitol in metaphosphoric/sulphamic acid solution for total vitamin C samples. Nitrite and thiocyanate samples were collected into a glass vial (No 2) containing 20 μl of 1 M NaOH. The two different collections from each collecting tube were achieved by alternating the microdialysis collecting tube between vials Nos 1 and 2 every two minutes. Over each 40 minute collecting period, 50 μl were obtained from each microdialysis probe for ascorbic acid/total vitamin C and 50 μl for nitrite/thiocyanate. The vitamin C samples were frozen at −70°C for analysis within four weeks and nitrite and thiocyanate samples were stored at 4°C for analysis on the same day.
Venous blood was obtained from an indwelling intravenous catheter every 15 minutes for determination of serum nitrate and plasma ascorbic acid and total vitamin C. Samples were centrifuged at 3000 rpm at 4°C for 10 minutes and the supernatant for plasma ascorbic acid and total vitamin C were diluted with equal volumes of 2% metaphosphoric acid-0.5% sulphamic acid with or without 12 mg/ml of dithiothreitol, snap frozen in liquid nitrogen, and stored at −70°C until analysis within four weeks. The supernatant for serum nitrate was transferred into a plain test tube and frozen at −20°C until analysis within four weeks.
Samples of saliva were obtained every 15 minutes for nitrite and thiocyanate determination. This was done by asking the patient to spit into a sterile container and 500 μl were immediately added to 50 μl of 1 M NaOH in a 1.5 ml plastic tube and stored at 4°C until analysis on the same day. Prior to analysis, saliva samples were centrifuged at 13 000 rpm for two minutes using a microcentrifuge and the supernatant was analysed.
Chemical analyses
Determination of ascorbic acid and total vitamin C concentrations
Samples were analysed using high performance liquid chromatography and an electrochemical detector, as described by Sanderson and colleagues.32 The assay measures ascorbic acid. Addition of dithiothreitol reduces any ascorbic acid which has been oxidised to dehydroascorbic acid back to ascorbic acid and this measurement is referred to as total vitamin C.
Determinations of nitrite and thiocyanate concentrations
Samples were analysed against known concentrations of nitrite or thiocyanate in a 96 well microplate using the modified Greiss reagent for nitrite analysis25 and the Bowler method for thiocyanate.33 Colorimetric analysis was performed 20 minutes after addition of the Greiss reagent using a 540 nm filter for nitrite and immediately after addition of ferric nitrate in nitrous acid using a 450 nm filter for thiocyanate.
Determination of serum nitrate concentrations
After thawing, serum samples were filtered through a 10 kDa microfilter (Microcon 10; Millipore UK Ltd, Watford, UK) to remove high molecular weight substances. Nitrate was reduced to nitrite using bacterial nitrate reductase, as previously described.34 Nitrite was then measured by the Greiss reagent as described above.
Statistical analyses
All data are presented as mean (SEM) unless otherwise stated. The pH data and ascorbic acid/nitrite ratios for the different regions of the upper gastrointestinal tract are presented as medians as they are exponential functions. Paired data were analysed using a one sample Wilcoxon test. In order to calculate the ascorbic acid to nitrite ratio, any samples with undetectable levels of ascorbic acid or nitrite concentrations were allocated a concentration of 1 μM, the approximate lower limit of detection for both ascorbic acid and nitrite using our analytic methods. If both ascorbic acid and nitrite were undetectable, these samples were excluded from analysis. Statistical testing was performed using the one sample Wilcoxon test. Bonferroni correction was applied for multiple comparisons. A two tailed p value <0.05 was considered to be statistically significant.
Ethics
The study was approved by the North Glasgow University NHS Trust Ethics Committee and each subject gave written informed consent.
RESULTS
Twenty one volunteers were recruited. Four were unable to tolerate the procedure for the duration of the experiment and were excluded, leaving 17 available for analysis. Mean age was 32.1 years (range 18–52) and 12 were males.
Blood
Prior to nitrate administration, fasting serum nitrate concentration was 18.5 (1.5) μM. Following ingestion of 2 mmol nitrate, serum nitrate increased threefold within 30 minutes, peaking 25 minutes after nitrate administration at 59.5 (2.4) μM, and remained at this level for at least the following 60 minutes. Plasma ascorbic acid concentration was 52.2 (4.9) μM and that of total vitamin C was 54.6 (4.9) μM. Plasma concentrations of ascorbic acid and total vitamin C were unchanged following nitrate administration.
Saliva
Prior to insertion of the probe assembly, the saliva nitrite concentration was 112.5 (30.0) μM and fell to 36.7 (9.9) μM at 15 minutes after insertion of the microdialysis assembly (p<0.01). Following administration of nitrate, the saliva nitrite concentration increased sixfold over the following 30 minutes and remained elevated for at least the following 60 minutes. Prior to passing the probe assembly, the saliva thiocyanate concentration was 2597 (481) μM and following placement of the assembly this fell to 1360 (283) μM (p<0.01) and remained at this level throughout the remainder of the study.
Oesophagus
The median pH of the distal oesophagus was 7, and was unaffected by administration of nitrate. Fasting nitrite concentration in the distal oesophagus was 29.1 (7.1) μM which was similar to the fasting saliva nitrite concentration of 36.7 (9.9) μM (fig 2). Following nitrate administration, nitrite concentration in the distal oesophagus increased to 181.6 (26.4) μM at 55 minutes which again was similar to that of saliva nitrite which increased to 203.3 (30.3) μM (p<0.01 v fasting levels) (fig 2).
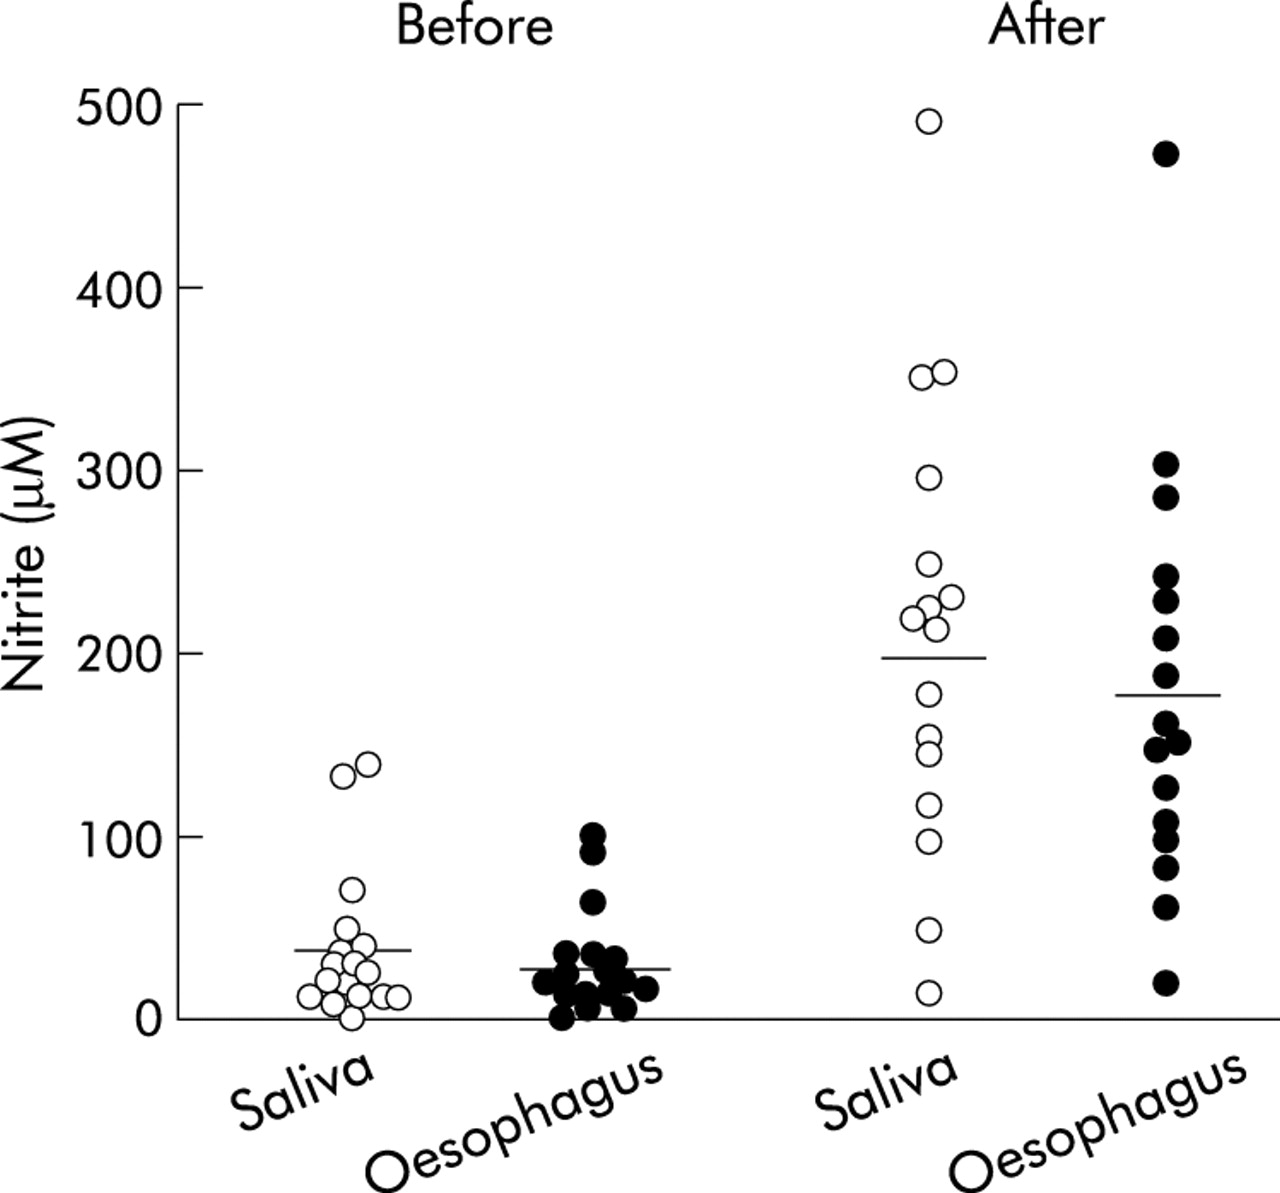
Individual salivary and oesophageal nitrite concentrations before and after nitrate administration. The after nitrate sample was collected over the 40 minute period starting 40 minutes after nitrate administration. The horizontal lines represent mean values. Both salivary and oesophageal nitrite were increased following nitrate administration (p<0.01). Salivary and oesophageal nitrite concentrations were not significantly different from each other either before or after nitrate dosing.
Both ascorbic acid and total vitamin C concentrations were low in the oesophagus. Ascorbic acid concentration was 11.5 (2.6) μM before nitrate administration and was slightly lower at 9.8 (2.7) μM after nitrate. Total vitamin C concentration was 11.8 (1.9) μM before nitrate and 10.1 (1.7) μM after nitrate.
Thiocyanate concentration in the distal oesophagus before nitrate administration was 809 (145) μM which was lower than the corresponding value in saliva at 1360 (283) μM (p<0.01). Following nitrate administration, thiocyanate concentration in the distal oesophagus was unchanged at 917 (160) μM and again lower than that in saliva at 1286 (235) μM (p<0.01).
Stomach
pH
Prior to nitrate administration, the median pH of the cardia, proximal stomach, and distal stomach were 2.6, 1.9, and 1.7, respectively. Following nitrate, the pH of the different regions of the stomach were 2.8, 1.7, and 1.5, respectively. The percentage of time pH was above 4 in the cardia, proximal stomach, and distal stomach were 18.5%, 0%, and 0%. Following nitrate, the percentage of time pH was above 4 were 23%, 0%, and 0% at the respective sites.
Nitrite
Prior to nitrate administration, nitrite concentration within the stomach was low, being 7.6 (2.7) μM at the cardia, 0.4 (0.3) in the proximal stomach, and 0 (0.1) μM in the distal stomach. Although there was a trend towards higher levels at the cardia, this was not statistically significant. Following nitrate administration, nitrite concentration increased significantly at the cardia to 45.5 (12.7) μM (p<0.01) but showed no significant change in the proximal or distal stomach (fig 3). Following the nitrate meal, nitrite concentration at the cardia was higher than in the proximal or distal stomach (p<0.01).

Concentrations of nitrite, ascorbic acid, and thiocyanate in the stomach before and after a nitrate meal. The after nitrate sample was collected over the 40 minute period starting 40 minutes after nitrate administration. The horizontal lines represent mean concentrations. Outliers are indicated with values next to the symbols. Statistically significant differences are indicated: for nitrite, ††p<0.01 compared with the cardia before nitrate administration and compared with the proximal and distal stomach after nitrate; for ascorbic acid, **p<0.01 compared with the proximal and distal stomach both before and following nitrate.
The nitrite concentration in the cardia before nitrate (7.6 (2.7) μM) was lower than that in the distal oesophagus (29.1 (7.1) μM) (p<0.01). Following the nitrate meal, the nitrite concentration at the cardia (45.5 (12.7) μM) was again lower than that of the distal oesophagus (181.6 (26.4) μM) (p<0.01) (fig 3).
Ascorbic acid and total vitamin C
Prior to nitrate administration, ascorbic acid concentration was lower in the cardia at 14.9 (6.2) μM (p<0.01) than in the proximal (47.4 (13.8) μM) or distal (83.5 (27.3) μM) stomach (fig 3). Following nitrate, concentrations of ascorbic acid at the cardia, and proximal and distal stomach were unchanged at 13.0 (6.1) μM, 51.5 (19.2) μM, and 86.3 (29.3) μM, respectively (fig 3).
Before nitrate administration, total vitamin C concentration was also lowest at the cardia at 18.6 (7.0) μM (p<0.01) than in the proximal (55.9 (14.2) μM) or distal (84.9 (25.8) μM) stomach. Following nitrate, total vitamin C levels at all sites were non-significantly higher at 24.3 (8.4) μM, 87.2 (31.0) μM, and 112.9 (30.0) μM for the cardia, proximal stomach, and distal stomach, respectively.
Prior to nitrate administration, the median ratio of ascorbic acid to total vitamin C was 0.65 in the cardia, 0.73 in the proximal stomach, and 0.76 in the distal stomach. Following nitrate, the mean ratio fell non-significantly to 0.46, 0.54, and 0.60 for the cardia, proximal stomach, and distal stomach, respectively.
Thiocyanate
Prior to nitrate administration, thiocyanate concentrations were similar in the cardia, proximal stomach, and distal stomach at 628 (111) μM, 645 (102) μM, and 648 (104) μM, respectively (fig 3). They did not change following nitrate administration. Thiocyanate concentration in the stomach was about 80% of that in the oesophagus and about 50% of that in saliva.
Ratio of ascorbic acid to nitrite
Prior to nitrate administration, the ratio of ascorbic acid to nitrite (median, range) was much lower in the cardia (1.5, 0.2–112) (p<0.01) than in the proximal (20.8, 3.7–193) or distal (27.7, 7–351) stomach (fig 4). Following nitrate, the ratio at the cardia fell to 0.3 (0–108) (p<0.02 v cardia before nitrate), but the ratio in the proximal (7.8, 0–264) and distal (40, 0.7–428) stomach remained unchanged (fig 4).

Ratio of ascorbic acid to nitrite in the different regions of the stomach before and after nitrate, using a logarithmic scale. The after nitrate sample was collected over the 40 minute period starting 40 minutes after nitrate administration. ††p<0.01 compared than the proximal and distal stomach before nitrate; **p<0.02 compared with the cardia before nitrate, and compared with the proximal and distal stomach after nitrate (p<0.01).
DISCUSSION
Previous studies have examined the concentrations of chemicals relevant to luminal nitrosation in saliva and aspirated mixed gastric juice.22,35 We have extended previous work by measuring their luminal concentrations in different anatomical regions of the upper gastrointestinal tract. This shows that the most proximal cardia region of the stomach has the chemical conditions most favourable for luminal generation of N-nitroso compounds.
Concentrations of both nitrite and thiocyanate were found to be high in the distal oesophagus and similar to those in saliva. Nitrite concentration in the oesophagus increased approximately sixfold following nitrate ingestion consistent with it originating from the enterosalivary recirculation of nitrate and its reduction by buccal bacteria.14–16 The high concentrations of nitrite and thiocyanate in the oesophagus may be largely due to swallowing as well as diffusion distributing these anions produced in the mouth throughout the oropharyngeal-oesophageal cavity. Nitrate and thiocyanate are secreted by many exocrine glands36,37 and may therefore be secreted by the oesophageal submucosal glands. In addition, there may be reduction of nitrate to nitrite within the oesophageal lumen by bacterial nitrate reductase activity known to be present in aspirated saliva.38
Concentrations of both nitrite and thiocyanate measured in the saliva sample obtained prior to insertion of the orogastric tube were, respectively, three times and two times higher than those measured in saliva when the tube was in place. This can be explained by the presence of the tube stimulating buccal secretions. Stimulation of salivary secretion has been shown to reduce the concentration of nitrate and nitrite in saliva.15 However, the output of nitrate increases on stimulation and more nitrate may be reduced to nitrite during mechanical stimulation.39
Our studies have also demonstrated that there are marked differences in the concentrations of nitrite and ascorbic acid in different anatomical regions of the stomach. Under fasting conditions, little nitrite was detected in the stomach. However, following nitrate ingestion, the nitrite concentration increased in the most proximal cardia region of the stomach but showed no significant rise in the mid or distal stomach. Consequently, the nitrite concentration after nitrate ingestion was highest in the gastric cardia.
The observation that the nitrite concentration was highest in the cardia region of the stomach is consistent with the fact that nitrite enters the acid secreting stomach via the oesophagus which opens into the gastric cardia. When this nitrite passes into the more distal stomach, its concentration will fall due to dilution by gastric juice. In addition, acidic gastric juice containing ascorbic acid rapidly converts nitrite to nitrous acid and nitric oxide and the latter will rapidly diffuse into the surrounding epithelium.25,40
Concentrations of ascorbic acid and total vitamin C also showed marked intragastric regional variations both being lower in the cardia region than in the mid or distal stomach. This pattern was apparent both before and following nitrate ingestion.
The reason for the concentration of ascorbic acid and total vitamin C being lowest in the most proximal cardia region of the stomach is unclear. Vitamin C present in fasting gastric juice is believed to be due to its active secretion by the gastric mucosa.19,20 The cells responsible for secreting the vitamin into gastric juice are not known but biopsies from different regions of the stomach have shown that the mucosa levels of vitamin C are highest in the antrum.41
In contrast with nitrite and ascorbic acid, there was no gradient in the intragastric concentration of thiocyanate with substantial concentrations being present throughout the stomach. The concentration of thiocyanate in the stomach was 80% of that in the oesophagus and 50% of that in saliva.
The fact that the cardia region of the stomach had both the highest nitrite concentration and lowest ascorbic acid concentration meant that the ratio of ascorbic acid to nitrite was markedly lower in the cardia than in the more distal stomach. Before nitrate administration, the median ascorbic acid to nitrite ratio at the cardia was 1.5 versus 20.8 in the mid and 27.7 in the distal stomach. After nitrate, the ratio in the cardia was only 0.3 compared with 7.8 in the mid and 40 in the distal stomach. The ratio of ascorbic acid to nitrite is a critical determinant of acid nitrosation.23,24 When ascorbic acid is in excess of nitrite, acid nitrosation is prevented.23,24 These observations indicate that the potential for intragastric acid catalysed luminal nitrosation will not be uniform throughout the length of the stomach but will be maximal in the most proximal cardia region. At this location, intragastric nitrite is maximal, intragastric ascorbic acid minimal, and thiocyanate is available to catalyse the nitrosation process.
The clinical significance of our observations is that the anatomical location of maximal potential for acid catalysed luminal nitrosation corresponds with the location of the highest incidence of epithelial mutagenesis within the healthy acid secreting stomach.1–3 It is tempting to propose that luminally generated N-nitroso compounds may be contributing to the high incidence of metaplasia and neoplasia at the gastric cardia. N-nitroso compounds can rapidly diffuse into the adjacent epithelium42 and therein be metabolically activated to powerful DNA alkylating agents.43,44 In addition, many N-nitroso compounds are unstable45 and therefore their epithelial effects will be maximal nearest their site of formation.
The findings of our current study are consistent with our previous observation that nitric oxide levels are maximal at the gastric cardia.26 In the present study, the concentration of nitrite was similar in buccal saliva and down as far as the distal oesophagus but then fell substantially on entering the gastric cardia. The fall in nitrite concentration between the distal oesophagus and cardia can be explained by the acidic gastric juice and its ascorbic acid content converting nitrite to nitric oxide.
Observations in our earlier study together with those of our present study indicate that two distinct luminal mechanisms both potentially leading to epithelial DNA damage are occurring maximally at the most proximal cardia region of the acid secreting stomach (fig 5). The first involves generation of high luminal concentrations of nitric oxide arising from the reaction between salivary nitrite and gastric juice ascorbic acid. This nitric oxide will diffuse into the adjacent epithelium and within the cells form nitrosating species which can directly and indirectly damage DNA.46 The second mechanism which is reported in the present study involves the generation of nitrosating species within the lumen due to the acidification of nitrite in the absence of adequate ascorbic acid. These nitrosating species formed in the lumen may react with nitrogenous compounds present in the lumen to form N-nitroso compounds which may then diffuse into the epithelial cells to damage DNA. The first mechanism is promoted by the presence of ascorbic acid whereas the second is promoted by the lack of ascorbic acid. Both mechanisms may operate maximally at this site although not simultaneously. When a bolus of nitrite laden saliva enters the cardia the ascorbic acid will convert much of it to nitric oxide. In the process, ascorbic acid will be consumed leading to the second mechanism now occurring at that same site. A common factor driving both processes is the delivery of nitrate derived nitrite into the acidic cardia region of the stomach.

Chemical reactions occurring when nitrite enters acidic gastric juice. Nitrite is converted to nitrous acid and nitrosating species, including nitrosothiocyanate. In the absence of ascorbic acid, these can react with nitrososatable species to form N-nitroso compounds which may diffuse into the adjacent epithelium. Ascorbic acid in gastric juice prevents this luminal nitrosation by converting the nitrosating species to nitric oxide. However, nitric oxide can diffuse into the adjacent epithelium and there react with oxygen to reform nitrosating species and N-nitroso compounds. In the acid secretory stomach, both these pathways of N- nitroso compound generation operate maximally at the gastric cardia. GO, gastro- oesophageal.
Further studies are required to determine whether this nitrate derived nitrosative chemistry focused at the most proximal cardia region of the acid secreting stomach is contributing to the high incidence of mutagenesis at this anatomical site.
Acknowledgments
This study was funded by a grant from the Biomedical and Clinical Research Committee of the Scottish Home and Health Department.