Article Text

Abstract
Background and aims: There are conflicting reports on the role of azathioprine (AZA) thioguanine nucleotide (TGN) metabolites in optimising therapy for inflammatory bowel disease (IBD). The aim of this study was to investigate TGN intrapatient variation, and the relationship between TGN concentrations and disease activity in IBD patients taking long term constant dose AZA.
Methods: TGN and methylmercaptopurine nucleotide (MeMPN) concentrations were measured at intervals over a two year period. Disease activity was assessed at each clinic visit using the Crohn’s disease activity index or Walmsley simple index for ulcerative colitis.
Results: Serial TGNs were measured in 159 patients (3–14 TGN assays, median 6). Intrapatient variation in TGN concentrations was 1–5-fold (median 1.6); the incidence of non-compliance was 13%. At the end of two years, 131 patients were evaluable at TGN steady state. Of this group, patients who remained in remission had significantly higher mean TGN concentrations than those patients who developed active disease (median TGNs 236 v 175, respectively; median difference 44 pmol (95% confidence interval 1–92); p = 0.04). MeMPN concentrations were not related to AZA efficacy or toxicity.
Conclusions: This study has shown that lower TGN concentrations were linked to the development of active disease, and that TGNs may act as useful markers of compliance. However, it is clear that repeat TGN measurements are required for an unambiguous index of active metabolite exposure. In view of the high intrapatient variability in TGN production over time, TGN measurements may not be currently advocated for routine clinical use.
- ALT, alanine aminotransferase
- 5-ASAs, 5-amino salicylic acids
- AZA, azathioprine
- CDAI, Crohn’s disease activity index
- IBD, inflammatory bowel disease
- MeMPN, methylmercaptopurine nucleotide
- 6MP, mercaptopurine
- RBC, red blood cell
- TPMT, thiopurine methyltransferase
- TGN, thioguanine nucleotide
- azathioprine
- thioguanine nucleotides
- inflammatory bowel disease
- 5-aminosalicylic acid
- 6-mercaptopurine
- methylmercaptopurine nucleotides
Statistics from Altmetric.com
- ALT, alanine aminotransferase
- 5-ASAs, 5-amino salicylic acids
- AZA, azathioprine
- CDAI, Crohn’s disease activity index
- IBD, inflammatory bowel disease
- MeMPN, methylmercaptopurine nucleotide
- 6MP, mercaptopurine
- RBC, red blood cell
- TPMT, thiopurine methyltransferase
- TGN, thioguanine nucleotide
- azathioprine
- thioguanine nucleotides
- inflammatory bowel disease
- 5-aminosalicylic acid
- 6-mercaptopurine
- methylmercaptopurine nucleotides
Azathioprine (AZA) was synthesised in 1957 as a slow release formulation of mercaptopurine (6MP), and has now been used for over four decades in the treatment of inflammatory bowel disease (IBD). AZA is widely used in IBD patients who are steroid dependent, steroid refractory, have chronic active disease, or require maintenance of remission. The use of AZA to reduce the requirement for steroid therapy1–3 has also led to a reduction in relapse rate.4,5
After one oral dose, AZA rapidly degrades to 6MP and an imidazole derivative, but up to 12% of a dose can be split to form the purine base hypoxanthine and thioimidazole.6,7 Three enzymes compete to metabolise 6MP: xanthine oxidase, thiopurine methyltransferase (TPMT), and hypoxanthine phosphoribosyltransferase (fig 1). 6MP activation, catalysed by hypoxanthine phosphoribosyltransferase, forms initially the 6MP nucleotides and eventually the active metabolites, the thioguanine nucleotides (TGNs). TGN metabolites of 6MP act as purine antagonists and inhibit DNA, RNA, and protein synthesis, inducing cytotoxicity and immunosuppression. It has been suggested that AZA immunosuppression is due to the binding of a TGN (thioguanine triphosphate) to the guanine triphosphate binding protein Rac1 instead of guanine triphosphate. Rac1 activation is suppressed and apoptosis induced. This mechanism is thought to control elimination of activated lymphocytes.8 Cytotoxicity is due, in part, to the direct incorporation of TGN metabolites into DNA.9 The initial 6MP nucleotides are also substrates for TPMT, producing methylmercaptopurine nucleotides (MeMPNs). MeMPNs are potent inhibitors of de novo purine synthesis, which may potentiate the effects of TGNs by preventing synthesis of purine bases. In addition, MeMPNs have been implicated in the hepatotoxic effects of thiopurines10,11

Azathioprine (AZA) metabolism. The initial step in mercaptopurine (6MP) nucleotide metabolite formation is catalysed by hypoxanthine phosphoribosyltransferase (HPRT). Further metabolism of mercaptopurine nucleotide results in the eventual formation of thioguanine nucleotides (TGNs). Oxidation catalysed by xanthine oxidase (XO), and methylation catalysed by thiopurine methyltransferase (TPMT), compete with TGN formation.
Inherited variations in TPMT activity determine the patient’s ability to form TGN active metabolites after a dose of 6MP or AZA.12 Those individuals with high TPMT activity produce lower TGNs and have a poor therapeutic response to standard doses of 6MP. Individuals who lack functional TPMT activity produce grossly elevated concentrations of TGNs and experience profound myelosuppression.13,14 In early antimetabolite based protocols for the treatment of childhood leukaemia, those children who accumulated higher TGN concentrations had significantly better leukaemia free survival.15
These and other studies of thiopurine use in childhood leukaemia16 provided the momentum for parallel studies in IBD.10,17–20 To date, studies on AZA metabolite concentrations in IBD patients have reported conflicting findings. A number of studies have reported that higher TGN concentrations are associated with remission in IBD,10,18,21 but other research groups have not confirmed these findings.22 In patients established on AZA, there is no clear evidence to suggest that TPMT is predictive of clinical response or drug toxicity.23
There is little information on steady state TGN concentrations in patients with IBD who are on long term constant dose AZA. Taking into consideration the variable breakdown of AZA, it is possible that the amount of 6MP available for active metabolite formation could vary from dose to dose in the same individual. The aim of this study was to establish the intraindividual variation in TGN concentrations in patients taking constant dose AZA. We evaluated mean steady state TGN and MeMPN concentrations in relation to disease activity, and investigated the influence of concomitant therapy on active metabolite concentrations. In addition, we used active metabolite concentrations to investigate the prevalence of non, or partial, compliance in this group of patients on long term oral AZA.
PATIENTS AND METHODS
Consecutive patients attending a single gastroenterology outpatient clinic at the Royal Hallamshire Hospital, Sheffield, were recruited into this prospective study. Patients recruited had been prescribed a constant dose of AZA for at least four months prior to the study. Patients were then followed for two years. Blood samples (10 ml lithium heparin) were taken for full blood count and red cell 6MP metabolite concentrations at 1–3 monthly intervals throughout the two year study period. Disease activity was evaluated at each clinic visit using established indices, the Crohn’s disease activity index (CDAI)24 and Walmsley simple index for ulcerative colitis.25 Remission was described as those with a CDAI below 150, or a simple index score of less than 5. Other clinical data collected included sex, age, age at diagnosis and site of disease, weight, dose of AZA, age at start of AZA therapy, reason for AZA therapy, concomitant therapy, and toxicity data, including full blood counts and liver function tests. Patient information, including disease activity scores, were collected by a clinician. Throughout the study the clinical investigators remained blinded to the 6MP metabolite concentrations. AZA was prescribed as Imuran (25 mg tablets) or generic AZA (50 mg tablets). The study was approved by the South Sheffield Ethics Committee and fully informed written consent was obtained from participating patients.
Red blood cell (RBC) TGNs and MeMPNs were measured by high performance liquid chromatography assay, as previously described.26 The lower limit of detection was 30 pmol/8×108 RBCs and all assays were performed in duplicate. Assay precision was measured using a patient quality control, prepared using pooled RBCs, and stored at −80°C. An aliquot was defrosted for each assay and treated in parallel with each batch of patient samples.
Intrapatient variability in the accumulation of TGN active metabolites was investigated using the variation in the pooled patient quality control sample (that is, assay only variation) as a reference point. Taking into consideration the possible intrapatient variation in the breakdown of AZA to 6MP, the metabolite steady state group was defined as: those patients in whom repeat measurements of TGN concentrations varied by less than twice the variation in the patient quality control sample.
Calibration graphs were constructed by spiking control RBCs with a thioguanine stock solution ranging from 0 to 100 ng (600 pmol) and methylmercaptopurine in a range of 0 to 1000 ng (6000 pmol) per 8×10⁸ RBCs (approximately 100 µl packed cells). Accuracy was determined by including a 50 ng (300 pmol) thioguanine spiked red cell sample in all assays. Throughout, the values quoted for metabolite concentrations are pmol/8×108 RBCs.
Statistical analysis was performed using Minitab V13 (Minitab Inc, USA). Statistical comparisons were performed using the Mann-Whitney test for unpaired values and the Kruskal-Wallis test for three or more unpaired values, and correlations were assessed by the rank Spearman correlation coefficient. All tests were two tailed and p was significant at 0.05.
RESULTS
Study group
A total of 159 patients (88 men, 71 women) with IBD (105 Crohn’s disease, 46 ulcerative colitis, and eight indeterminate colitis) were recruited into the study from 170 patients on long term constant dose AZA therapy (nine patients did not wish to participate, one patient could not be contacted, and one patient died of a myocardial infarction within three months of the study start). Duration of constant dose AZA therapy was 1–22 years (median 4). Patient details are summarised in table 1.
Characteristics of the 159 patients treated with azathioprine (AZA)
Metabolite assays
Steady state group
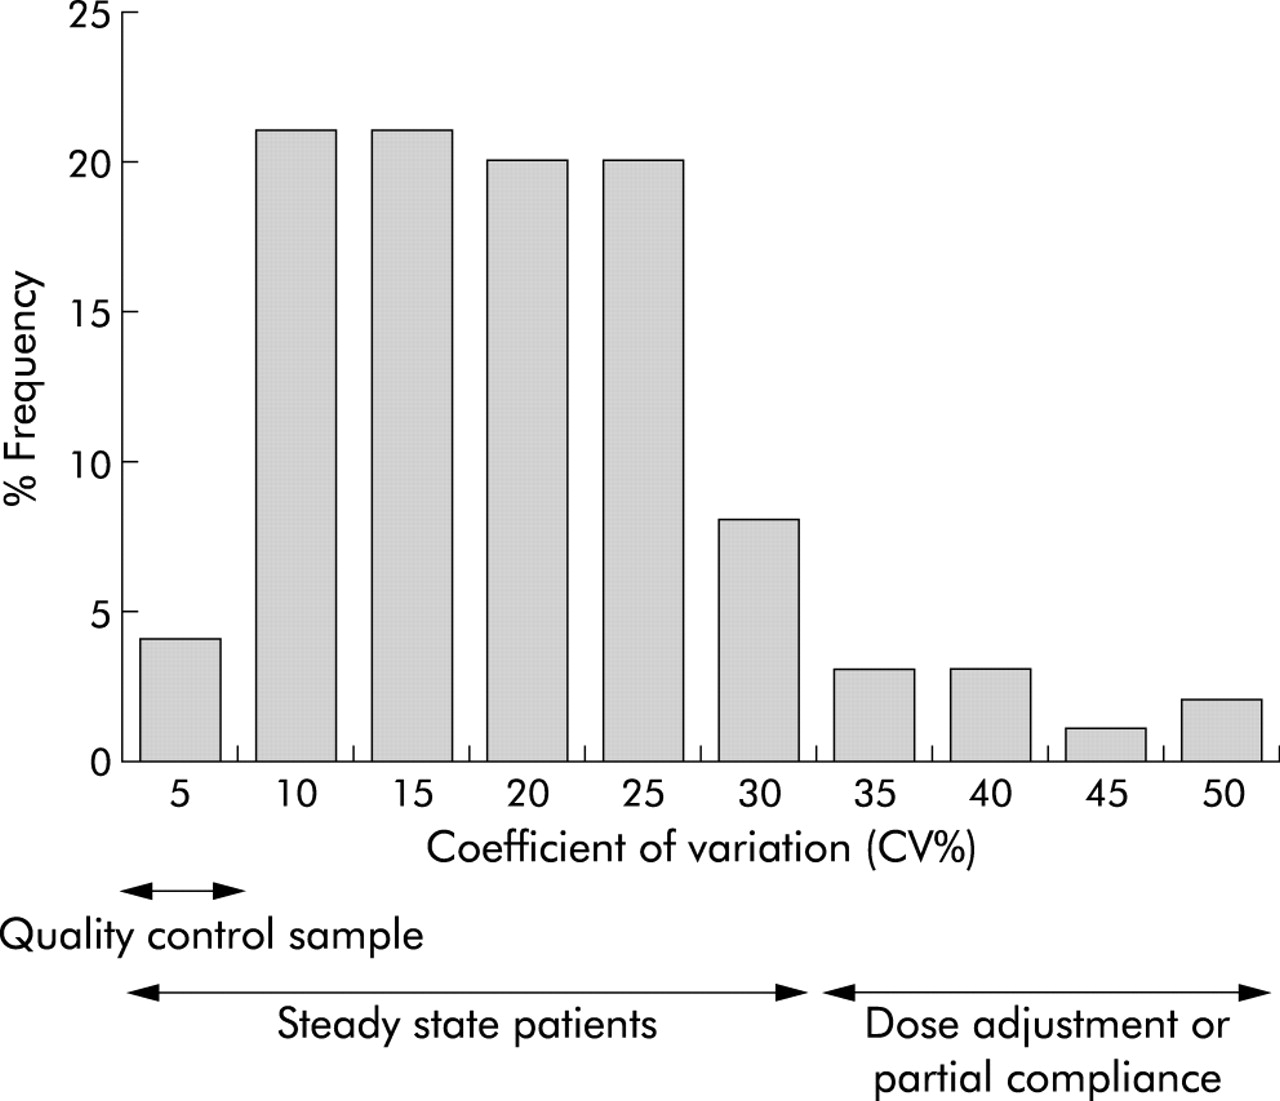
A total of 156 of 159 recruited patients had three or more metabolite assays over a two year study period (range 3–14 assays (median 6)). For 31 patients with three or four assays, average metabolite concentrations were used in all analysis. For those patients with five or more assays, mean and coefficient of variation (SD/mean×100%) for “steady state” TGN concentrations was calculated. In the 125 patients who had multiple assays, the coefficient of variation ranged from 6% to 50% (median 17%), and TGN concentrations by 1.1–5-fold (median 1.6-fold) (fig 2). For comparison, the quality control pooled patient sample, which was included in 26 assays over six months, gave a coefficient of variation of 7.5%. TGNs varied by 1.4-fold. In addition, MeMPNs, measured alongside TGNs in the same pooled patient sample, gave a coefficient of variation of 9% and varied by 1.4-fold.

Coefficient of variation for 125 patients with five or more thioguanine nucleotide (TGN) assays. Interassay variation in TGN measurement was 7.5%, as defined by the quality control pooled patient sample. Only 4% of patients had a coefficient of variation of less than 7.5%.
Only four patients (3.2%) had a coefficient of variation of less than or equal to the patient quality control sample. The TGN steady state group, defined as a metabolite variation less than twice the variation in the patient quality control sample, were those patients in whom RBC TGNs varied by less than threefold. Therefore, at the end of the two years, two groups were apparent: a steady state group of 111 patients whose TGN metabolite concentrations varied <3-fold and a variable metabolite group of 45 patients whose TGN concentrations varied by >3-fold.
In the steady state group, individual mean TGN concentrations (in pmol/8×108 RBCs) ranged from 70 to 717 (median 235), and mean MeMPNs (in pmol 8×10⁸ RBCs) ranged from 30 to 12517 (median 1065). In these 111 patients, AZA dosage ranged from 0.4 to 2.8 mg/kg (median 1.8).
Variable metabolite group
The remaining 45 patients had a greater than threefold variation in TGN concentrations. Within this group, 20 patients (13% of the 156 patient study group) showed evidence of non-compliance (nil metabolites). The remaining 25 patients with greater than threefold variation in TGN concentrations had dosage adjustments during the study period. Twenty patients had dose increments: 19 due to active disease and one due to rheumatoid arthritis. Five patients had dosage decreases: one with active disease, two in prolonged remission, and two who developed neutropenia (neutrophil counts 1.96 and 1.78×10⁹/l).
Outcome
Twenty patients developed active disease during the study and underwent AZA dose adjustments, 15 patients achieved remission, and five patients continued with active disease, of which one underwent surgery. This latter patient had a dose decrease. In these 20 patients mean metabolite concentrations, prior to dose adjustment, were used to calculate steady state TGN concentrations (these patients had a median of five assays (range 5–9) prior to dose adjustment; intraindividual TGN values varied by <3-fold). These patients were included with the 111 steady state patients, and therefore the steady state group increased to 131 patients.
At the end of the two year study period, of this group of 131 patients, 104 remained in remission (79%) and 27 had developed active disease (21%, seven patients in the initial “steady state” group and 20 with dose adjustments). Metabolite concentrations are summarised in table 2. Those patients who developed active disease (median TGNs 175 pmol) accumulated significantly lower TGN concentrations than those who remained in remission (median TGNs 236 pmol) with a median difference of 44 pmol (95% confidence interval (CI) 1–92) (p = 0.04). There was no significant difference in AZA dosage, nor was there a correlation between dose and TGN concentrations (rs = 0.1) (fig 3). In addition, at follow up, seven of the 20 nil metabolite non-compliance patients had developed active disease.
Comparison of metabolite and dosage concentrations for 131 steady state patients.
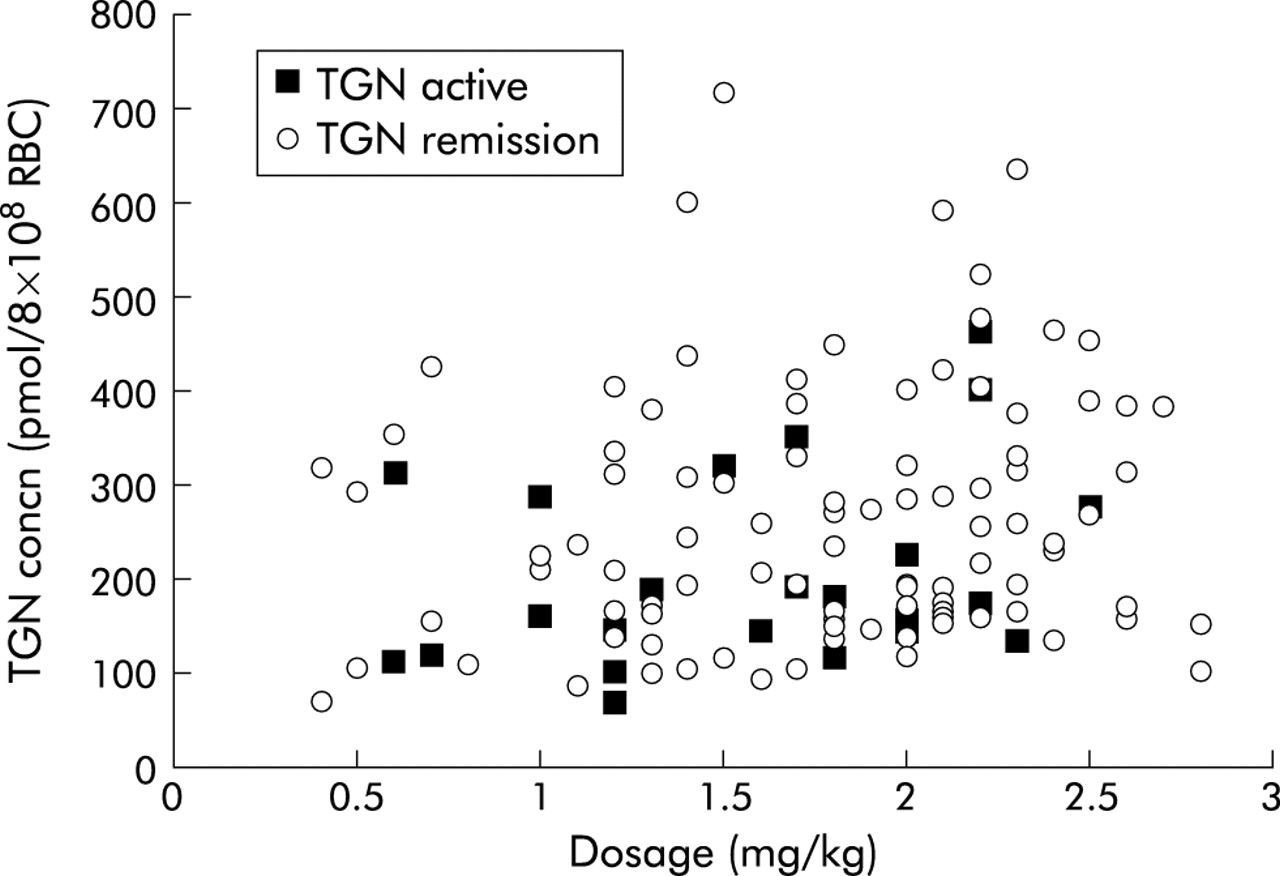
Correlation between thioguanine nucleotide (TGN) concentrations and azathioprine dose (rs = 0.1) in patients in remission and in those who developed active disease.
In 19 patients who underwent dose escalation due to disease activity, 15 achieved remission. Post escalation TGN concentrations ranged from 114 to 487 pmol (median 193) in those who achieved remission compared with from 66 to 571 pmol (median 138) in the four patients with active disease; a median difference that was not significant in this small patient group. The patient with active disease and elevated TGNs (571 pmol) required prednisolone escalation to 35 mg to control disease activity. This patient had UC for 12 years prior to the start of AZA. Duration of AZA prior to the start of this study was seven months. At the end of the study he was awaiting colectomy.
Accumulation of MeMPN metabolites in the 131 steady state patient group ranged from 30 to 14267 pmol (median 1036). Comparison of mean MeMPN metabolite concentrations measured in those patients who remained in remission and those who developed active disease were not significantly different (median difference 84 pmol (95% CI −342 to 492); p = 0.66) (table 2).
At the end of the two year study period, liver function test information was collated. Data were available for 123 (94%) of the 131 steady state patients. Alanine aminotransferase activities (ALTs) were within the normal range for 102 patients; four patients had ALTs constantly above the upper normal limit of 30 IU/l while 17 patients had transient elevations above 30 IU/l. There was no difference in the range of mean MeMPN concentrations between those patients who experienced elevated ALTs (range 113–14173 pmol MeMPN (median 702)) and those who did not (range 0–14267 pmol MeMPN (median 1027)). Only one patient had ALTs above 100 IU/l (range 105–120 (median 113)) throughout the study period. MeMPN concentrations measured at the same time as ALTs ranged from 7540 to 11119 pmol (median 7798, mean 8564). The upper quartile MeMPN concentration for patients who had ALTs below 30 IU/l was 1984 pmol.
In conclusion, in the 131 steady state patients, higher TGN concentrations were associated with disease remission. However, over a two year period, steady state TGN concentrations varied up to threefold. This variation may not be detected by comparison of consecutive TGN assays. Repeat analysis of TGN measurements in the 131 steady state group, with a median of two months (range 1–6) between the first and second assays, showed no significant difference between the two concentrations. TGN concentrations for the initial measurements ranged from 51 to 684 pmol (median 215), and for the second measurement from 57 to 723 pmol (median 225), with a median difference of 2 pmol (95% CI −28 to 25) (p = 0.9).
Concomitant therapy
Within the total steady state patient group (n = 131), concomitant therapy information was available for 130 patients. The range for mean patient TGN and MeMPN metabolite concentrations were compared between patients taking: AZA monotherapy, AZA and 5-aminosalicylic acids (5-ASAs), AZA and steroids, and AZA, 5-ASAs, and steroids (triple therapy) (table 3). There was no significant difference in AZA dosage, TGN concentrations, or MeMPN concentrations in the four patient groups (Kruskal-Wallis, p = 0.9).
Metabolite concentrations of 130 steady state patients receiving concomitant therapy
Compliance
Twenty patients had metabolite profiles indicative of non- or partial compliance with oral AZA therapy. During routine monitoring of metabolites, 16 of these patients had both TGN and MeMPN metabolites below the limit of detection on at least one occasion. The remaining four patients had wide fluctuations in TGN concentrations (3–6-fold). During the study period, seven of the non-compliant patients developed active disease, their mean TGN concentrations ranging from 25 to 180 pmol (median 112). These patients are indicated in fig 4.

Twenty patients with drug compliance problems. Patient Nos 1–16 had thioguanine nucleotide (TGN) metabolite concentrations below the level of detection (30 pmol) when taking long term constant dose azathioprine. During the study period, seven patients developed active disease (indicated by arrows).
DISCUSSION
In this study of patients taking long term constant dose AZA therapy, we observed wide intrapatient variation in TGN formation. There are a number of factors that can influence active metabolite formation from oral drug therapy. One major factor influencing TGN formation is the genetic regulation of the important drug metabolising enzyme TPMT. However, diurnal and long term variation in TPMT is low27 and therefore these factors should have minimal influence on metabolite production. Over time, variable drug absorption could influence metabolite production, especially in patients with IBD who do not have a healthy functioning bowel. In addition, the formulation of AZA could influence its absorption. It has been reported that patients treated with Imuran achieve higher TGN concentrations than those treated with generic AZA.28 However, although in this report the AZA dosage was similar in the two patient groups, patient numbers were too small to match for TPMT activity. Any patient with intermediate TPMT activity (11% of the population) would have produced higher TGN concentrations at any given dose of AZA. This may account, in part, for the apparent increase in TGN concentrations when taking Imuran versus generic AZA.
Elion and colleagues6 observed that approximately 12% of an AZA dose could be split to form hypoxanthine rather than 6MP. It is the biogenic thiols glutathione and cysteine which facilitate this crucial step of AZA metabolism.29 Cigarette smoke is a common oxidant, and glutathione is an antioxidant that is involved in the metabolism of tobacco smoke chemicals. Both smoking and age lower glutathione levels.30 Patients who smoke may have more variable AZA to 6MP breakdown.
In this study of 131 patients, each with multiple assays of RBC TGNs, we report that mean TGN concentrations of 236 pmol are associated with disease remission. This is in agreement with the initial report linking TGNs above 254 pmol with a clinical response in a small group of 25 patients.17 Over the subsequent years these observations have been supported by a number of reports with ever increasing patient numbers.10,18 Gupta and colleagues21 reported serial TGN measurements from the start of AZA therapy, and disease remission correlated significantly with TGN concentrations. The predicted probability of disease remission increased from 33% at 100 pmol TGNs to 66% at 500 pmol TGNs.21
However, a number of studies have failed to show a relationship between RBC TGN concentrations and disease remission.22,31 In the largest study to date, patients were invited to submit a single blood sample for measurement of TGNs, and disease activity was evaluated by an IBD questionnaire.22 Blood samples were received from 170 patients; TGN concentrations were 139 pmol in 56 patients with active disease compared with 131 pmol in 114 patients in remission, concentrations far lower than those reported in the studies above.
In agreement with other studies,10 our data showed that leukopenia was associated with elevated TGNs but this occurred in only a small proportion (2%) of patients on established AZA therapy. Likewise, we found no association between the concentration of MeMPN metabolites and disease activity.10,17,22 Elevated MeMPNs have been associated with the hepatoxic effects of AZA in a number of studies.10,11,17 In the present study, elevated liver function tests were recorded in 21 (16%) patients but for the majority of individuals hepatoxicity was mild. In the one individual with moderate toxicity (ALTs 4× the upper normal limit), MeMPNs were above the upper quartile MeMP, as were those of the 20 other patients who had ALTs constantly within the normal range, an observation also made by other groups.21
TGN and MeMP metabolite concentrations can be used to monitor compliance32. Twenty patients (13%), out of the total 156 patient group studied, showed evidence of non-compliance with their oral therapy. Seven of the 20 non-compliant patients developed active disease. Studies of compliance monitoring have reported that compliance rates can hover around 50%.33 The incidence of non-compliance in renal transplant patients taking AZA and in leukaemic children receiving 6MP has been reported to be 18% and 10%, respectively.34,35 This is strong evidence to suggest that partial compliance could also contribute to the variation in TGN metabolite concentrations in those patients in the steady state group.
The median AZA dose prescribed in this present study group was 1.8 mg/kg, which is far lower than the recommended dose of 2.5 mg/kg. Many patients were treated at 2.5 mg/kg, but this is viewed as a maximum rather than a starting dosage. At the start of therapy, AZA is introduced with caution; this is partly to avoid the occurrence of the well documented immediate side effects. If the patient remains in remission on a lower AZA dose, the AZA dose is increased no further. Secondly, the present study group were established on long term AZA therapy and therefore dosage reduction, due to falling cell counts, could have occurred in the past.
5-ASAs, commonly co-prescribed in IBD therapy, have been reported to inhibit TPMT and increase TGN concentrations.36,37 In the current study, co-prescription of 5-ASAs did not influence TGN concentrations. However, the influence of 5-ASAs may be more apparent in those patients with lower “intermediate” TPMT activities. The patients reported in this paper, on long term AZA therapy, could be self selected. This group could contain an excess of AZA tolerant patients with higher TPMT activities. Those patients with lower TPMT activities may have been withdrawn from AZA therapy in response to the higher frequency of leucopenia reported in this subgroup.10,22
This present study of intrapatient variation in TGN concentrations is the first report in a large patient group monitored throughout an extended period of time. Previous reports have been based on small patient numbers17,28,31 with simple repeat measurements.17,31 TGN variability was reported to be <10%. This study reports, in a steady state group of 131 patients, up to threefold intrapatient variation in TGN formation at constant dose AZA. Whether the combination of branded and generic AZA used in this present study was an additional contributory factor to TGN variability over time is unknown. This study shows that, due to intrapatient variability in TGN production and the high incidence of compliance problems, a single TGN reading may not be reflective of drug metabolism throughout what can be many years of oral AZA therapy. In view of the high intrapatient variability in TGN production over time, TGN measurements may not be currently advocated for routine clinical use.
Acknowledgments
The Sheffield Hospitals Charitable Trust supported these studies.