Article Text

Abstract
Objective Wnt/Tcf, Lgr5, Ascl2 and/or Bmi1 signalling is believed to define the mouse intestinal stem cell niche(s) from which adenomas arise. The aim of this study was to determine the relevance of these putative intestinal stem cell markers to human colorectal cancer.
Design 19 putative intestinal stem cell markers, including Ascl2 and Lgr5, were identified from published data and an evaluation of a human colorectal gene expression database. Associations between these genes were assessed by isotopic in situ hybridisation (ISH) in 57 colorectal adenocarcinomas. Multiplex fluorescent ISH and chromogenic non-isotopic ISH were performed to confirm expression patterns. The prognostic significance of Lgr5 was assessed in 891 colorectal adenocarcinomas.
Results Ascl2 and Lgr5 were expressed in 85% and 74% of cancers respectively, and expression was positively correlated (p=0.003). Expression of Bmi1 was observed in 47% of cancers but was very weak in 98% of cases with expression. Both Ascl2 and/or Lgr5 were positively correlated with the majority of genes in the signature but neither was correlated with Cdk6, Gpx2, Olfm4 or Tnfrsf19. Lgr5 did not have prognostic significance.
Conclusion These data suggest that 74–85% of colorectal cancers express a Lgr5/Ascl2 associated signature and support the hypothesis that they derive from Lgr5+/Ascl2+ crypt stem cells, not Bmi1+ stem cells. However, Olfm4 was not found to be a useful marker of Lgr5+ cells in normal colon or tumours. In this large series, Lgr5 expression is not associated with increased tumour aggressiveness, as might be expected from a cancer stem cell marker.
Statistics from Altmetric.com
Significance of this study
What is already known on this subject?
-
In the mouse, Lgr5 and Ascl2 mark intestinal stem cells and Lgr5+ cells transform more readily into adenomas than Lgr5− cells.
-
In the mouse, Bmi1 marks proximal intestinal stem cells and Bmi1+ cells transform more readily into adenomas than Bmi1− cells. Bmi1+ stem cells can compensate for the loss of Lgr5+ stem cells in mouse intestine.
-
EphB2 (associated with high Lgr5 and Ascl2 expression) has been reported as both a tumour suppressor in intestinal tumorigenesis, which confers a good prognosis, and as a marker of a tumour initiating cell population that confers a worse prognosis. Contrary to the above observation, colorectal cancers with a Wnthigh signature (including expression of Lgr5 and Ascl2) are reported to have a better prognosis.
-
Olfm4 has been used as a surrogate for Lgr5 expression in the mouse intestine, and these data have been extrapolated to studies of human colorectal cancer without validation.
Significance of this study
What are the new findings?
-
The majority of colorectal cancers express an Lgr5/Ascl2 associated stem cell signature, implying that they may arise from Lgr5+/Ascl2+ stem cells. However, irrespective of Lgr5 and Ascl2 expression, cancers express no or very little Bmi1, suggesting that Bmi1 may not have as prominent a role as Lgr5 or Ascl2 in the maintenance of colorectal cancers.
-
The Lgr5/Ascl2 associated intestinal stem cell genes were not preferentially expressed at the tumour/stroma interface in the majority (84–98%) of colorectal adenocarcinomas. Moreover, Lgr5 did not show reciprocal expression with the differentiation marker cytokeratin-20 in 74% of colorectal adenocarcinomas. This suggests that the tumour/stroma interface is not a Lgr5+ cancer stem cell niche.
-
Lgr5 expression was found not to be a prognostic factor in a large series of colorectal cancers (n=891). Lgr5 was negatively associated with deficient mismatch repair and B-raf mutations, suggesting that this subset of cancers may not derive from Lgr5+ crypt stem cells or have silenced Lgr5 expression.
-
Unlike in the mouse, Olfm4 is not a surrogate for Lgr5 in human colorectal cancer or normal human colon.
How might it impact on clinical practice in the foreseeable future?
-
The data suggest that Lgr5 and/or Ascl2 expression defines a major subpopulation of cancers that derive from intestinal crypt stem cells as a result of dysregulated Wnt signalling. As a transmembrane protein, Lgr5 may be a suitable target for therapeutic intervention in this subset of cancers, and understanding the expression pattern of Lgr5, but not Olfm4, is important for biomarker development.
-
Borderline expression of Bmi1 in colorectal cancer, and its lack of expression at the crypt base, suggests that Bmi1 is not relevant to colorectal tumorigenesis in the human and is not a suitable target for therapeutic intervention.
-
Lgr5 is not a prognostic factor, suggesting that it should not be used clinically to identify patients with a poor outcome who may derive greater incremental benefit from additional anticancer therapy.
Introduction
Intestinal epithelium undergoes rapid turnover and is continually replenished by a small number of stem cells present in a niche(s) close to the base of each crypt.1 The phenotype of these stem cells is dependent on the Wnt/β-catenin signalling pathway.2 ,3 Crypt stem cells have been implicated in the formation of colorectal adenomas4 and research on crypt stem cell biology has informed our understanding of colorectal cancer biology.5 Therefore, the accurate identification of intestinal crypt stem cells is important to permit the characterisation of putative progenitor cells of colorectal cancer and thereby develop our understanding of how best to prevent and/or treat this disease.
Van der Flier et al 6 used both a Wnt transcriptome analysis and in situ studies to identify a panel of 17 putative stem cell markers expressed at the crypt base. The two genes with the strongest relationship to Wnt signalling in this study were Lgr5 (leucine rich repeat containing G protein coupled receptor 5) and achaete-scute like 2 (Ascl2).6 Barker et al localised Lgr5 to the crypt base of mouse small intestine and demonstrated that Lgr5 labelled cells were able to differentiate into all epithelial cell lineages.4 Ascl2 expression was reported to co-localise with Lgr5, and expression of an Ascl2 transgene was associated with an expansion of cells with a stem cell-like genotype.7 Deletion of Ascl2 was associated with loss of stem cells intercalating with Paneth cells.7 This suggests that Lgr5 and Ascl2 may be intestinal stem cell markers. Transcriptional profiling of mouse intestinal epithelial cells with high and low/null expression of Ascl2 and Lgr5 identified overlapping subsets of genes that were selectively expressed at the crypt base.7 Thus three overlapping putative intestinal stem cell signatures have been described, associated with Wnt/Tcf signalling, Lgr5 expression and Ascl2 expression.
In addition to the putative stem cell niche located between the Paneth cells of the small intestine, another putative stem cell niche has been proposed at position +4 relative to the base of the crypt.8 ,9 Sangiorgi et al observed that Bmi1 was specifically expressed by cells at position +4 in proximal mouse small intestine and that these cells could give rise to all small intestinal epithelial cell types.10 Knockdown of Bmi1 resulted in crypt loss, consistent with a functional role for Bmi1 in defining small intestinal stem cells in the mouse.10 Bmi1 expression is reported not to affect expression of Ascl2 or a putative Lgr5 stem cell marker, Olfm4 (olfactomedin-4),7 ,11 and it is likely that Bmi1 labels a distinct population of cells from Lgr5.
To date, much of the work on intestinal stem cells has focused on mouse small intestine where Wnt signalling has an important role in crypt homeostasis and adenoma formation. Inferences are made regarding the relevance of this work to the majority of human colorectal cancers that show hyperactivation of Wnt signalling. However, while there is evidence from mouse models that Lgr5+ 4 and/or Bmi1+ 10 stem cells give rise to adenomas, there is insufficient direct evidence that these stem cells give rise to human colorectal adenocarcinomas. The aim of this study was to assess the association between numerous reported intestinal stem cell markers in human colorectal cancer in situ. The expression patterns of the stem cell markers were also evaluated, together with the prognostic significance of Lgr5, to determine whether the signature may mark a subpopulation of ‘cancer stem cells’ that are associated with an adverse outcome.
Materials and methods
Selection of putative stem cell markers
The panel of genes under investigation was chosen to reflect several lists of putative intestinal stem cell markers. Genes were selected from published analyses of Wnt/TCF,6 Lgr57 and Ascl27 target genes. In addition, the GeneLogic database of Affymetrix HG-U133 expression data (Gaithersburg, Maryland, USA) was used to identify the top 100 genes that showed the greatest covariance in expression with Ascl2 or Lgr5 in n=460 colorectal tissues. The final panel of 19 genes was selected to represent genes that were prevalent in several lists (eg, EphB3), genes that were found in only one source (eg, Fam84A/Nse1) or only one type of analysis (eg, Olfm4, found in mouse transcriptome analyses only). In addition, following a broad literature search for intestinal stem cell markers (Pubmed, articles from 1990 onwards, including terms ‘colorectal’, ‘colon’, ‘intestine’, ‘stem cell’), the gene Bmi1 was also included. The final list of 19 genes and their sources is shown in table 1.
Panel of putative intestinal stem cell markers
Human tissue
To evaluate expression of the intestinal stem cell signature, n=57 primary colorectal adenocarcinomas were acquired from multiple sources (Asterand, Detroit, Michigan, USA; Bio-Options, Fullerton, California, USA; University of Michigan, Ann Arbor, Michigan, USA; Cytomyx, Rockville, Maryland, USA; Cooperative Human Tissue Network, Nashville, Tennessee, USA; Indivumed, Hamburg, Germany; ProteoGenex, Culver City, California, USA). Forty-four per cent of cases were male with an average age of 66 years (range 31–93 years). Tissue microarrays (TMAs) were assembled using duplicate cores, as previously described,12 including five normal colorectal mucosa samples from matched cases. An additional n=38 primary colorectal adenocarcinomas (derived from the aforementioned sources) with K-ras, N-ras and B-raf mutation data (sequencing details available from the authors on request) were chosen to examine the relationship between these genes and Lgr5 expression by isotopic in situ hybridisation (ISH). Non-isotopic ISH and immunohistochemistry experiments to further examine the colocalisation of Lgr5, Olfm4, cytokeratin-20, EphB2 and β-catenin were performed on whole sections from n=37 colorectal adenomas and n=31 colorectal adenocarcinomas (derived from the aforementioned sources).
To evaluate the prognostic significance of Lgr5 expression, a population based series of patients who had undergone surgical resections for colorectal adenocarcinoma was compiled retrospectively from the pathology archives at St James' University Hospital (Leeds, UK) from 1988 to 2003. Patient demographics and treatment information were obtained from clinical records. Morphology, site, Dukes' stage, grade of differentiation, number of lymph nodes retrieved and number of positive lymph nodes were compiled from the surgical pathology reports. Survival data were obtained from the Northern and Yorkshire Cancer Registry and Information Service (St James' University Hospital). Mismatch repair status was determined as previously described.13 Inclusion of patients into this cohort was dependent on the availability of archival material and outcome data. TMAs were constructed as above with one core of normal mucosa and three cores of adenocarcinoma per patient. Approval for the use of this tissue was provided by the local research ethics committee.
Immunohistochemistry
Immunohistochemistry for β-catenin was performed using a mouse monoclonal antibody (clone 14; BD Pharmingen, San Diego, California, USA), as described previously.14 The presence of chromogen was scored positive or negative in the membrane, cytoplasm and nucleus of colorectal cancer cells in each core. Immunohistochemistry for EphB2 was performed using a goat polyclonal antibody (R&D Systems, Minneapolis, Minnesota, USA) at a fivefold lower dilution than described previously to accentuate differences in expression between subpopulations of tumour cells.14 Immunohistochemistry for cytokeratin-20 was performed using the mouse monoclonal Ks20.8 antibody (Dako, Carpinteria, California, USA) at 2.5 μg/ml, following antigen retrieval with proteinase K (Dako) for 6 min at room temperature. Immunocomplexes were labelled with biotinylated horse antimouse antibody, an ABC-HRP complex and diaminobenzidine, against a nuclear haematoxylin counterstain.
Isotopic ISH
This method has been described in detail elsewhere.15 Primer and probe sequences are detailed in supplementary table 1 (available online only). ISH for β-actin was used to confirm mRNA integrity in all colorectal cancer tissues prior to analysis. The intensity of silver grain deposition was scored by a pathologist in the tumour cells from each core on a semiquantitative scale of 0 (no expression) to 3 (very intense expression). The greatest score among duplicate cores was used for further analyses. Sense probes were used to control for the specificity of hybridisation. ISH on whole sections from a proportion of colorectal cancers was performed to confirm the relevance of the TMA scores to the rest of the tumour.
Multiplex fluorescent ISH
Multiplex ISH for Olfm4, Ascl2 and Lgr5 was performed by Advanced Cell Diagnostics (Hayward, California, USA) using their proprietary RNAScope technology.16 Details are provided in the supplementary methods (available online only).
Chromogenic non-isotopic ISH
Non-isotopic ISH for Lgr5 and Olfm4 was performed with Dig labelled probes and multiple rounds of antibody/enzymatic amplification. Details are provided in the supplementary methods (available online only). Expression was scored positive if the marker was present in >10% of cells in the tissue under examination. Comparison of expression patterns was performed by sequential comparison of serial sections. Probe sequences are detailed in supplementary table 2 (available online only).
Statistics
Spearman's correlation coefficient was used to assess the statistical significance of correlations between continuous data. The χ2 and Fisher's exact tests were used to assess associations between categorical data. The Student's t test and the Wilcoxon test were used to evaluate differences in the means or medians between subsets of continuous data, respectively. The false discovery rate controlling procedure (with a threshold false discovery rate <0.05) was used to correct for multiple hypothesis testing.17
In prognostic analyses, the predetermined frequency of Lgr5 expression was used in power calculations (power 0.80, α=0.05), revealing that a minimum of 459 events would be required to demonstrate a HR of 0.75, and 762 events would be required to demonstrate a HR of 0.80. This cut-off point was chosen as it reflected the greatest difference in Lgr5 expression levels (between scores 1 and 2) and provided subsets of sufficient size to permit meaningful analyses. Data were also evaluated as continuous variables to ensure that trends in prognostic significance were not missed. Overall survival was defined as the time from diagnosis to death from any cause for the duration of follow-up. Univariate survival analyses included non-parametric Kaplan–Meier estimates of median survival and proportional hazards estimates with the Cox model. Multivariate analyses utilised the Cox proportional hazards model. Missing data were omitted from analyses. Prognostic analyses were performed using the R language for statistical computing, V.2.13.2 for Mac OS X. These analyses meet the REMARK criteria for prognostic biomarker studies.18
Results
Frequency and expression patterns of putative intestinal stem cell signature genes
Frequency data for each of the mRNA transcripts evaluated by ISH are detailed in table 2, with representative examples in figures 1 and 2, and in supplementary figures 1 and 2 (supplementary figures 1 and 2 are available online only). The majority of markers were expressed in >50% of colorectal cancers, except Bmi1 and Tnfrsf19, which were observed in 47% and 15% of cancers, respectively. Both Lgr5 and Ascl2 were strongly and frequently expressed in colorectal cancer, observed in 74% and 85% of cancers, respectively. Of 53 cases with data for β-catenin, 29 showed nuclear immunoreactivity, 51 showed membranous immunoreactivity and 35 showed cytoplasmic immunoreactivity.
In situ hybridisation scoring frequencies
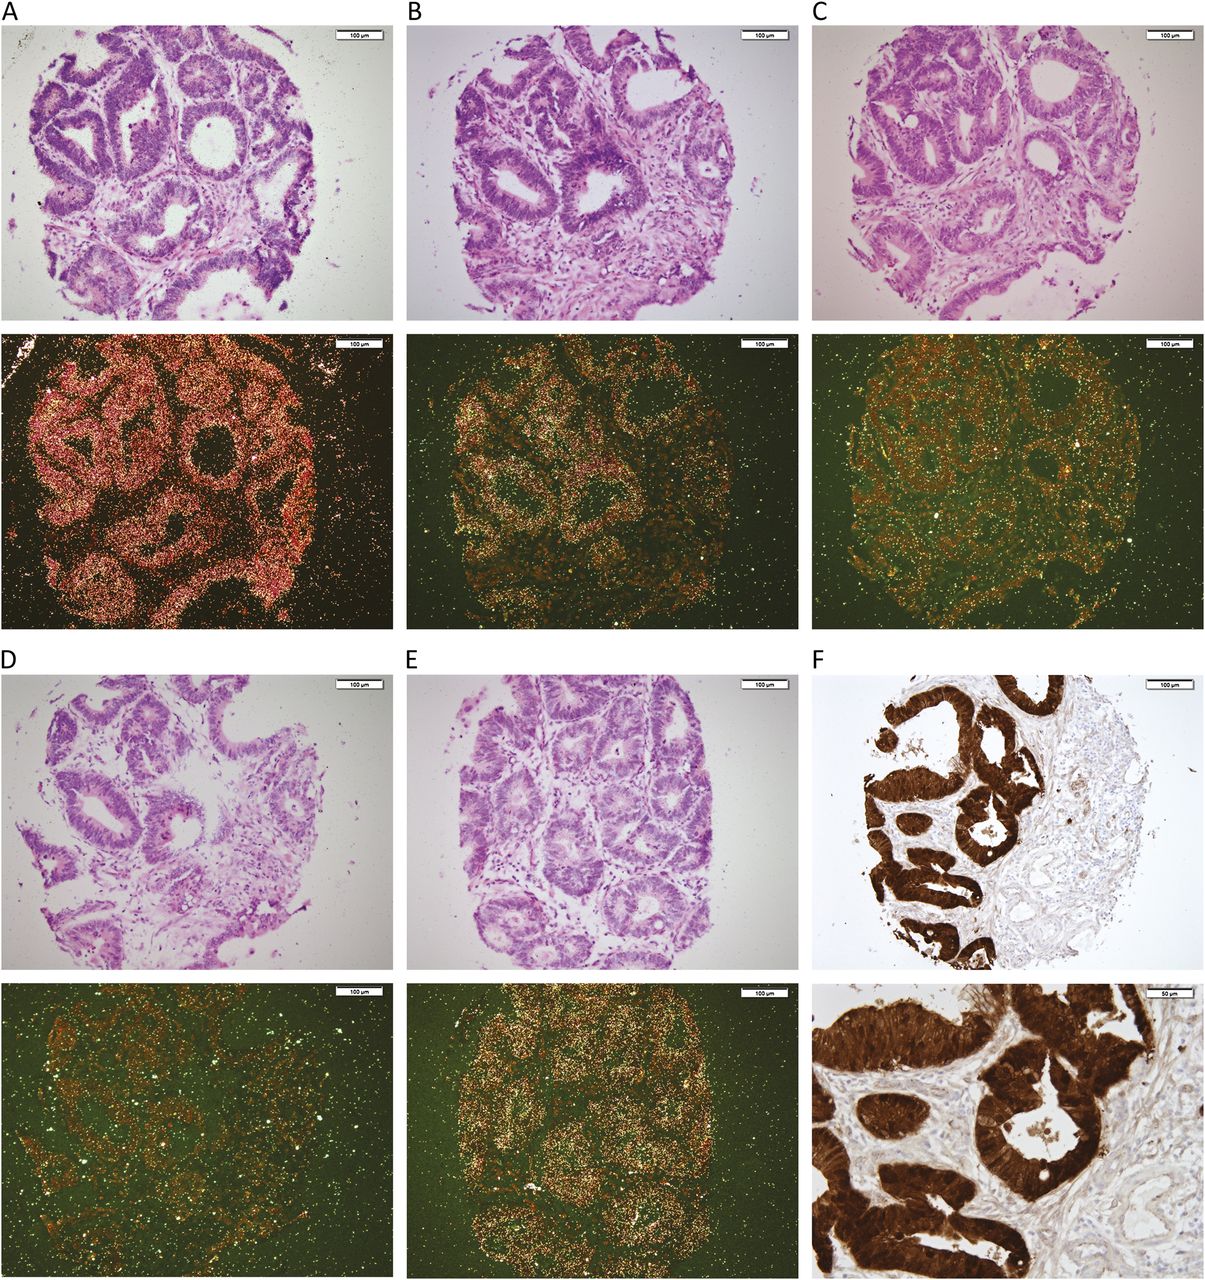
Representative antisense isotopic in situ hybridisation (ISH) images showing the expression of putative stem cell genes in a single colorectal cancer. Bright field (upper) and dark field (lower) ISH for Ascl2 (A, score 2), Lgr5 (B, score 2), Bmi1 (C, score 0), Olfm4 (D, score 0) and Sox9 (E, score 2). Hybridisation is indicated by silver grain deposition against a haematoxylin–eosin stain. Immunohistochemistry for β-catenin (F, upper 200×; lower 400×) shows nuclear, cytoplasmic and membranous immunoreactivity (brown diaminobenzidine against a blue haematoxylin counterstain).

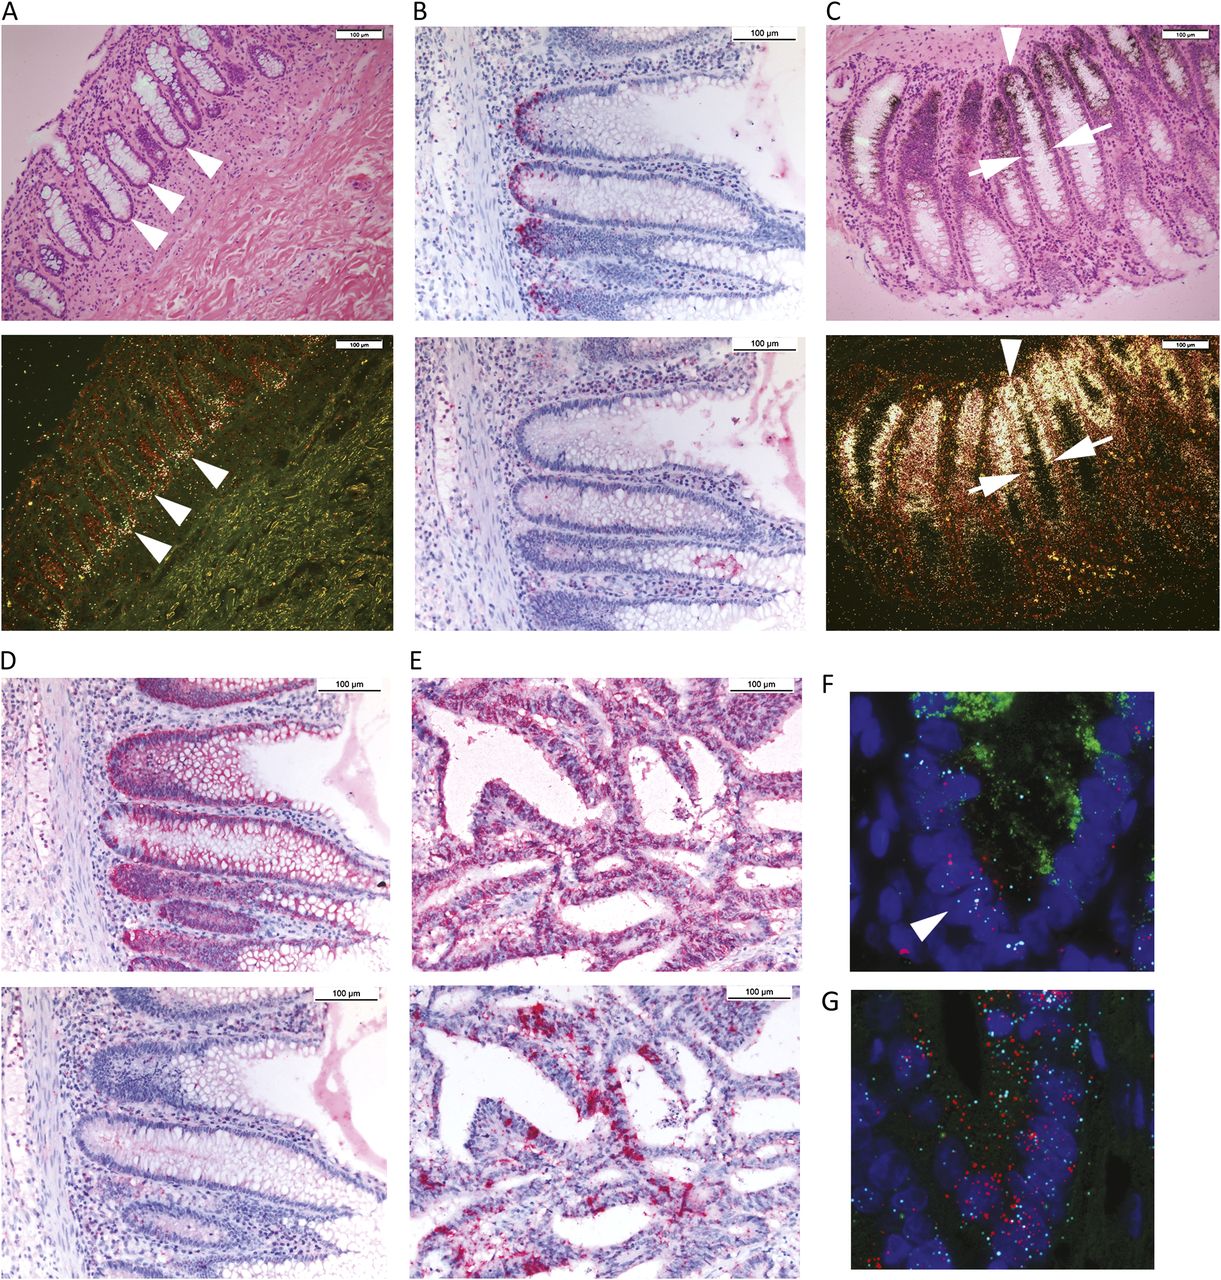
Lgr5 does not co-localise with Olfm4 in normal colon or colorectal cancer. (A) Bright field (upper) and dark (lower) field isotopic antisense in situ hybridisation (ISH) images for Lgr5 and (B) chromogenic non-isotopic antisense (upper) and sense (lower) ISH images for Lgr5 (red chromogen indicates hybridisation) show expression at the base of normal human colorectal crypts (arrowheads). (C) Bright field (upper) and dark field (lower) isotopic antisense ISH images for Olfm4 and (D) chromogenic non-isotopic antisense (upper) and sense (lower) ISH for Olfm4 show expression extending to the mid-crypt (arrows). (E) Antisense chromogenic non-isotopic ISH for Lgr5 (upper, diffuse expression) and Olfm4 (lower, focal expression) on serial sections from the same colorectal cancer show completely discordant patterns. Multiplex fluorescent ISH in normal human colonic crypts (F, arrowhead marks the Ascl2/Lgr5 positive cells at the base of the crypt) and colorectal cancer (G) for Olfm4 (green), Ascl2 (cyan) and Lgr5 (red), show discordant expression between Olfm4 and Ascl2/Lgr5. Nuclei are labelled with DAPI (blue), original magnification 400×.
Using sensitive isotopic methods, the expression pattern of intestinal stem cell genes was predominantly widespread when present, albeit with subtle regional variations from 1+ to 3+. However, the expression of intestinal stem cell genes was not accentuated at the tumour/stroma interface, as described elsewhere19 ,20; only two of 57 (3.5%) adenocarcinomas in our TMA showed this pattern for any of the markers examined (figure 3). This observation was confirmed in whole sections from blocks used to construct the TMA. In the TMA with outcome data, accentuation of Lgr5 at the tumour/stroma interface was only observed in n=20/891 (2.2%). Similarly, we could not identify a stroma related expression pattern in any cases following re-evaluation of published EphB2 immunohistochemistry (see supplementary figure 3, available online only)14 and Ascl2 ISH21 in colorectal adenomas, adenocarcinomas and metastases. However, nuclear β-catenin expression by tumour cells was accentuated at the tumour/stroma interface in n=30/31 (97%) adenocarcinoma whole sections (figure 4, supplementary figure 4; supplementary figure 4 is available online only). Nuclear β-catenin did not associate with Lgr5 expression in the TMA (supplementary table 3, available online only; p=0.24) or by comparison of expression patterns using non-isotopic ISH in whole sections (matching patterns were seen in n=1/31 colorectal adenocarcinomas, 3%).
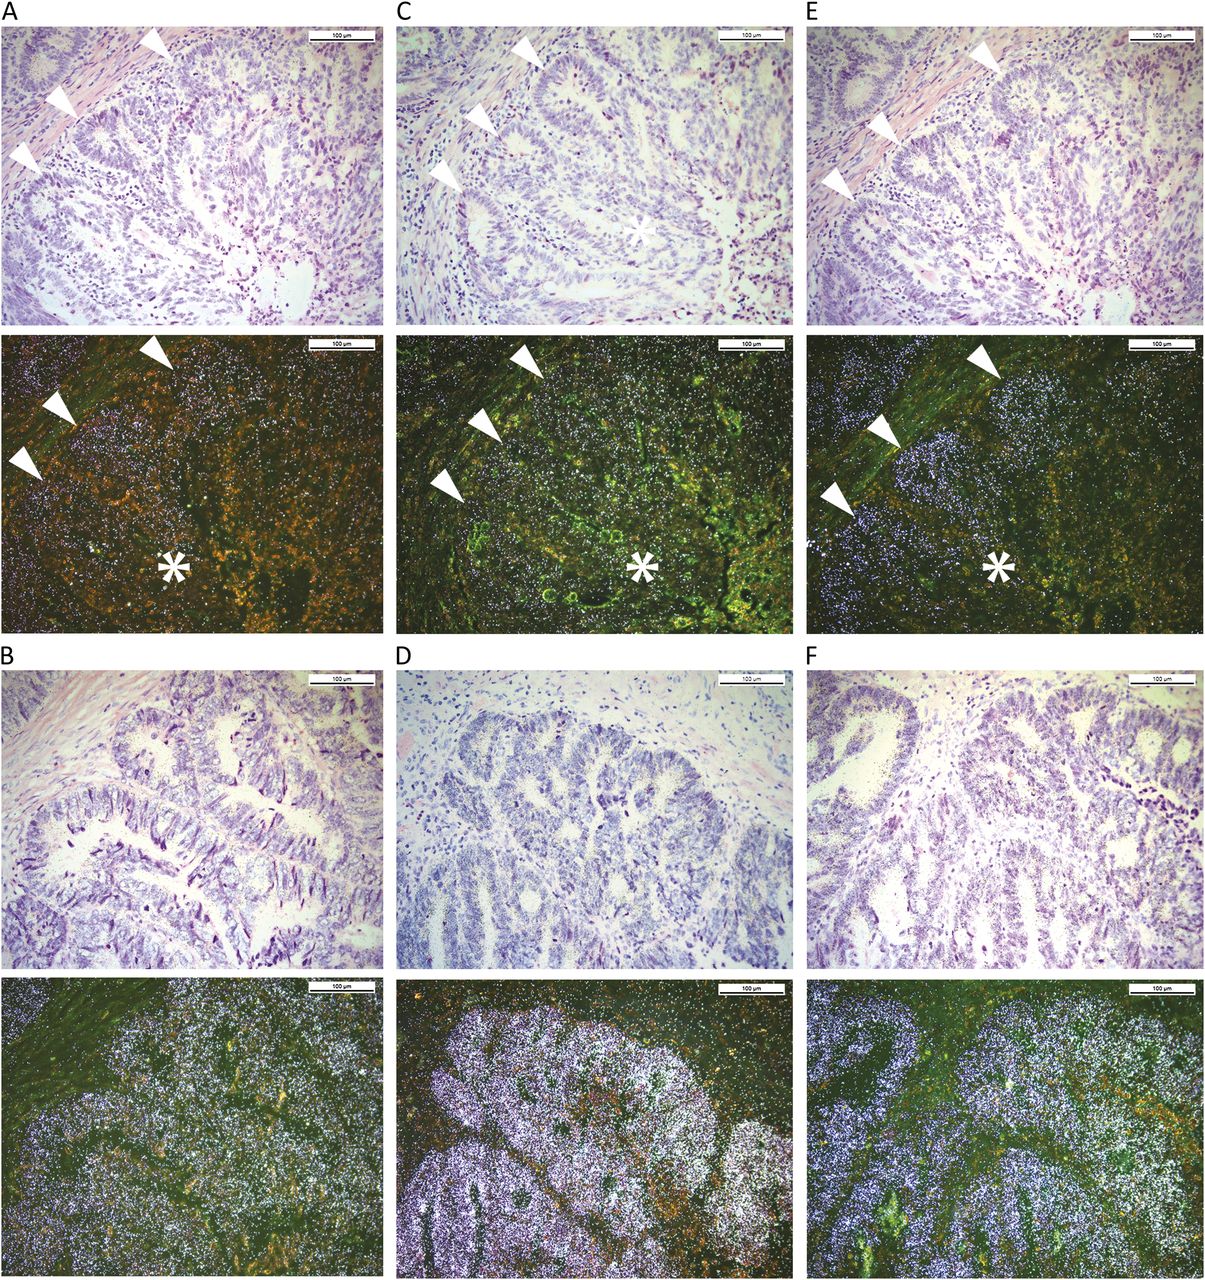
Different expression patterns of stem cell markers. Bright field and dark field antisense isotopic in situ hybridisation images for EphB2 (A, B), Ascl2 (C, D) and Lgr5 (E, F) in colorectal cancer that shows crypt-like budding of malignant glands. Arrowheads indicate crypt-like buds adjacent stroma; asterisks indicate the centre of tumour cell aggregates, distant from the stroma. Hybridisation is indicated by silver grain deposition against a haematoxylin–eosin stain. In (A), (C) and (E), images have been chosen that show greater expression of genes in the crypt-like buds compared with the centre of the tumour cell aggregates. In (B), (D) and (F), images have been chosen that show uniform expression of the genes, irrespective of morphology.
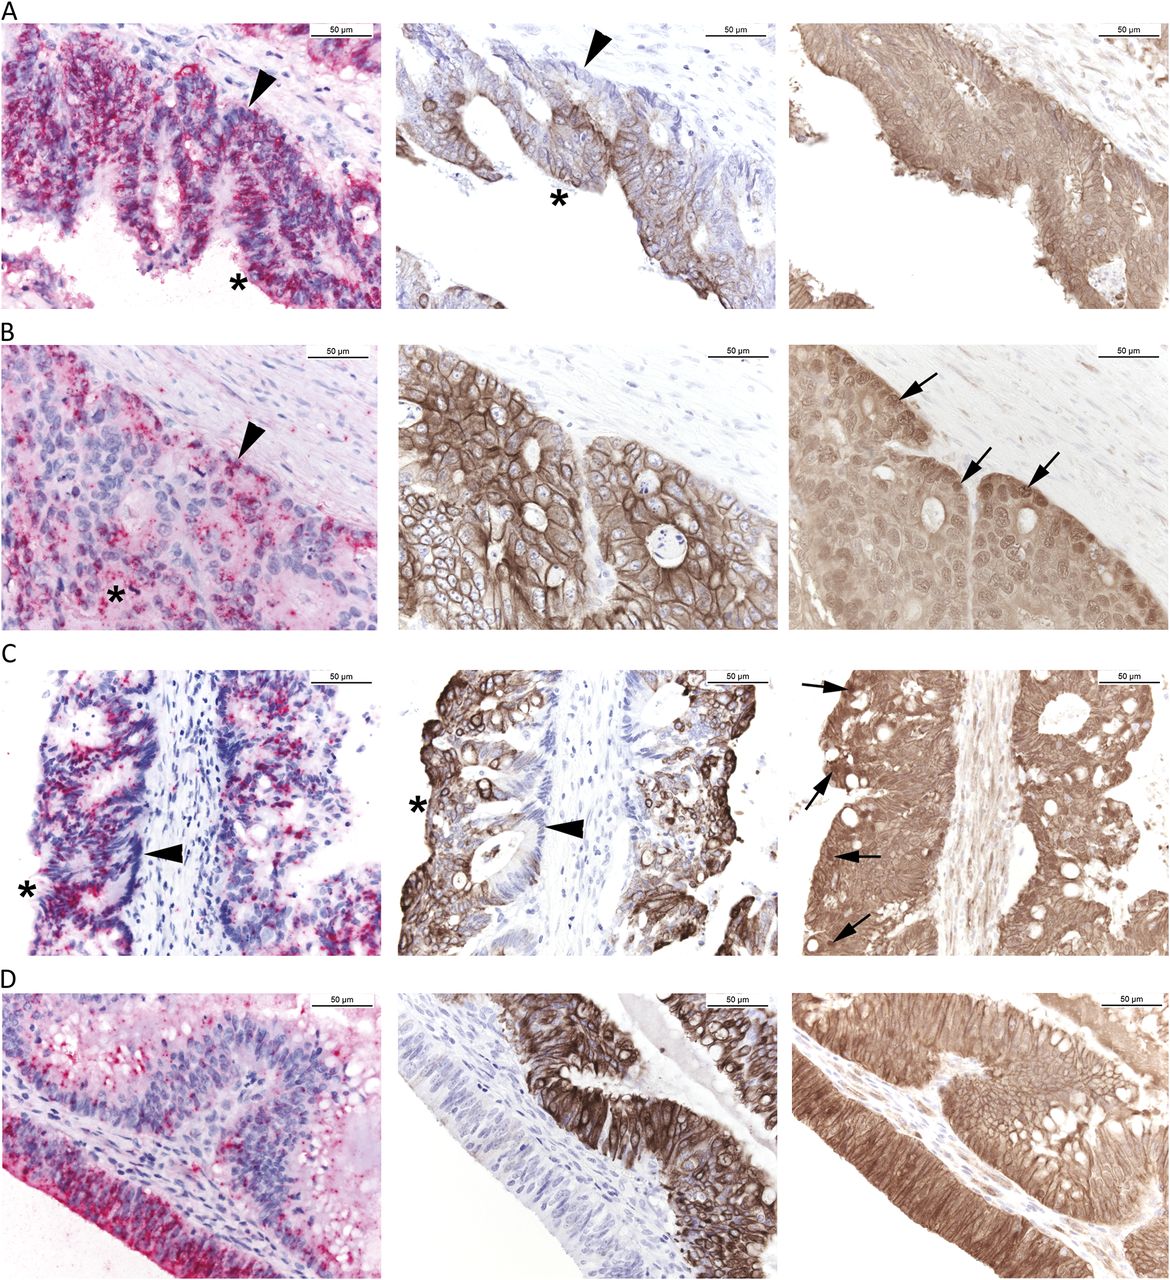
Expression patterns of Lgr5 and its relationship to cytokeratin-20 and nuclear β-catenin. (A) A cancer showing diffuse expression for Lgr5 by non-isotopic in situ hybridisation in malignant crypts (left panel), from the stromal interface (arrowhead) to the lumen (asterisk), but cytokeratin-20 expression (middle panel) is restricted to the luminal side of the malignant gland. β-catenin (right panel) shows diffuse cytoplasmic, membranous and weak nuclear expression throughout. (B) A cancer showing patchy Lgr5 expression both in the centre of the gland (asterisk) and at the stromal interface (arrowhead). All cells show cytokeratin-20 expression; nuclear β-catenin is most prominent at the stromal interface (arrows). (C) A cancer with no Lgr5 expression by tumour cells at the stromal interface (arrowhead); instead, Lgr5 is expressed by tumour cells further towards the glandular lumen that are cytokeratin-20 positive and show nuclear β-catenin localisation in serial sections (arrows). (D) A cancer with Lgr5 expression of one gland, but not in a neighbouring gland adjacent to the same stroma. Reciprocal cytokeratin-20 expression is seen with a slight increase in nuclear β-catenin intensity in the Lgr5+/cytokeratin-20− gland. Red chromogen indicates hybridisation in the left panel and brown chromogen indicates immunoreactivity in the middle and right panels, against a blue haematoxylin counterstain.
Isotopic ISH methods are more sensitive and specific than non-isotopic protocols but the spatial resolution of silver grain deposition may not resolve differences in expression between adjacent cells. To better resolve the spatial localisation of Lgr5+ cells within tumours, non-isotopic chromogenic ISH was performed on n=31 adenocarcinomas. This determined that only n=5/31 (16%) adenocarcinomas showed accentuation of Lgr5 expression at the tumour/stroma interface, which was expressed in n=26/31 (84%) cancers. This less sensitive technique showed variations in the proportion of cells that were strongly positive for Lgr5 in individual adenocarcinomas between 20% and 100%. In addition, EphB2 immunohistochemistry performed on the same series (at a fivefold lower dilution of the primary antibody than previously published, to highlight differences between subpopulations of tumour cells that express subtly different levels of EphB2) determined that only n=7/31 (23%) adenocarcinomas showed accentuation of EphB2 expression at the tumour/stroma interface (supplementary figure 5, available online only).
Reciprocal focal expression of Lgr5 and cytokeratin-20 (a differentiation marker expressed in the crypt neck and by surface epithelium) and EphB2 and cytokeratin-20 has been reported.19 While partial or completely reciprocal expression of EphB2 and cytokeratin-20 was observed in 31/31 cases (supplementary figure 5, available online only), only n=4/26 (15%) adenocarcinomas showed completely reciprocal expression patterns of cytokeratin-20 and Lgr5, with another n=4/26 (15%) showing partially reciprocal expression patterns (figure 4).
Associations between genes
Correlations between scores for each mRNA transcript are detailed in table 3. The majority of genes were positively statistically significantly correlated with each other (118 statistically significant positive correlations out of 171 tests, following correction for multiple hypothesis testing). Expression of Lgr5 and Ascl2 were significantly correlated with each other in 50 colorectal cancer cases (p=0.003), with only seven cases positive (scores 1–3) for Ascl2 that were negative (score 0) for Lgr5 and only one case positive for Lgr5 that was negative for Ascl2 (supplementary figure 6, available online only). Only seven cases (16%) were negative for both Ascl2 and Lgr5 mRNA expression. Numerous markers were statistically significantly associated with both Ascl2 and Lgr5, including Axin2, Cdca7, Dkc1, EphB2, EphB3, Ets2, Rnf43, Sox9 and Znrf3 (table 3). While a significant number of genes in table 1 had been identified as part of the Wnt/Tcf transcriptome, only Ascl2, Axin2, EphB3, Rnf43 and Dkc1 showed statistically significant associations with nuclear β-catenin (supplementary table 3, available online only).
Correlations between in situ hybridisation data
Bmi1 was not expressed in normal colorectal crypt epithelium (data not shown) and only weakly expressed in colorectal cancer, but nevertheless was significantly correlated with many of the genes included in the panel. The association between Bmi1 and Ascl2 did not reach statistical significance (p=0.076), and the association between Bmi1 and Lgr5 showed borderline statistical significance (p=0.027) following correction for multiple hypothesis testing.
Several genes in the panel (Cdk6, Gpx2, Olfm4 and Tnfrsf19) were found in both the mouse Ascl2 and the mouse Lgr5 transcriptome, but did not show significant covariance with Ascl2 or Lgr5 in expression profiling data from human colorectal cancer (table 1). These genes showed the least number of significant associations with other members of the panel, with eight statistically significant associations with Cdk6, three with Gpx2, five with Olfm4 and two with Tnfrsf19 (table 3). Moreover, expression of Olfm4, a putative marker of Lgr5+ cells,11 did not correlate with the expression of Lgr5 or Ascl2 in colorectal cancer (table 3, figures 1 and 2, supplementary figures 2 and 7; supplementary figures 2 and 7 are available online only). This was further confirmed in n=85 colorectal adenocarcinoma samples with high tumour content using Affymetrix microarray data (GeneLogic database; supplementary figure 8, available online only). In normal colorectal crypts, Olfm4 expression was seen in cells that expressed Ascl2/Lgr5 at the base of the crypt but also in cells in the mid-crypt that were Ascl2/Lgr5 negative (figure 2). Chromogenic non-isotopic ISH showed similar results; 0/31 adenocarcinomas and 1/37 adenomas showed reciprocal expression of Olfm4 and Lgr5 (figure 2). Multiplex fluorescent ISH demonstrated colocalisation of Ascl2 and Lgr5 but discordant expression between Olfm4 and Ascl2/Lgr5 in n=5 normal colon and colorectal cancer cases (figure 2).
Lgr5 and K-ras/N-ras/B-raf mutations
To investigate a reported interaction between Lgr5 and MAPK signalling,22 Lgr5 expression was examined by isotopic ISH in 19 K-ras mutant, six B-raf mutant and 13 K-ras/N-ras/B-raf wild-type colorectal adenocarcinomas (supplementary table 4, available online only). Expression of Lgr5 was not associated with K-ras mutation (p=1.0, Fisher's exact test for wild-type vs K-ras mutant). However, Lgr5 expression was significantly lower in B-raf mutant cases than K-ras mutant or wild-type cases (p=0.015 and p=0.017, respectively; Fisher's exact test).
Prognostic significance of Lgr5
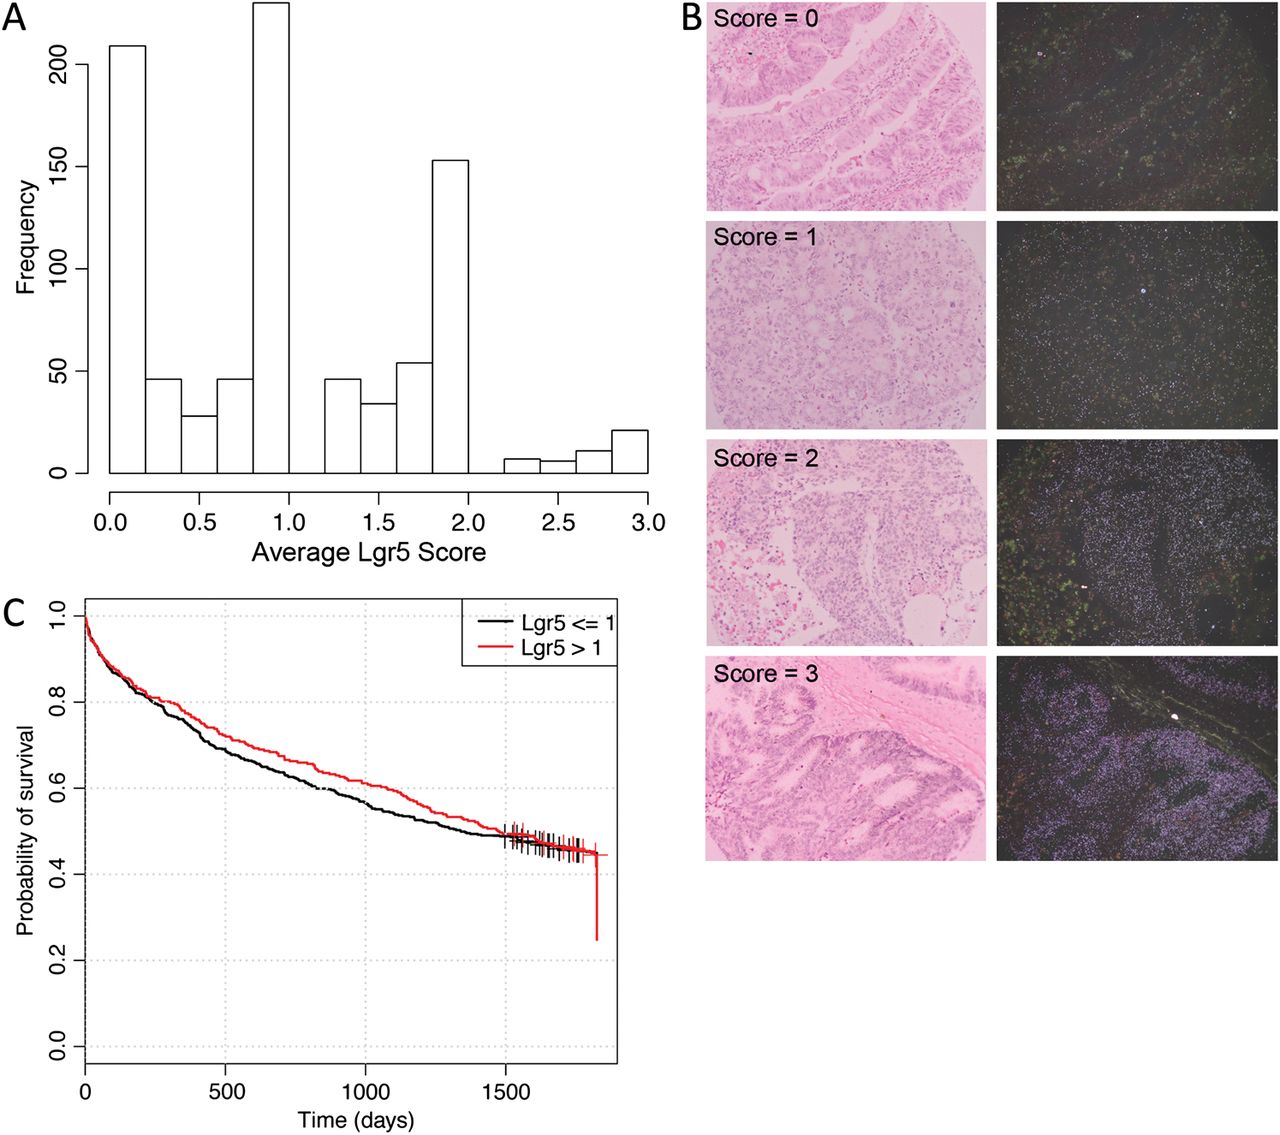
Demographic, clinical and pathological characteristics are shown in supplementary table 5 (available online only). The frequency of the average Lgr5 expression in 891 colorectal adenocarcinomas (with 623 events) is shown in figure 5. When using the average Lgr5 score, 37% (n=332/891 with 246 events) of cases were considered high (>1.0) and 63% (n=559/891 with 377 events) of cases were considered low. Median survival times for these high and low groups were 1474 and 1340 days, respectively. The HR estimate was 1.05 (95% CI 0.90 to 1.24, p=0.52).

Lgr5 is not a prognostic marker in colorectal cancer. (A) Histogram showing the frequency of the average Lgr5 expression score (across replicate tissue microarray cores) in 891 colorectal adenocarcinomas. (B) Examples of different scores for Lgr5 expression by isotopic in situ hybridisation. Dark field and bright field images are shown, with silver grains indicating hybridisation against a haematoxylin–eosin counterstain (original magnification 200×). (C) Kaplan–Meier curves for overall survival in high versus low Lgr5 subsets, censored at 5 years.
When the maximum Lgr5 expression across replicate cores was examined, 209 scored 0 (23%), 327 scored 1 (37%), 305 scored 2 (34%) and 50 scored 3 (6%). Using the maximum Lgr5 score, 40% of cases were considered high (>1) and 60% of cases were considered low. The HR estimate was 1.07 (95% CI 0.91 to 1.25, p=0.41).
When overall survival was censored at 5 years, the dichotomised average Lgr5 score also showed no survival benefit, with tight CIs: HR 1.09 (95% CI 0.93 to 1.28, p value 0.29) (figure 5). In overall survival analyses censored at 5 years, examination of Lgr5 as a continuous variable also revealed a HR of 1.03 (95% CI 0.93 to 1.13, p=0.60).
Average Lgr5 expression did not significantly associate or correlate with patient sex, age, site, number of nodes retrieved, Ki67 labelling index or Dukes' stage (data not shown). Average Lgr5 expression was significantly lower in poorly differentiated tumours (mean values for grade 1, 2 and 3: 1.10, 1.10 and 0.76, respectively); t tests comparing grade 1 versus 3, p=0.0004 and grade 2 versus 3, p<0.0001. Average Lgr5 was also lower in the mucinous subtype of adenocarcinomas (mean 1.06 vs 0.68 for non-mucinous vs mucinous, p=0.0008) and lower in tumours with deficient mismatch repair (mean 0.66 vs 1.10 for deficient vs proficient mismatch repair, p=0.0001).
Multivariate analyses showed that the average Lgr5 score, when treated as a continuous variable, was not an independent prognostic factor (supplementary table 6, available online only). Moreover, while this statistical analysis was not powered for smaller subsets, preliminary overall survival analyses of dichotomised average Lgr5 subsets in deficient and proficient mismatch repair groups revealed overlapping survival curves (data not shown).
Discussion
Data derived from mouse small intestine suggest that human colorectal cancers that arise as a consequence of apc loss are derived from intestinal stem cells and will show a stem cell expression signature that is consistent with Wnt activation, Lgr5 expression and Ascl2 expression. However, this extrapolation needs to be rigorously demonstrated in human colorectal cancer.
Lgr5 and Ascl2 were prevalently expressed in colorectal cancer, with expression of at least one marker seen in 84% of cases (supplementary figure 6, available online only). Moreover, there was a significant association between expression of Lgr5 and Ascl2, and both Lgr5 and Ascl2 were significantly associated with a number of genes, including Axin2, Cdca7, Dkc1, EphB2, EphB3, Ets2, Rnf43, Sox9 and Znrf3. This intestinal stem cell signature was seen in the majority of colorectal cancers, supporting the hypothesis that a large proportion of adenocarcinomas are derived from Lgr5+/Ascl2+ crypt stem cells. Sixteen per cent of colorectal cancers did not express either Lgr5 or Ascl2, and had low levels of expression of other genes in the intestinal stem cell signature. This suggests that a minority of colorectal cancers either derive from Lgr5+/Ascl2+ cells that have lost the stem cell signature during tumorigenesis or derive from Lgr5−/Ascl2− cells transformed by pathways (eg, microsatellite instability and b-raf mutation)23 that do not involve hyperactivation of canonical Wnt signalling. In support of this argument, Lgr5 was negatively associated with deficient mismatch repair and negatively associated with B-raf mutations.
Another possibility is that Lgr5−/Ascl2− colorectal cancers derive from a different stem cell niche, such as that defined by Bmi1 expression.10 While Bmi1+ stem cells can help to compensate for loss of Lgr5+ stem cells,24 ,25 the relevance of this to human colorectal cancer is uncertain. Herein, Bmi1 expression was not seen in normal colorectal crypts, and when present in colorectal cancers only low levels of expression were seen. Furthermore, Lgr5−/Ascl2− colorectal cancers were not defined by high levels of Bmi1 expression. Therefore, Bmi1+ intestinal stem cells are unlikely to represent the cells of origin of the majority of colorectal adenocarcinomas.
It has been previously reported that Olfm4 is a robust marker of Lgr5+ stem cells at the base of the mouse small intestinal crypt.11 Indeed, Olfm4 has been used extensively as a substitute for Lgr5 when evaluating stem cell loss.7 However, the data presented herein show no association or colocalisation between Olfm4 and Lgr5, or Olfm4 and Ascl2 in normal human colon or colorectal cancer using multiple methods. Therefore, Olfm4 should not be used as an intestinal stem cell marker in the human large intestine.
The cancer stem cell model suggests that only a subpopulation of cancer cells are able to invade, metastasise and/or repopulate a malignant tumour following treatment.26 Merlos-Suarez et al reported data suggesting that EphB2high cells are tumour initiating cells and expression of an EphB2 associated stem cell signature (including Lgr5) was associated with an adverse outcome.19 However, EphB2 expression has been shown by at least three independent groups,14 ,27 ,28 including our own, to be associated with improved overall survival (albeit that loss of expression may occur through microsatellite instability,29 which is a positive prognostic factor).13 In contradiction to their more recent paper,19 Batlle et al have also reported that EphB2 acts as a tumour suppressor in mouse models of apc driven intestinal tumorigenesis.30 To add to the confusion, de Sousa et al reported that (in a different series to Merlos-Suarez et al) a signature of Wnt gene expression (including Lgr5) was strongly associated with improved survival in 345 patients.31 Contrary to both groups, we report that Lgr5 expression is not a prognostic factor in a highly powered series of 891 colorectal cancers. Moreover, we have previously shown that Ascl2 expression is not a prognostic factor in a separate series of 327 colorectal cancers.21 ,32 While the methods are different, the strong association between Lgr5, Ascl2 and other Wnt regulated genes, and the size of the effect, suggests that these observations should be reproducible in our series. The lack of any prognostic effect for Lgr5 does not discount it as a cancer stem cell marker, but it makes the argument less compelling. It is also possible that the negative association between Lgr5 and b-raf mutations (a poor prognosis marker) could drive the positive prognostic described for Lgr5 by de Sousa et al in a subset of colorectal cancers.31
Merlos-Suarez et al reported that expression of EphB2 is variable throughout colorectal cancers, and malignant cells with high levels of EphB2 and Lgr5 expression are seen at the base of crypt-like budding glands adjacent tumour stroma.19 Vermeulen et al also reported that nuclear β-catenin and Wnt activity are more frequently observed in colorectal cancer cells adjacent stroma.20 In our hands, the intestinal stem cell genes were only rarely preferentially expressed in crypt-like budding glands, as suggested.19 Nuclear β-catenin was expressed throughout colorectal adenocarcinomas but did show a predilection for the tumour/stroma interface. The lack of a correlation between Lgr5 and nuclear β-catenin in adenocarcinomas suggests that this relationship may be partially uncoupled during tumorigenesis by unknown mechanisms, including hypermethylation21 ,31 or hyperactive MAPK signalling.22 We could not repeat observations that Wnt signalling targets such as Lgr5 are upregulated by MAPK signalling22 but it is possible that a larger series may reveal a more subtle relationship. It is also possible that Lgr5 expression is inducible by lower levels of Wnt signalling than are required for prominent nuclear β-catenin localisation. Therefore, while tumour/stroma interactions may define nuclear β-catenin at the invasive edge of colorectal cancers, they do not appear to exclusively define an Lgr5+ or EphB2+ cancer stem cell niche in the majority of cases.
The data described herein have several limitations. For practical reasons, only a limited number of genes were chosen to investigate the intestinal stem cell signature. Genes were chosen to represent several sources and to address specific questions regarding intestinal stem cells in colorectal cancer (eg, the relationship of Olfm4 to Lgr5). The majority of genes showed a strong association with other genes in the signature, particularly Lgr5 and Ascl2. However, we cannot rule out the possibility that a better stem cell signature exists until all genes identified from all sources have been tested in an exhaustive manner. The semiquantitative nature in which the in situ studies have been scored does not capture the full range of gene expression. However, it does permit the covariance of gene expression to be accurately assessed, which is the main purpose of this study.
In summary, these data demonstrate that expression of an intestinal stem cell signature that includes Lgr5 and/or Ascl2 expression, but not Bmi1, defines the majority (74–85%) of colorectal cancers. However, Lgr5 expression does not define a subset of tumours with a differential outcome. Preliminary data suggest that colorectal cancers that are negative for Lgr5 may arise, in part, due to deficient mismatch repair. While tumour/stroma interactions may drive Wnt signalling at the invasive edge of colorectal adenocarcinomas, they do not appear to define a Lgr5+ colorectal cancer stem cell niche. Unexpectedly, Olfm4 did not associate with either Ascl2 or Lgr5 expression, suggesting that Olfm4 is not a marker of colorectal cancers that derive from intestinal crypt stem cells, as has been suggested.11 ,19 ,33
Acknowledgments
Members of Genentech's core pathology laboratories, especially Carmina Espiritu, were instrumental in the implementation of this study. Scientists at Advanced Cell Diagnostics Inc (Hayward, California, USA) were instrumental in providing multiplex ISH. The authors thank Paul Polakis (Genentech Inc) for his comments on the manuscript and Jennifer Wang (Genentech Inc) for help with data management.
References
Supplementary materials
Supplementary Data
This web only file has been produced by the BMJ Publishing Group from an electronic file supplied by the author(s) and has not been edited for content.
Files in this Data Supplement:
- Data supplement 1 - Online materials
- Data supplement 10 - Online Table_6
- Data supplement 2 - Online Figures1and2
- Data supplement 3 - Online Figures3and4
- Data supplement 4 - Online Figures5to8
- Data supplement 5 - Online Table_1
- Data supplement 6 - Online Table_2
- Data supplement 7 - Online Table_3
- Data supplement 8 - Online Table_4
- Data supplement 9 - Online Table_5
Footnotes
-
HK and AMJ contributed equally to this paper.
-
Funding This research was funded by Genentech Inc.
-
Competing interests DD, IKF, MY, RP, WFF, HK and AMJ are employees of Genentech Inc and hold equity in Roche. JLZ was formerly an employee of Genentech Inc.
-
Provenance and peer review Not commissioned; externally peer reviewed.