Article Text

Abstract
Objective Bacteria play an important role in the onset and perpetuation of intestinal inflammation in inflammatory bowel disease (IBD). Unlike in Crohn's disease (CD), in which dysbiosis has been better characterised, in ulcerative colitis (UC), only small cohorts have been studied and showed conflicting data. Therefore, we evaluated in a large cohort if the microbial signature described in CD is also present in UC, and if we could characterise predominant dysbiosis in UC. To assess the functional impact of dysbiosis, we quantified the bacterial metabolites.
Design The predominant microbiota from 127 UC patients and 87 age and sex-matched controls was analysed using denaturing gradient gel electrophoresis (DGGE) analysis. Differences were quantitatively validated using real-time PCR. Metabolites were quantified using gas chromatography–mass spectrometry.
Results Based on DGGE analysis, the microbial signature previously described in CD was not present in UC. Real-time PCR analysis revealed a lower abundance of Roseburia hominis (p<0.0001) and Faecalibacterium prausnitzii (p<0.0001) in UC patients compared to controls. Both species showed an inverse correlation with disease activity. Short-chain fatty acids (SCFA) were reduced in UC patients (p=0.014), but no direct correlation between SCFA and the identified bacteria was found.
Conclusions The composition of the fecal microbiota of UC patients differs from that of healthy individuals: we found a reduction in R hominis and F prausnitzii, both well-known butyrate-producing bacteria of the Firmicutes phylum. These results underscore the importance of dysbiosis in IBD but suggest that different bacterial species contribute to the pathogenesis of UC and CD.
- INTESTINAL BACTERIA
- ULCERATIVE COLITIS
Statistics from Altmetric.com
Significance of this study
What is already known on this subject?
-
Gut microbiota play an important role in the onset and perpetuation of chronic intestinal inflammation, as witnessed in IBD.
-
In CD patients, a specific dysbiosis has repeatedly been documented. In UC patients, data are limited and conflicting.
-
SCFA produced by intestinal bacteria exert immunomodulatory and anti-inflammatory properties. Patients with UC have low fecal butyrate and high lactic acid levels.
What are the new findings?
-
The CD-dysbiosis signature characterised by F prausnitzii, B adolescentis and R gnavus is not retrieved in UC patients by predominant analysis, suggesting different species driving dysbiosis in CD and UC.
-
The microbial composition in UC patients differs from healthy subjects with the reduction of R hominis, a butyrate-producing bacteria of the Firmicutes phylum
-
For the first time we show an inverse correlation between dysbiosis-driving species and disease activity of UC.
How might it impact on clinical practice in the foreseeable future?
-
A reduction of R hominis and F prausnitzii defines UC dysbiosis. These species may be used to restore and maintain the balance of the microbiota in UC patients with selective probiotics, prebiotics and/or synbiotics.
Introduction
The gut microbiota has important metabolic, protective and trophic functions on the host.1 Accumulating data in humans show that the composition and diversity of the microbiota is altered in patients with inflammatory bowel diseases (IBD). Genome-wide association studies and the recently completed immunochip project have identified more than 160 host genetic variants. Many are involved in sensing and elimination of microbial compounds.2 However, the significantly lower monozygotic twin concordance rate in ulcerative colitis (UC) compared to Crohn's disease (CD) suggests a greater contribution of environmental factors in UC.3 ,4 The most compelling evidence comes from experimental animal models that show no colitis in a germ-free environment and develop only colitis after bacterial colonisation.5 ,6 Furthermore, diversion of the fecal stream prevents recurrence in CD and the onset of pouchitis after surgery, and inflammation only develops after closure of the temporary ileostomy.7 ,8 IBD patients also show an increased mucosal IgG secretion and hyperreactivity of the mucosal T lymphocytes against commensal microbiota.9 ,10 Despite this accumulating evidence for a role of bacteria in the onset of IBD, no single pathogenic bacterium has been convincingly shown as the cause of the disease. Instead, an imbalance between protective and harmful bacteria, also called dysbiosis, has been suggested. Culture-dependent as well as independent techniques showed that bacterial concentrations are increased while bacterial diversity is reduced.11–16 A qualitative and quantitative reduction of the Firmicutes phylum has repeatedly been demonstrated in CD patients.17–19 This group contains butyrate-producing bacteria including Faecalibacterium prausnitzii, the major bacterium of the Clostridium leptum phylogenetic group.20 A reduction of F prausnitzii is the most replicated species-specific finding so far in CD and is confirmed both in fecal and mucosal samples.17 ,21–23 The anti-inflammatory effects of F prausnitzii are thought to act through secreted metabolites, which can block nuclear factor kappa B activation and IL-8.21
We recently showed that five bacterial species characterise dysbiosis in CD, namely a decrease in F prausnitzii, Bifidobacterium adolescentis, Dialister invisus and an uncharacterised species of Clostridium cluster XIVa, and an increase in Ruminococcus gnavus.24 This bacterial signature pointed towards a lack of butyrate-producing bacteria in the pathogenesis of the disease.
A decrease in intestinal biodiversity is likely also to exist in UC patients but is an unspecific observation.25 In contrast to CD, a detailed dysbiosis in UC is not as well studied.11 Previous studies were performed in small cohorts and have used a variety of different methodologies and sampling protocols.11 ,26 As a consequence, results are conflicting. The most reported observation is the reduction of members belonging to the Firmicutes and Bacteroidetes phylum after fecal and mucosal analysis.11 ,17 ,26 Mucosal microbiota of UC twins showed dysbiosis, and were mainly characterised by an increase of Proteobacteria and Actinobacteria.27 In contrast, remission UC twin pairs were not discriminated from healthy controls.28 In active UC patients, an increase of sulfate-reducing bacteria is described.29 Furthermore, an increase in concentrations of facultative anaerobic bacteria is reported.30
In this study we hypothesised that dysbiosis is also important in UC pathophysiology and may partly overlap with the dysbiosis observed in CD. We therefore evaluated whether the microbial signature as we previously described in CD is also present in UC. Second, we performed a fecal microbial community analysis in a large cohort of UC patients to define UC-specific dysbiosis. For this, we investigated differences in fecal bacterial composition of UC patients and healthy individuals. Third, we quantified metabolites generated by bacterial species driving dysbiosis to assess the functional impact of the observed dysbiosis. Finally, we studied if the quantity of dysbiosis-defining species and their metabolites are correlated with the severity of colitis.
Methods
Patients
All participants were recruited via the University Hospital Leuven (Belgium). Both patients and healthy subjects were Belgian habitants and consumed a western diet. Participants were excluded if they had used antibiotics, sulfasalazine, probiotics or prebiotics in the last month preceding fecal sampling as this could influence the intestinal microbiota.31 ,32 The study was approved by the ethics committee of the University of Leuven (Belgium) (ethics committee approval, S52 544 and S53684). Written informed consent was given by all participants before collection of the samples.
We collected fecal samples from 127 UC patients (39 active (Mayo 2–3) and 88 in remission (Mayo 0–1)) and 87 age and sex-matched healthy controls. The healthy control cohort consisted of 51 healthy control subjects and 36 unaffected partners of UC patients. The healthy partners were exposed to the same environment and share equal diet habits. The characteristics of the participants are presented in table 1.
Study population
Disease activity in UC was defined using the partial Mayo score as endoscopy was not systematically performed on the date of fecal sampling. In a subgroup of 61 (48%) UC patients, endoscopy was available.
Furthermore, we collected an independent validation cohort with fecal samples from 77 UC patients (48 active UC (Mayo 2–3) and 29 in remission UC (Mayo 0–1)) and 75 healthy controls (68 healthy control subjects and seven healthy partners). Endoscopy was available in 69 (89%) UC patients. The characteristics are presented in supplementary table 1 (available online only).
Samples and DNA extraction
Fresh stools were stored at 4°C at home but were provided within 24 h to the laboratory where aliquots were immediately stored at −80°C for DNA extraction and for short-chain fatty acid (SCFA) analysis. Fecal bacterial DNA was extracted using a modification of the method of Pitcher et al33 as previously described by Vanhoutte et al and stored at −80°C.34 DNA integrity was evaluated by loading 5 µL DNA on a 1% agarose gel stained with ethidium bromide. The purity and concentration of the extracted DNA were measured using ultraviolet absorption at 260/280 nm and 230/280 nm ratio (NanoDrop spectrophotometer; Isogen Life Science, Temse, Belgium).
To standardise comparison between samples with different water content and prevent false low results in diarrhoea, dry weights were determined by lyophilising a precisely weighed portion between 0.2 and 0.5 g in duplicate. The preweighed samples were dried in a lyophilisator (Christ, Osterode, Germany) and weighed again. The fecal dry weight was expressed as a percentage.
Denaturing gradient gel electrophoresis profiling and analysis
The amplicons for denaturing gradient gel electrophoresis (DGGE) were generated applying community PCR with universal bacterial primers (F357 with GC clamp and R518) targeted against the hypervariable V3 region of the 16S ribosomal RNA gene on the bacterial DNA extracted from the fecal samples. Amplicons with the same length but different sequence were separated with DGGE using a 35–70% denaturating gradient. Thirty microlitres of the PCR product were loaded and electrophoresis was performed at 70 V for 990 min at 60°C. Each gel included three standard reference lanes containing amplicons of 12 bacterial species for normalisation and comparison between gels. DGGE gels were stained with GelRed nucleic acid gel stain (Biotium, VWR, Leuven, Belgium) for 30 min and were visualised using a molecular imager (ChemiDoc XRS imaging system; Bio-Rad, Nazareth, Belgium). The generated predominant microbial profiles were processed with BioNumerics V.4.6 (Applied Maths, St-Martens-Latem, Belgium) as previously described.24
In short, all fingerprinting profiles were aligned using the reference lanes and then compared. Instead of assessing the different bands per profile, band classes over all profiles were used, allowing minimal shifts of bands (less than 0.5% of the total profile) per class. The numeric value of the relative intensity per band class was then exported for all profiles and further analysed with SPSS software (SPSS V.20.0 for Windows).
Extraction and identification of bands
Bands belonging to the band classes of interest were excised, purified and verified as previously described.24 To check for co-migration of bands, purified bands were analysed on a DGGE run with adjusted denaturating gradient. Purified bands and the original fingerprint profile of the same samples were analysed on the same gel to check for correct excision of bands. After identity and quality control of the purified band, its DNA was sequenced using an ABI Prism 3130 genetic analyser (Applied Biosystems, USA). The sequencing results of bands from the same band class of at least four UC patients and four controls were first aligned to confirm that they were identical. For identification, homology searches in the GenBank DNA database were performed with BLAST Search.
Real-time PCR
Significant differences in the presence or intensity of the bacterial species after DGGE analysis were confirmed by real-time (RT)–PCR. Quantification of bacterial DNA was performed using the Applied Biosystems 7500 fast real-time PCR system (Applied Biosystems, Ghent, Belgium) in the fast cycling 7500 mode. The primer express V.3.0 software (Applied Biosystems, Ghent, Belgium) was used to develop a species-specific primer set and probe targeting the RHOM_14695 gene of R hominis and the 16S rRNA gene of Bifidobacterium longum and F prausnitzii. All primers and probes used in this study are listed in table 2. BLAST search was used to check the specificity of the primer set and ensure that they were unique for the target. All RT–PCR amplifications were performed at a total volume of 20 µL per reaction mixture containing 4 µL of the appropriate diluted DNA, 10 µL Taqman Universal PCR Master Mix (Applied Biosystems, Ghent, Belgium), 900 nM of each primer and 150 nM minor groove binding probe. The conditions for amplification and detection included one cycle at 95°C for 20 min followed by 45 cycles of amplification (3 s at 95°C and 30 s at 60°C). In RT analysis, the standard curve was constructed by serial dilutions of genomic DNA from a control strain (R hominis A2-183, B longum LMG 13 197, F prausnitzii A2-165) for which the number of bacteria was determined by plate counting. The cultures were grown in medium as provided by the supplier and incubated at 37°C under anaerobic conditions. All quantifications were performed in triplicate and verified for a maximum variation less than 0.5 Ct. Mean Ct was used to calculate the bacterial counts (colony forming units (CFU)/g feces). Bacterial counts below the detection limit of 16 CFU/g feces may not be truly zero or cannot be seen as missing values. Therefore, these samples were given a value corresponding to the detection limit of the RT–PCR assay. Bacterial counts were expressed as log10 values per gram dry weight feces.
Primers and probes for species-specific real-time PCR
Metabolic profiling
Lactic acid measurement
d and l-lactic acid concentrations were measured in fecal samples using an enzymatic colorimetric assay (Biosentec, Toulouse, France); 250 mg feces were 2× diluted in triethanolamine buffer (0.1 M, pH 9.15). Samples were centrifuged at 13 000 g for 5 min at 4°C. The supernatant was supplemented with trichloric acid (10% final concentration) and centrifuged at 4500g for 20 min at 4°C.35 Measurements were performed on the supernatant according to the manufacturer's instructions. Optical densities were measured using an ELx808 absorbance microplate reader (Bio-Tek Instruments, Winooski, USA) set at 340 nm.
SCFA measurement
Propionate was supplied by UCB (Leuven, Belgium), butyrate was supplied by Devos-Francois (Charleroi, Belgium), and acetate and 2-ethylbutyrate by Merck (München, Germany). All standards were of analytical quality (at least 99% purity). Sodium sulfate (99%) was purchased from Acros Organics (Geel, Belgium) and sulfuric acid (99%) from Sigma-Aldrich (Bornem, Belgium). Immediately before analysis, fecal aliquots were thawed and a 0.25 g fecal sample was suspended in 4870 µL water. 2-Ethylbutyrate (40 µL; 0.25%) was added as internal standard. A magnetic stirrer, a pinch of sodium sulfate and 130 µL sulphuric acid were added to the sample to salt out and acidify the solution, respectively. To prevent cross-over from one sample to another, water samples were extracted after each sample. The SCFA were analysed on a gas chromatography–mass spectrometry type time of flight (Trace GC, Thermoquest, Rodano, Italy and Tempus II, Thermo Electron, San Jose, USA), which was coupled on-line to a purge-and-trap system (Velocity, Teledyne Tekmar, Mason, USA).36 The resulting chromatograms were processed using AMDIS (Automatic Mass Spectral Deconvolution and Identification Software, V.2.1) provided by the National Institute of Standards and Technology (California, USA). Acetate, propionate and butyrate were quantified with appropriate calibration curves obtained using internal standard quantitation.
Statistical analysis
Data were analysed using SPSS software. Non-parametric Kruskal–Wallis was used to compare fecal dry weight between multiple groups. Differences in presence of bands of the DGGE profiles were determined using the Pearson χ2 test. The Mann–Whitney U test was performed for comparison of band intensity and for comparison of bacterial count quantified by RT–PCR between the different groups. The correlation between disease activity and bacterial count was assessed with the Kendall's tau (τ) correlation coefficient. Bivariate analysis was used to assess correlations between species–species and species–metabolite amounts (Spearman's rho correlation coefficient, ρ). Partial least squares discriminant analysis (PLS-DA) was performed using The Unscrambler V.9.7 (Camo, Oslo, Norway). This multivariate analysis was used to cluster the microbial profiles according to similarities in band classes.
The same univariate and bivariate analyses were used to test significant changes and correlations for the absolute concentrations of metabolites. Influences of demographic and clinical variables on the amount of species were first tested using univariate (Mann–Whitney U test) and bivariate analysis (Spearman's rho or Kendall's tau). Second, independent associations and influences of confounding variables were assessed using a linear regression model and applying a forward selection approach. Multicollinearity was explored by determining the variance inflation factor (VIF) and tolerance value. A VIF value greater than 10 and a tolerance value smaller than 0.10 implied collinearity. The level for statistical significance was set at p<0.05.
Results
Fecal dry matter content
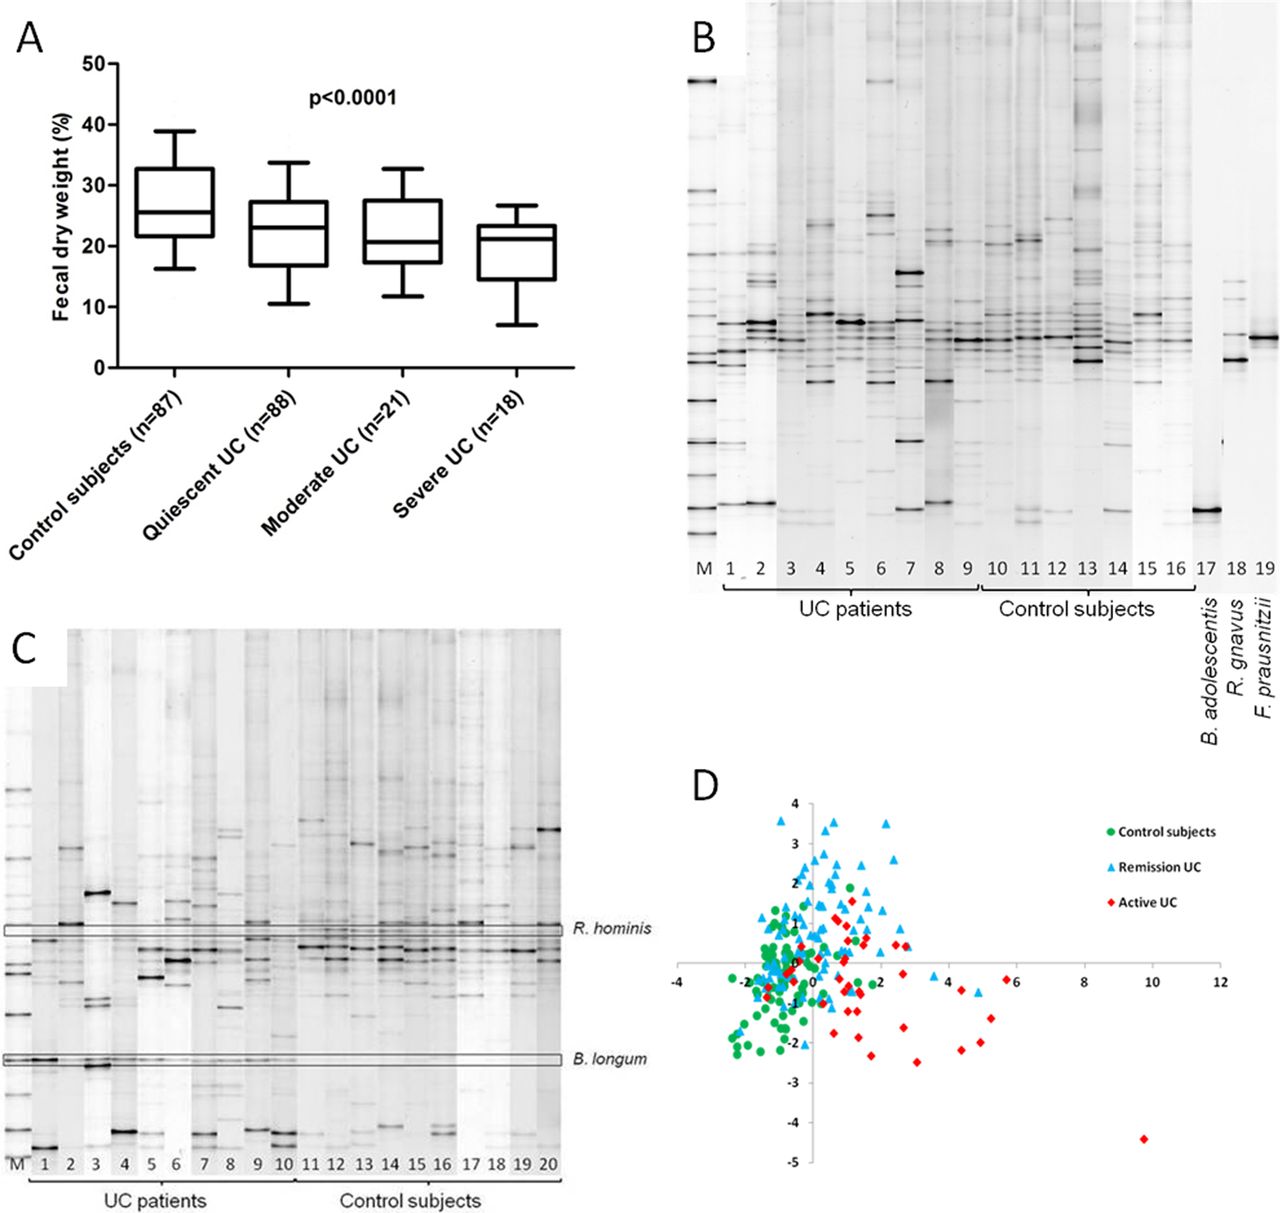
To standardise comparisons between samples with different water content and prevent a dilutional effect of diarrhoea, we determined the percentage fecal dry weight of the samples. Fecal dry weight was significantly reduced in UC patients (median 22% (IQR 16.5–27%) dry weight) when compared to controls (median 26% (IQR 22–32%) dry weight; p<0.0001). The dry weight was lowest in patients with more severe disease (figure 1A). Therefore, all further data are expressed in fecal dry weight.

(A) Box plot presenting median, IQR and 95% CI of the fecal dry weight (%) as a function of disease state (Kruskal–Wallis, p<0.0001). (B) Example of DGGE profile of UC patients, control subjects and the predominant bacterial CD signature. M, standard reference. Lanes 1–8 are UC patients, lanes 9–16 are control subjects. Lanes 17–19 are the species belonging to the bacterial CD signature, B adolescentis, R gnavus and F prausnitzii. (C) DGGE profile highlighting the differential representation of R hominis and B longum between UC patients and controls. M, standard reference. Lanes 1–10 are UC patients and lanes 11–20 are control subjects. (D) PLS-DA score plot generated from the DGGE microbial profiles of fecal samples. Clustering of similar microbial profiles showing systematic differences between control subjects, UC patients in remission and active patients. CD, Crohn's disease; DGGE, denaturing gradient gel electrophoresis; PLS-DA, partial least squares discriminant analysis; UC, ulcerative colitis.
Presence of predominant bacterial CD signature in UC
First we compared the DGGE profiles from the two control groups, the healthy subjects and the unaffected partners of UC patients. After band class analysis we found no differences in the presence of bands or in band intensity. So in further analysis, data of both control groups were combined.
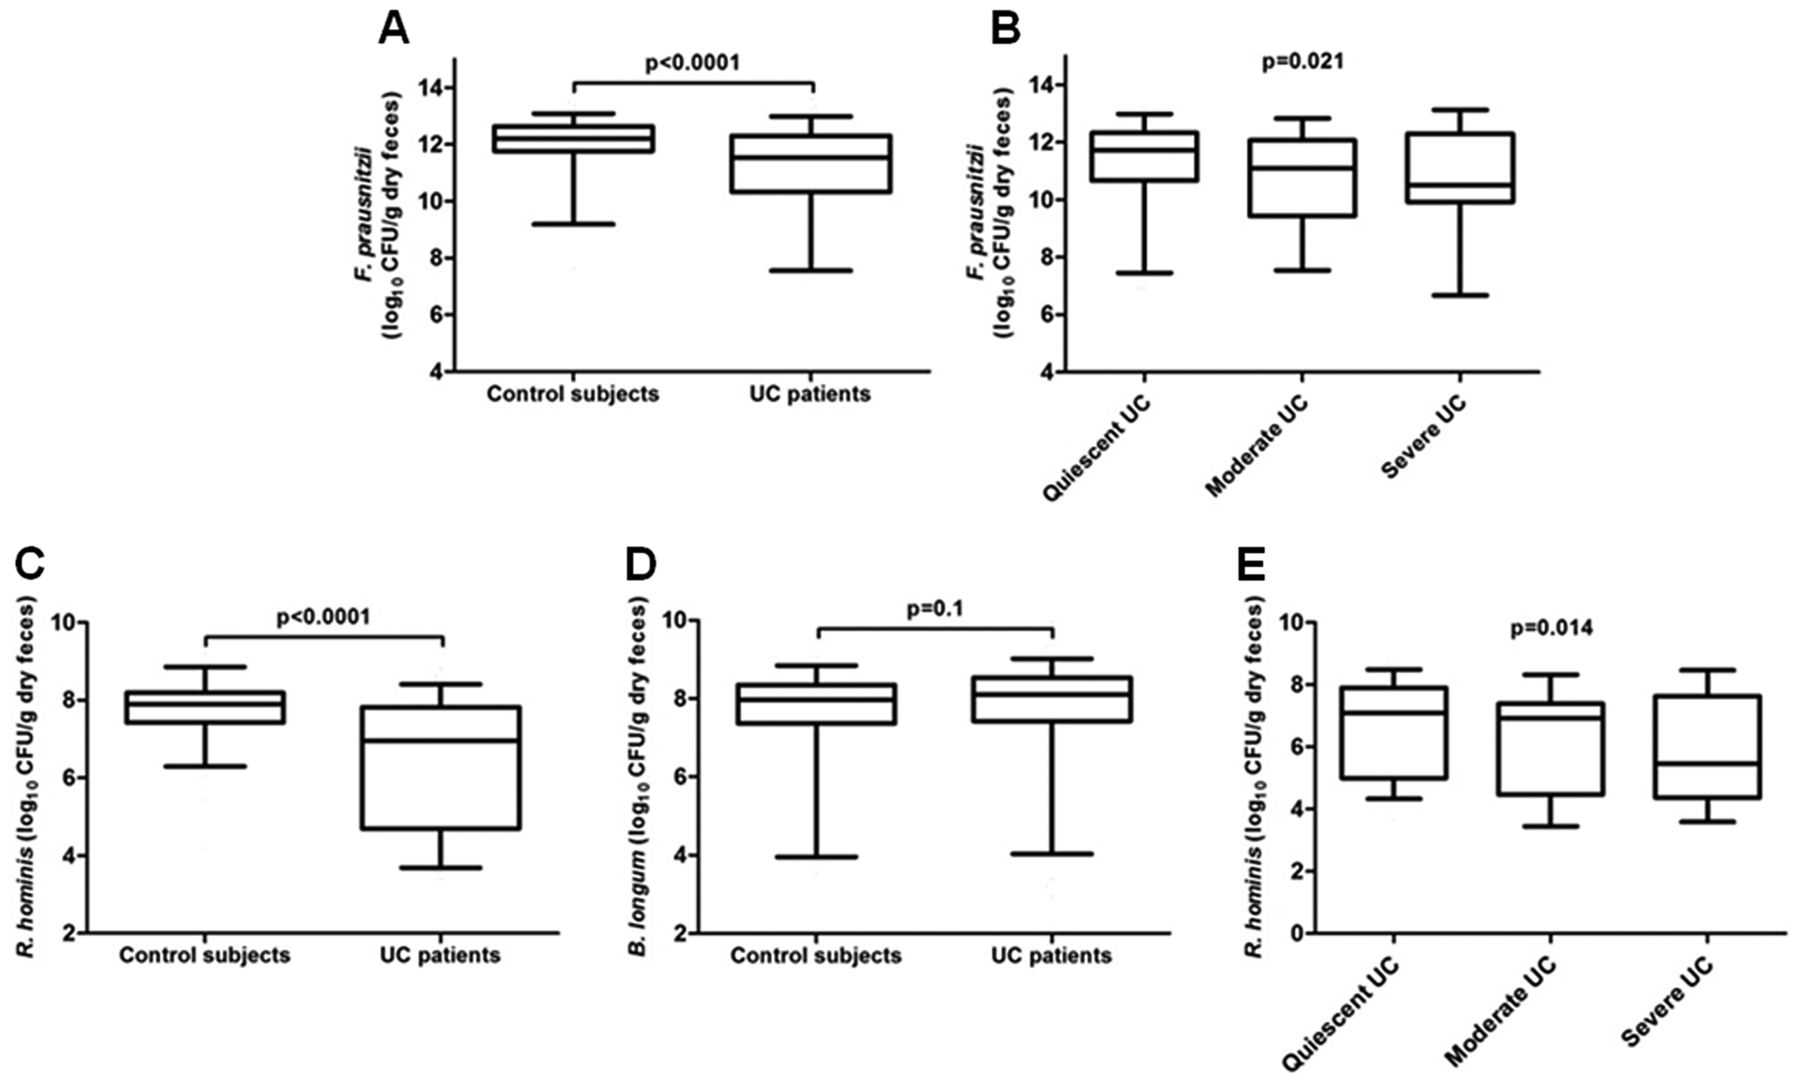
Overall, median band intensities for the bands belonging to the bacterial CD signature are shown in table 3. We analysed the three culturable bacteria from which DNA could be extracted and results were confirmed by RT–PCR in the previous study.24 Statistical comparison of the presence and intensity of each species, F prausnitzii, R gnavus and B adolescentis, was not significantly different between UC patients and controls (figure 1B). As F prausnitzii was reduced in UC patients compared to controls with a trend towards significance (uncorrected p=0.053), we quantified this species with RT–PCR. The bacterial count of F prausnitzii in UC patients was significantly lower (median 11.5 (IQR 10.3–12.3) log10 CFU/g dry feces) than controls (median 12.2 (IQR 11.8–12.6) log10 CFU/g dry feces; p<0.0001, figure 2A). Furthermore, there was an inverse correlation between the amount of F prausnitzii and disease activity: bacterial count was lowest in UC patients with severe disease (median 10.5 (IQR 10.2–12.2) log10 CFU/g dry feces) compared to moderate disease (median 11.1 (IQR 9.6–11.8) log10 CFU/g dry feces) and quiescent disease (median 11.7 (IQR 10.7–12.3) log10 CFU/g dry feces, figure 2B, τ=−0.156; p=0.021).
Band intensity of the species belonging to bacterial CD signature in UC patients and control subjects

Quantification of F prausnitzii, R hominis and B longum by RT–PCR. (A) RT–PCR for the count of F prausnitzii in control subjects and UC patients (log10 CFU/g dry feces). (B) Comparison of the count of F prausnitzii according to disease activity of UC patients. Kendall's tau coefficient, τ=−0.156. Count of (C) R hominis and (D) B longum in log10 CFU/g dry feces in control subjects and UC patients. (E) Influence of disease activity on the amount of R hominis. Kendall's tau coefficient, τ=−0.174. Box plots represent median, IQR and 95% CI. CFU, colony-forming units; RT, real-time; UC, ulcerative colitis.
Specific predominant dysbiosis in UC patients
PLS-DA analysis generated a clustering of controls, UC patients in remission and UC patients with active disease based on similar microbial profiles (figure 1D). Analysis of the 214 DGGE fingerprints resulted in the identification of 49 band classes. After correction for the number of band classes, two band classes differed significantly between UC patients and controls: band class 8.34 was significantly reduced in UC patients (pcorr=0.03) and band class 14.00 showed a higher intensity in UC patients when compared to controls (pcorr=0.01) (table 4). Frequency data analysis also showed a significant reduction in the presence of R hominis in UC patients (65.4%) compared to controls (84.9%) (pcorr=0.013) and a significantly higher presence of B longum in UC patients (59.1%) compared to controls (32.2%) (pcorr=0.01) (figure 1C). In order to identify the species represented by band class 8.34, bands from nine UC patients and bands from seven controls were purified and checked for co-migration of bands on a 45–55% gradient gel. Purification of the bands was repeated until a single band per sample was obtained. The purified bands were visualised on a 35–70% gel with the original sample profile from which they were excised. Sequencing of the amplicons from the purified bands showed identical sequence lengths, and BLAST analysis revealed 100% homology with the species R hominis (NCBI reference sequence: NC_015977.1). The second band class 14.00 matched a band present on the standard reference and could be assigned to the species B longum. BLAST analysis of the sequenced amplicons from 10 controls and six UC patients revealed 100% homology and confirmed our assignment as B longum (NC_017221.1).
Median intensity of band classes that differ significantly between UC patients and control subjects
As two species determined the predominant dysbiosis in UC, RT–PCR was used to quantify R hominis and B longum. The count of R hominis was significantly lower in UC patients (median 7.0 (IQR 4.7–7.8) log10 CFU/g dry feces) when compared to controls (median 7.9 (IQR 7.4–8.2) log10 CFU/g dry feces; p<0.0001, figure 2C). The count of B longum was not increased in UC patients (median 8.1 (IQR 7.4–8.5) log10 CFU/g dry feces) when compared to controls (median 8.0 (IQR 7.4–8.3) log10 CFU/g dry feces; p=0.1, figure 2D).
We next assessed whether disease activity influenced the count of bacteria and found a significant inverse correlation between the count of R hominis and disease activity: bacterial count was lowest in UC patients with severe disease (median 5.5 (IQR 4.4–7.5) log10 CFU/g dry feces) compared to moderate disease (median 6.9 (IQR 4.5–7.3) log10 CFU/g dry feces) and quiescent disease (median 7.1 (IQR 5.2–7.9) log10 CFU/g dry feces; τ=−0.174, p=0.014, figure 2E). No correlation was observed between the count of B longum and disease activity.
Furthermore, we determined the influences of several demographic and clinical variables on the count of R hominis. Only disease activity and duration of disease showed an inverse correlation with the amount of R hominis in UC patients (τ=−0.174, p=0.014, respectively, r=−0.2, p=0.024). No significant differences were found for 5-ASA (p=0.144), anti-tumour necrosis factor (TNF) medication (p=0.126) and disease extent (r=0.382, p=0.061). Furthermore, we evaluated independent associations and measured the influence of potential confounding factors on the count of R hominis. In the linear regression model we included age, gender, body mass index, duration of disease, medication (5-ASA, azathioprine/6-mercaptopurine, corticosteroids and anti-TNF), disease activity, disease extent, smoking and appendectomy. Analysis showed an influence of disease activity (p=0.005, β=−0.249) and duration of disease (p=0.021 β=−0.201) on the count of R hominis, hence confirming the results of the univariate and bivariate analysis. VIF and tolerance showed that there was no collinearity between the duration of disease and disease activity (VIF=1.6, respectively, 2.6 and tolerance=0.39, respectively, 0.64).
Finally, as a decrease of R hominis in UC patients is our novel and key finding, we quantified this species in an independent validation cohort. We found a significant reduction of R hominis in UC patients (median 7.2 (IQR 4.7–7.9) log10 CFU/g dry feces) compared to controls (median 7.7 (IQR 6.9–8.3) log10 CFU/g dry feces; p=0.02) (see supplementary figure 1A, available online only). Likewise, we confirmed a significant inverse correlation between the count of R hominis and disease activity. Patients with quiescent disease had a higher bacterial count (median 7.6 (IQR 6.4–8.6) log10 CFU/g dry feces) compared to patients with moderate disease (median 5.8 (IQR 4.7–7.5) log10 CFU/g dry feces) and severe disease (median 6.1 (IQR 4.7–7.8) log10 CFU/g dry feces; τ=−0.194, p=0.03) (see supplementary figure 1B, available online only).
Quantification of metabolites generated by bacterial species driving dysbiosis
To obtain functional insights, we measured the SCFA and main metabolites produced by the identified bacteria. Overall, total SCFA were significantly lower in UC patients. Only acetate and propionate concentrations were reduced in UC patients (table 5 and figure 3). d-Lactic acid and l-lactic acid were found in very low concentrations in UC patients and controls. Their concentration did not vary between both groups (table 5).
Comparison of SCFA (acetate, propionate and butyrate), d-lactic acid and l-lactic acid concentrations in fecal samples between UC patients and control subjects

Short-chain fatty acid levels in UC patients and control subjects show significantly lower levels for acetate (B) and propionate (C) but not for butyrate (A). Box plots represent median, IQR and 95% CI. UC, ulcerative colitis.
When assessing disease activity, we only found a significant correlation with the concentration of l-lactic acid: l-lactic acid was highest in UC patients with severe disease (median 0 (IQR 0–1.1) mM) as compared to moderate disease (median 0 (IQR 0–0.7) mM) and quiescent disease (median 0 (IQR 0–0) mM; τ=0.209, p=0.009).
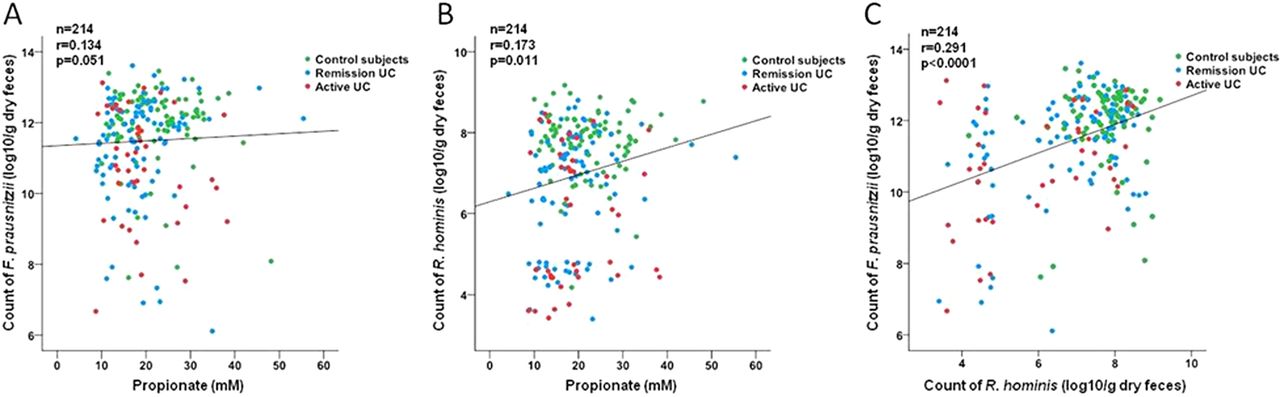
To gain further insight into the functional consequences of our observed dysbiosis, we correlated the count of each of the bacterial species with the concentration of metabolites. The count of F prausnitzii (r=0.134, p=0.051) and R hominis (r=0.173, p=0.011) only weakly correlated with the measured concentration of propionate but not with butyrate or acetate (figure 4A–B). Interestingly, a significant correlation between the count of F prausnitzii and the count of R hominis was seen (r=0.291, p<0.0001, figure 4C).
Correlation analysis of the species count determined by RT–PCR and the concentration of propionate measured in fecal samples. (A) Correlation between concentration of propionate and count of F prausnitzii and (B) between concentration of propionate and count of R hominis. (C) Positive correlation between F prausnitzii and R hominis in the total cohort. RT, real-time; UC, ulcerative colitis.
Discussion
In this study we hypothesised that dysbiosis is important not only in CD but also in UC pathophysiology and that this dysbiosis may partly overlap with the dysbiosis observed in CD. We therefore evaluated if the predominant microbial signature as we previously described in CD is also present in UC.24 The CD-associated signature was characterised by five bacterial species, namely a decrease in F prausnitzii, B adolescentis, D invisus and an uncharacterised species of Clostridium cluster XIVa, and an increase in R gnavus. In contrast, when we evaluated the culturable species F prausnitzii, B adolescentis and R gnavus in the present UC cohort, we did not find the same signature in UC patients based on DGGE analysis. Our study has shortcomings including the mixed patient population, a potential impact of differences in duration of therapy on the microbiota and the lack of information on dietary aspects. It might be possible that disease-relevant species could be missed using DGGE instead of pyrosequencing.
F prausnitzii is the most replicated species-specific finding in the study of the microbiota in IBD and reduction is confirmed in both mucosal and fecal samples of CD patients. Sokol et al,37 who first identified F prausnitzii in CD, also studied a small group of 17 UC patients and reported a reduction also in active UC patients. To our knowledge, our study is the first investigating F prausnitzii in a large cohort of only UC patients. We showed a significant reduction of F prausnitzii in active UC versus controls confirming the findings in the literature.37 Moreover, we observed a significant inverse correlation between disease activity and the count of F prausnitzii, although even in UC patients with quiescent disease, the count of F prausnitzii was still reduced. A strong anti-inflammatory effect of F prausnitzii has been demonstrated both in vitro and in vivo.21 Our findings indicate that a deficiency of this species might provoke or enhance inflammation. F prausnitzii produces high concentrations of butyrate. This is an important energy source for colonocytes, which also prevents mucosal atrophy. Consequently, butyrate improves the mucosal barrier function of the colon. Moreover, butyrate exhibits immunomodulatory effects and has anti-inflammatory properties as it downregulates pro-inflammatory cytokines.38 In fact, the strong anti-inflammatory effect of F prausnitzii in CD has not been so much attributed to butyrate, but rather to secreted metabolites blocking nuclear factor kappa B activation and IL-8 secretion.21
Another major and novel finding in our study is that we were able to identify two bacterial species driving dysbiosis in the fecal microbiota of UC patients. The first, R hominis, showed both predominantly (using DGGE) and quantitatively (using RT–PCR) a significant reduction in UC, and an inverse correlation was observed between R hominis and disease severity. To our knowledge this has never been reported. We validated these findings in an independent validation cohort and we were able to confirm our results. A recent study measured the bacterial composition using phylogenetic microarrays and also found a reduction of Roseburia spp. in UC patients, which is in alignment with our results.39 Furthermore in this study, patients were sampled twice during remission and the authors demonstrate a stable reduction of Roseburia spp., suggesting a permanent depletion of R hominis in patients with quiescent disease. These results are contrasted with those of Willing et al28 who did not find a reduction of Roseburia genus in mucosal biopsies from patients with UC nor in patients with colonic CD. They did find a reduction of Roseburia genus in mucosal biopsies from patients with ileal CD. Similarly, a twin study in UC described mucosal dysbiosis but found no reduction of Roseburia.27 In general, Roseburia seems to have a more prominent role when studying the transient microbiota compared to adherent microbiota. Our results suggest also anti-inflammatory mechanisms related to these bacteria. Interestingly, R hominis is like F prausnitzii a main butyrate-producing bacteria belonging to the Firmicutes phylum.40 Very little more is known about R hominis, except that it also shows β-glucuronidase and β-glucosidase activities in vitro.41 β-Glucuronidases are involved in the metabolism of xenobiotics but also in some beneficial effects of dietary compounds, in particular on the bioavailability of active metabolites originating from dietary compounds.42–44 Changes in the number of bacteria carrying those activities could affect a change in fecal glucosidase activity. A metagenomic study showed that most of the species harbouring β-glucuronidase activity, belong to the Clostridium leptum groups (cluster IV), one of the groups mostly described in IBD dysbiosis.42 In CD, β-glucuronidase activity was lower when compared to controls.45
We tried to obtain more functional insights into the observed UC dysbiosis by measuring the SCFA and lactic acid in fecal samples. The butyrate concentration, reported to be produced by F prausnitzii and R hominis, was lower in UC but lacked significance. Vernia et al46 found a negative correlation between the severity of UC and butyrate concentration, whereas Hove and Mortensen47 failed to show this correlation, which is in alignment with our findings. It seems that both a reduction of butyrate uptake and a reduction of butyrate oxidation contribute to the impaired butyrate metabolism in UC.48 This might explain why we did not observe a reduced fecal butyrate concentration of UC patients in our study. Acetate, the most prominent SCFA and main product of B longum, is important for lowering the intestinal pH. Tedelind et al49 have shown anti-inflammatory properties of acetate in vitro. Our results revealed a significantly lower amount of acetate in UC, but no correlation was observed between the acetate concentration and the count of B longum. The fecal concentrations of propionate were also reduced in UC, but for propionate, studies in IBD are limited. Propionate has anti-inflammatory properties that are equal to those of butyrate.49 ,50 Finally, lactic acid, the other main produced metabolite of B longum, was measured. Both d-lactic acid and l-lactic acid are bacterial metabolic products and lactic acid accumulates in feces from UC patients.47 ,51 We found a significant increase of the l-lactic acid isoform in patients with active disease versus controls, whereas d-lactic acid was not increased. Moreover, l-lactic acid correlated with disease severity confirming the results from previous studies.46 ,47 Overall, SCFA were reduced in UC patients, regardless of the degree of inflammation. The lack of clear correlations between the species and their metabolites highlights the complexity of interactions between the gut microbiota and their metabolites. The strong positive association between the count of both butyrate-producing bacteria, F prausnitzii and R hominis, may point to a possible additive or synergistic relationship between both species.
In conclusion, we showed that the composition of the fecal microbiota of UC patients differs from that of healthy individuals: we found a predominant reduction in R hominis and F prausnitzii, both well-known butyrate-producing bacteria of the Firmicutes phylum. These results underscore the importance of dysbiosis in IBD, but suggest that different bacterial species play a role in the pathogenesis of UC and CD.
Acknowledgments
The authors would like to thank Karen Windey, Sophie Organe, Greet Vandermeulen and Tamara Coopmans for their technical support.
References
Supplementary materials
Supplementary Data
This web only file has been produced by the BMJ Publishing Group from an electronic file supplied by the author(s) and has not been edited for content.
Files in this Data Supplement:
- Data supplement 1 - Online figure
- Data supplement 2 - Online table
Footnotes
-
Contributors KM: study concept and design, acquisition of data, analysis and interpretation of data, drafting of the manuscript, statistical analysis, and technical support; MJ: analysis and interpretation of data, drafting of the manuscript; SJ: technical support; VDP: analysis and interpretation of data, statistical analysis, drafting of the manuscript; IA: analysis and interpretation of data, drafting of the manuscript; VE: technical support, drafting of the manuscript; VB; collecting data; KC: technical support; FVI: critical revision of the manuscript for important intellectual content; KV: material support, critical revision of the manuscript for important intellectual content; MF: statistical analysis, critical revision of the manuscript for important intellectual content; JV: material support, critical revision of the manuscript for important intellectual content; PR: critical revision of the manuscript for important intellectual content; SV: study concept and design, acquisition of data, interpretation of data, drafting of the manuscript, obtained funding, material support and study supervision.
-
Funding This work was supported by the Geconcerteerde Onderzoekacties (GOA) of the KU Leuven (grant number GOA/11/015); MJ, IA and MF are postdoctoral fellows and SV is a clinical researcher of the Fund for Scientific Research-Flanders, Belgium (FWO-Vlaanderen).
-
Competing interests None.
-
Patient consent Obtained.
-
Ethics approval The study was approved by the ethics committee of the University of Leuven (Belgium) (ethics committee approval, S52 544 and S53684).
-
Provenance and peer review Not commissioned; externally peer reviewed.