Article Text

Abstract
Background and aims Rectal sensory and motor interactions in patients with IBS have not been studied in detail. The aim of this study was to evaluate fasting and postprandial rectal sensorimotor characteristics and their interactions in IBS compared with healthy controls.
Design We included 274 patients with IBS and 34 controls. All subjects underwent a rectal barostat study before and 60 min after a standardised liquid meal (800 kcal; 60% fat). Sensory thresholds, intensity of sensations, viscerosomatic referral and compliance were measured. During 15 min before the first distension sequence and until 50 min after meal intake, rectal balloon volumes were registered in 5 min intervals at operating pressure to quantify rectal tone. Mixed models were used to analyse the rectal tone response over time.
Results Rectal sensory thresholds and compliance were decreased and viscerosomatic referral areas increased in patients with IBS compared with controls. Meal intake increased rectal sensitivity, compliance and referral areas in patients and controls and the same proportions of patients were hypersensitive to distension before and after meal intake. There was a higher basal rectal tone in IBS and a significantly different rectal tone response after meal intake in patients with IBS compared with controls and, interestingly, also in IBS with rectal hypersensitivity (defined in the preprandial state), compared with normosensitive patients.
Conclusions Meal intake affects rectal sensorimotor function in IBS and health. Importantly, the rectal tone responses to a high-caloric meal are different between patients with IBS and controls, as well as between hypersensitive and normosensitive patients with IBS.
- IRRITABLE BOWEL SYNDROME
- COLORECTAL PHYSIOLOGY
- INTESTINAL MOTILITY
- VISCERAL SENSITIVITY
Statistics from Altmetric.com
Significance of this study
What is already known about this subject?
-
Altered visceral sensory and motor functions are considered to be central pathophysiological mechanisms in IBS.
-
Meal intake enhances rectal visceroperception when measured in healthy subjects and patients with IBS.
-
Exaggeration of GI symptoms after meal intake is a common feature in IBS, but meal provocation tests have not resulted in better insight into mechanisms underlying the clinical observation.
What are the new findings?
-
Patients with IBS have a higher basal rectal tone and a decreased rectal compliance compared with healthy subjects.
-
The rectal tone response after meal intake comparing patients with IBS and controls are significantly different, also when comparing patients grouped into those with and without rectal hypersensitivity.
-
Rectal sensory and motor functions seem to be closely related to each other.
How might it impact on clinical practice in the foreseeable future?
-
In order to gain insight into factors important for symptom generation in IBS, GI sensory and motor functions need to be evaluated in parallel as related pathophysiological mechanisms.
Introduction
IBS is common worldwide with a prevalence of approximately 1 in 10 in the adult population.1 The clinical diagnosis relies on symptom-based diagnostic criteria that have been revised at regular intervals since the advent of the Manning criteria2 up until the current Rome III criteria.3 In addition, a reasonable clinical investigation using blood biochemistry, endoscopy and sometimes radiology is often done to confirm the diagnosis by exclusion of common detectable organic abnormalities with current methods. Even so, an increasing amount of research has identified pathophysiological abnormalities in IBS, including sensory4–7 and motor8–10 aberrations in GI function as well as altered brain activity on functional brain imaging studies.11 ,12 Pathogenetic mechanisms like low-grade immune activation,13 altered gut microbiota,14 mucosal barrier dysfunction15 ,16 and food-related factors17 have been proposed, but no single pathophysiological or pathogenetic mechanism has been proven to be unique for IBS or affect other than subgroups of the IBS population, and the interaction between different pathophysiological mechanisms have rarely been scrutinised.
Mainly for reasons of accessibility, the rectum has been extensively studied in IBS, and rectal barostat studies have focused on studying either sensory4–7 18–21 or motor function22 ,23 in IBS compared with controls. While these studies showed alterations of rectal sensory or motor function in (subgroups of) patients with IBS, interactions between both have not been studied in detail. We hypothesised that these pathophysiological mechanisms are inextricably linked, and that combined knowledge of both of them provides a better basis to understand how IBS symptoms are generated. For instance, in patients who experience diarrhoea or constipation without any signs of GI transit abnormalities,10 rectal sensorimotor function might be central. As exaggeration of symptoms after meal intake is another common feature in IBS,9 ,24 ,25 different meal-provocation tests have been proposed and evaluated.26–28 However, the effect of a provocative meal on rectal sensory and motor function, as well as their interaction in patients with IBS and healthy controls, has not been studied in great detail to date.
With this as a background, the general aim of this study was to evaluate fasting and meal-induced rectal sensorimotor characteristics, as well as interactions between sensory and motor function, in a large cohort of patients with IBS and to compare them with a control group of healthy volunteers without GI symptoms. More specifically, we addressed the following research questions: First, we tested the effect of meal intake on rectal sensitivity parameters in patients with IBS (including Rome III subgroups) and healthy controls, as well as whether this effect differed between (sub)groups. Second, we tested the effect of meal intake on rectal compliance in patients with IBS (including subgroups according to sensitivity and Rome III) and healthy controls, as well as whether this effect differed between (sub)groups. Finally, we assessed the rectal motor response to a meal in IBS (including subgroups according to sensitivity and Rome III) and tested whether this response differed between (sub)groups.
Material and methods
Subjects
We prospectively included patients fulfilling Rome II29 and later Rome III3 criteria for IBS, who consulted at a single tertiary care outpatient unit (Sahlgrenska University Hospital, University of Gothenburg, Sweden) and agreed to take part in pathophysiology studies during the time period November 2002 until May 2010. The diagnosis was based on a typical clinical presentation and additional investigations if considered necessary, but most patients had already undergone sufficient examinations by the referring physician. Classification into IBS subtypes according to Rome III criteria was done based on Bristol Stool Form scale (BSF)30 characteristics: IBS with constipation (IBS-C), IBS with diarrhoea (IBS-D), mixed IBS (IBS-M) or unsubtyped IBS (IBS-U). Patients classified as IBS-U or IBS-M were treated as one group (IBS-nonCnonD) in the statistical analysis and the presentation of data. The control group was recruited through advertisement and checked by interview and a questionnaire in order to exclude chronic diseases and any current GI symptoms.
All patients and controls were given study-specific verbal and written information before giving their written consent to participate in the studies. The Regional Ethical Review Board at the University of Gothenburg had approved each of the studies included in this manuscript prior to the start of patient inclusion.
Study design
All medications with known effects on the GI tract were discontinued at least 48 h before the study. Each patient came to the laboratory at 7:30 after an overnight fast, received a tap water enema (750 mL) for rectal emptying and was then positioned in a left lateral decubitus position in a hospital bed. All subjects underwent a rectal barostat study with two distension sequences, one before and one 60 min after an 800 kcal, 560 mL liquid meal (60% fat, 20% carbohydrate, 20% protein; 100 mL cream, 85 mL water, 100 mL Nutridrink, 275 mL Fortimel (Nutricia Nordic AB, Stockholm, Sweden)).27 The barostat device consisted of a polyethylene balloon attached to a double-lumen polyvinyl tube (Salem Sump Tube, 18F; Sherwood Medical, Tullamore, Ireland). The distance between the balloon attachment sites was 8 cm, resulting in a spherical balloon shape at maximal volume of 650 mL. Leaks were ruled out by repeated inflation before rectal insertion and the catheter was then positioned by leaving the distal attachment site 5 cm from the anal verge. After this, the balloon catheter was connected to a computer-driven electronic barostat (Dual Drive Barostat, Distender Series II; G&J Electronics, Toronto, Ontario, Canada). Two distensions at 25 mm Hg were performed to unfold the balloon. The operating pressure (OP) was set to 2 mm Hg above the minimal distending pressure (MDP) necessary to record respiratory variations in the balloon volume. Before the actual study start, an initial habituation distension sequence was performed until the discomfort threshold was reached in order to have reproducible results from repeated measurements and avoid novelty effects.31
Rectal sensorimotor function
After the habituation sequence, a 15 min equilibrium period at OP followed where balloon volumes were recorded continuously and averaged at 5 min intervals as an indirect measure of rectal tone. The distension protocol consisted of phasic isobaric distensions (45 mL/s) lasting 30 s, followed by a 30-second interval at OP. Distensions were performed with stepwise increments starting at the OP and increasing 5 mm Hg until the subject reported pain or when a pressure level equal to 70 mm Hg minus OP was reached (ascending method of limits). During the last 10 s of each distension step, the perceived sensation was graded 1–5 on a keypad as follows: (1) no sensation, (2) rectal fullness, (3) urge to defecate, (4) discomfort, (5) pain. Following each of the distensions, all subjects also rated the perceived intensity of unpleasantness during the distension, using a 100 mm visual analogue scale (VAS) ranging from ‘no unpleasantness’ to ‘worst imaginable unpleasantness’, and at the end of study, the intensity of pain by the same type of VAS. During the 60 min period after the test meal until the second distension sequence, OP was maintained and balloon volumes recorded continuously and averaged at 5 min intervals. After each of the two distension sequences, each subject was asked to mark the location of their sensations on a schematic body map (scale 1:4)21 to assess viscerosomatic referral for painful and non-painful sensations separately. The sequence of events is summarised in figure 1.

The sequence of events during the rectal barostat study.
Data analysis
Sensory thresholds for urge to defecate, discomfort and pain were determined (mm Hg). Pressure levels are given relative to the OP (MDP +2 mm Hg). If pain was not experienced in the distension range used in the study, the pain threshold was set to 70 mm Hg-OP. The mean pressure −2 SD for the pain threshold in healthy controls was used to define an abnormal sensory threshold in patients, that is, visceral hypersensitivity. This definition for hypersensitivity has been commonly used in previous rectal21 ,32 and gastric barostat studies.33 Preprandial thresholds were used to define sensitivity subgroups. Patients with IBS were subdivided according to sensitivity to test whether a meal would differentially affect compliance or rectal tone in hypersensitive versus normosensitive patients. VAS for unpleasantness was measured, and a mean (mm) from the first four distensions was calculated in order to have comparable results with a previous study performed by our group.21 To assess the viscerosomatic referral during rectal distensions, the corresponding area of perceived sensations, pain and non-painful sensations separately, was calculated from the body maps (cm2). The first five distension steps of the pressure-volume curves were used for analysis of compliance, as the initial part of the curve is linear, which permits to quantify dynamic compliance as the linear slope of the curve.34 ,35 Further, data up to the fifth distension step are available in 75% of the subjects, as most subjects have not yet reached pain threshold at this step. Rectal volumes were recorded and averaged at each 30 s distension step and used for the pressure/volume (ie, compliance) analysis. Rectal volumes were also recorded and averaged for three 5 min intervals before meal intake and for ten 5 min intervals after finishing the meal to measure the rectal tone response.
Statistical analysis
SAS V.9.3 (SAS Institute, Cary, North Carolina, USA) was used for all analyses. Data are presented as mean±SD. Statistical significance is defined as p<0.05, two-tailed.
For each rectal sensory parameter, a mixed model two-way analysis of variance (ANOVA) was estimated including ‘group’ (IBS vs controls, or sensitivity-based or Rome III-based IBS subgroup) as between-subject effect, ‘meal’ (preprandial vs postprandial) as within-subject effect and a group-by-meal interaction effect. The main effect of group tests the difference between groups (premeal and postmeal combined), whereas the main effect of meal tests the difference between premeal and postmeal (both groups combined). The group-by-meal interaction effect tests a putative differential effect of the meal between both groups. However, when the interaction effect was not found to be significant, only main effects will be reported for parsimony.
For rectal compliance, the effect of meal ingestion and (sub)group on the slope of the rectal pressure-volume curve was tested using mixed model regression with rectal volume as the dependent variable and the following independent variables: ‘distending pressure’ (continuous, within-subject), ‘meal’ (preprandial vs postprandial, within-subject) and ‘(sub)group’ (IBS vs controls, or sensitivity-based or Rome III-based subgroups, between-subject). Unstructured and first-order autoregressive variance-covariance matrices were used to model the (co)variance structure of the within-subject effects ‘meal’ and ‘distending pressure’, respectively. ‘Distending pressure-by-meal’ and ‘distending pressure-by-(sub)group’ interaction effects constitute the effects of interest, as they test whether the slope of the pressure-volume curve (ie, rectal compliance) is influenced by meal intake (over groups) and group (preprandial and postprandial combined), respectively. To test whether the influence of a meal on the slope of curve differs between groups, a three-way distending pressure-by-meal-by-group interaction effect was added to the model, but will only be reported when significant for parsimony.
To compare preprandial rectal tone between groups (IBS vs controls, or sensitivity-based or Rome III-based IBS subgroups), a mixed model two-way ANOVA was used with (preprandial) rectal volume (measured repeatedly in each of the three 5-min time bins) as the dependent variable, ‘(sub)group’ as between-subject effect and ‘time bin’ as within-subject effect. An unstructured variance-covariance matrix was used to model the (co)variance structure of the within-subject effect ‘time bin’. The main effect of ‘group’ is the effect of interest here as it tests the average difference in rectal volume over the three time bins between groups. A group-by-time interaction effect can be added to test whether this difference varies between time bins, but will only be reported when significant for parsimony.
In order to compare the rectal tone response to a meal between groups, the preprandial rectal volumes were averaged over the three time bins and subtracted from the volumes in each postprandial time bin. The resulting 10 δ values were used as the dependent variable in a mixed model analysis with the following independent variables: ‘(sub)group’ (between-subject) and linear, quadratic and third-order effects of time (as a continuous variable). The time effects were used to model the time course (or ‘shape’) of the rectal tone response curve, consisting of an initial linear decrease, followed by a turn around nadir and slower recovery towards baseline (see figure 3A,B). Group-by-time interaction effects are the effects of interest here as they test for a difference in the linear, quadratic and third-order components of the time course of the rectal volume response (or ‘shape’ of the curve) between groups.
Results
A total of 274 patients with IBS (204 women, 75%) and 34 healthy controls (26 women, 76%) were included in the study. They were of similar age (39±13 (mean±SD) years for the patients and 35±13 years for the controls, p=0.10) and gender distribution (χ²=0.065, df=1, p=0.80). Stratification into subtypes according to the Rome III criteria could be done in 214 patients who had all participated in studies where registration of stool form by BSF was done: IBS-C 49 (23%), IBS-D 94 (44%) and IBS-nonCnonD 71 (33%).
Rectal sensitivity
Descriptive data (preprandial and postprandial average values and SDs for patients with IBS and healthy controls) as well as results of the mixed two-way ANOVA models are summarised in table 1. The cut-off for rectal hypersensitivity in this study (see methods section) was <31 mm Hg in the preprandial state and <26 mm Hg in the postprandial state. By this definition, 120 (44%) patients with IBS were hypersensitive before meal intake and 106 (39%) after meal intake.
Preprandial and postprandial rectal sensitivity parameters in patients with IBS and healthy controls
IBS versus controls
Sensory thresholds for defecatory urge, discomfort and pain were significantly lower (p<0.0001 for all) in patients with IBS compared with controls (main effect of ‘group’) (table 1). Further, a significant main effect of ‘meal’ was found for all parameters except for perceived pain intensity, with a postprandial decrease in sensory thresholds (table 1) and increase in the size of viscerosomatic referral areas over both groups. No significant group-by-meal interaction effect was found for any of the rectal sensitivity parameters, indicating that the sensitising effect of the meal did not differ between patients with IBS and controls.
IBS subgroups: Rome III
When comparing subgroups according to Rome III criteria within the IBS sample, a significant main effect of ‘subgroup’ was found for the perceived intensity of pain only (F2.206=10.4, p<0.0001), with patients with IBS-D having higher pain ratings compared with IBS-C and IBS-nonCnonD (p=0.007 and <0.0001, respectively, post hoc t tests with Tukey correction). No main effects of ‘subgroup’ or subgroup-by-meal interaction effects were found for any of the other rectal sensitivity parameters (data not shown).
Rectal compliance
IBS versus controls
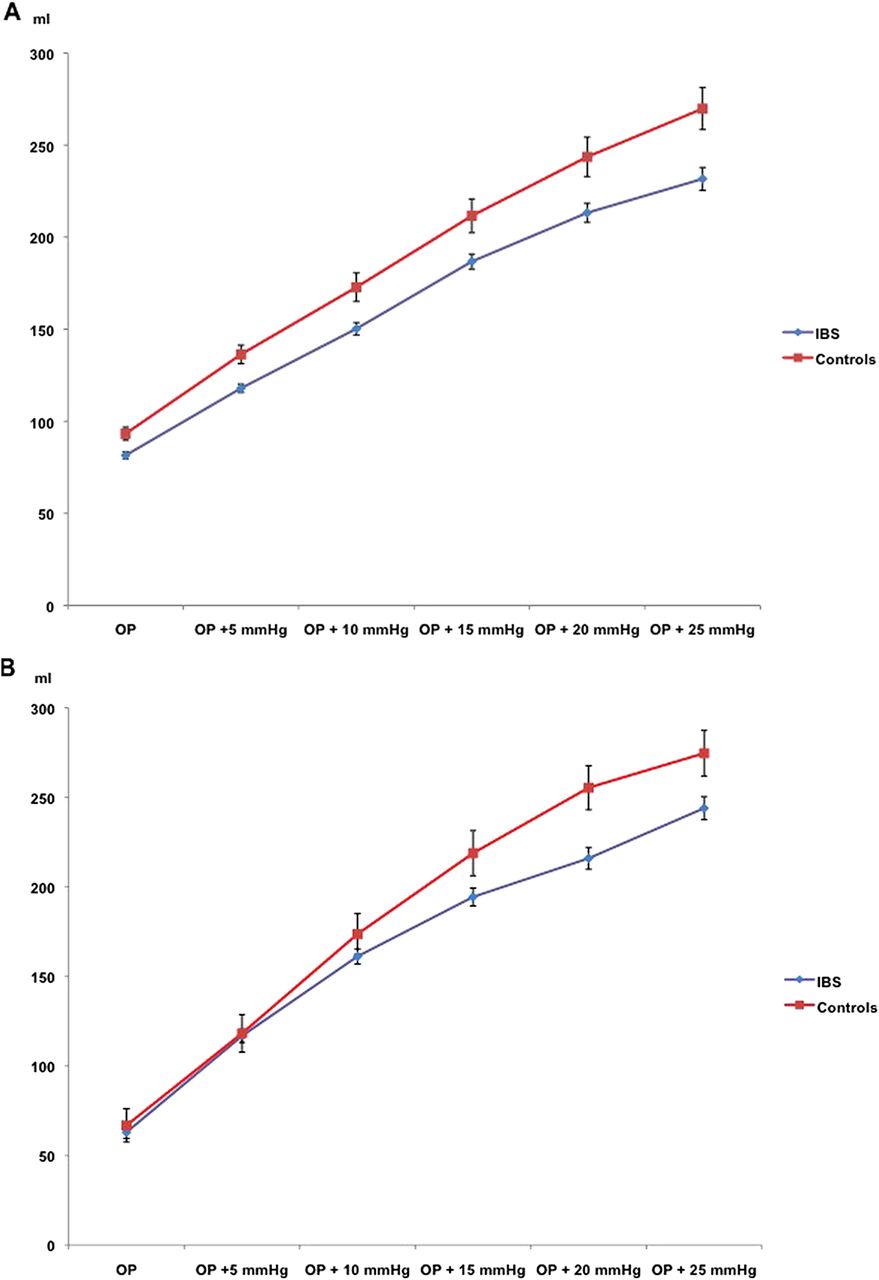
Meal intake significantly increased the slope of the pressure-volume relationship (ie, rectal compliance) over both groups, as reflected by the significant meal-by-distending pressure interaction effect (β=1.6±0.2, F1.2559=97.7, p<0.0001) (figure 2A and B). The β coefficient for this interaction effect represents the average difference in slope of the curve between preprandial (slope=7.2±0.2) and postprandial (slope=8.8±0.2) measurements over both groups. Moreover, a significant group-by-distending pressure interaction effect was found as well (β=−0.8±0.4, F1.2559=4.0, p<0.05), due to a significantly lower slope of the curve in patients with IBS (slope=7.6±0.1) versus controls (slope=8.4±0.4) over preprandial and postprandial measurements combined. The effect of meal intake on compliance did not differ significantly between patients with IBS and controls, as reflected by the non-significant distending pressure-by-meal-by-group three-way interaction effect (p=0.71).

Preprandial (A) and postprandial (B) rectal volume-pressure relationship (dynamic compliance) in patients with IBS and healthy controls (mean volume, SEM). Meal intake significantly increased the slope of the pressure-volume relationship in both groups, but the effect did not differ significantly between patients with IBS and controls.
IBS subgroups: hypersensitive versus normosensitive
No significant subgroup-by-distending pressure interaction effect was found (p=0.31), indicating that the slope of the pressure-volume curve was not significantly different between hypersensitive and normosensitive patients, over preprandial and postprandial measurements combined. Further, no significant distending pressure-by-meal-by-subgroup three-way interaction effect was found (p=0.15), indicating that the effect of meal intake on compliance did not differ significantly between hypersensitive and normosensitive patients with IBS.
IBS subgroups: Rome III
When comparing subgroups according to Rome III criteria within the IBS sample, no significant subgroup-by-distending pressure interaction effect was found (p=0.47), indicating that the slope of the pressure-volume curve was not significantly different between Rome III subgroups, over preprandial and postprandial measurements combined. Further, no significant distending pressure-by-meal-by-subgroup three-way interaction effect was found (p=0.59), indicating that the effect of meal intake on compliance did not differ significantly between Rome III subgroups.
Rectal tone
Preprandial tone
Patients with IBS versus controls
The MDP was significantly higher in patients with IBS compared with the control group (6.3±3.0 mm Hg vs 5.1±2.8 mm Hg; p=0.03). Over the three preprandial 15 min time bins, average balloon volumes at OP were significantly lower in patients with IBS compared with healthy controls (84.3±1.8 vs 99.1±5.1, main effect of group β=−14.8±5.4, F1.305=7.6, p=0.006), indicating higher preprandial rectal tone in patients with IBS. This difference was constant over the three time bins, as no significant time bin-by-group interaction effect was found (p=0.82).
IBS subgroups: hypersensitive versus normosensitive
There was no difference in MDP between hypersensitive and normosensitive patients with IBS (6.4±3.1 mm Hg vs 6.1±2.9 mm Hg; p=0.37). No significant main effect of group on preprandial rectal tone was found (β=−4.8±3.6, F1.271=1.8, p=0.18).
IBS subgroups: Rome III
There was no significant difference in MDP between Rome III IBS subgroups. A significant main effect of ‘subgroup’ on preprandial rectal tone was found (F1.213=3.42, p=0.035), with the difference between subgroups being constant over the three time bins, as no significant time bin-by-group interaction was found. Post hoc t tests with Tukey correction indicated that this effect was driven by a significantly lower preprandial rectal tone (larger balloon volume) in patients with IBS-nonCnonD compared with IBS-D (p=0.028).
Postprandial tone
Patients with IBS versus controls
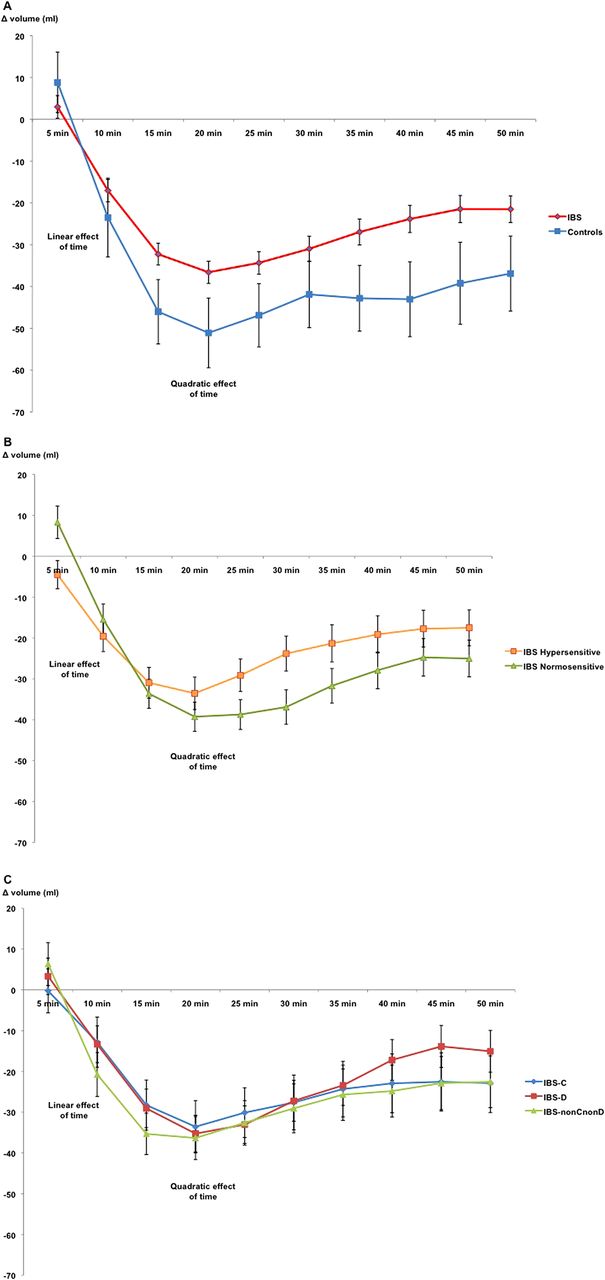
A significant linear, quadratic and third order effect of time was found (all p<0.0001), confirming that the shape of postprandial rectal tone response curve can be modelled using a combination of the three effects of time. Further, a significant time-by-group (β=1.1±0.4, F1.2453=8.6, p=0.003) and time2-by group (β=−0.017±0.007, F1.2453=6.2, p=0.01) interaction effect was found, indicating a significant difference in time course of the postprandial rectal tone response (ie, shape of the curve) between patients with IBS and controls. More specifically, the significant time-by-group interaction effect was due to a stronger negative slope of the initial linear part of the curve in controls (slope=−6.5±0.4) compared with patients with IBS (slope=−5.3±0.2). The significant time²-by-group interaction was due to a stronger quadratic effect (representing the turnaround nadir and subsequent return to baseline in the second part of the curve) in controls (0.24±0.01) compared with patients with IBS (0.22±0.01). The results are illustrated in figure 3A.

Rectal tone response after meal intake in patients with IBS compared with controls (A) and in hypersensitive and normosensitive patients (B) as well as IBS subtypes (C). Volumes represent the change from the preprandial mean volume. There was a significant difference in time course of the postprandial rectal tone response when comparing patients with IBS with controls and when comparing hypersensitive and normosensitive patients with IBS. There were no significant differences between IBS subgroups. The parts of the curves representing linear and quadratic effects of time are demonstrated in the figure (mean volume, SEM).
IBS subgroups: hypersensitive versus normosensitive
A significant time-by-group (β=1.6±0.2, F1.2189=39.7, p<0.0001) and time2-by group (β=−0.027±0.004, F1.2189=35.7, p<0.0001) interaction effect was found, indicating a significant difference in time course of the postprandial rectal tone response (ie, shape of the curve) between hypersensitive and normosensitive patients with IBS. More specifically, the significant time-by-group interaction effect was due to a stronger negative slope of the initial linear part of the curve in normosensitives (slope=−5.9±0.3) compared with hypersensitives (slope=−4.4±0.3). Further, the significant time2-by-group interaction was due to a stronger quadratic effect (representing the turnaround nadir and subsequent return to baseline in the second part of the curve) in normosensitives (0.23±0.01) compared with hypersensitives (0.20±0.01). The results are illustrated in figure 3B.
IBS subgroups: Rome III
No significant time-by-subgroup interaction effects were found, indicating a similar time course of the postprandial rectal tone response in the three Rome III based IBS subgroups (figure 3C).
Discussion
The pathophysiology of IBS is incompletely understood and multiple underlying mechanisms have been proposed. Sensorimotor (dys)function has most often been studied separately in relatively small patient groups, but in our current study we have aimed to evaluate rectal sensory and motor functions including biomechanical aspects, their complex interaction and how they are influenced by meal ingestion in a large cohort of patients with IBS and a healthy control group. This combined analysis generated novel observations regarding a higher basal rectal tone in IBS and a different rectal tone response after meal intake comparing patients with IBS and controls and, most importantly, also when comparing patients grouped into those with and without rectal hypersensitivity defined in the preprandial state.
In the preprandial situation patients with IBS have a higher rectal tone expressed by higher MDPs and lower corresponding balloon volumes compared with controls. This was not affected by rectal sensory classification but patients with IBS-D had a higher rectal tone compared with the nonCnonD subgroup. The rectal tone response after a meal seems to comprise a number of different elements, based on an in-depth analysis. Using mixed models we were able to describe the time course of the postprandial rectal tone response in a more detailed way, in terms of a significant linear, quadratic and third-order effect of time, and compare this response between patients with IBS and controls as well as between IBS subgroups, using group-by-time interaction effects. Patients with IBS in general, and patients with IBS with preprandial visceral hypersensitivity in particular, have a less pronounced initial linear decrease of rectal volumes and a slower recovery, the quadratic part of the time course that represents the speed of the ‘turn’ around the nadir volume, compared with healthy controls after the meal. The basis for this phenomenon may be related to the observed differences in preprandial rectal tone and a less compliant, stiff, rectum in patients with IBS. The minor preprandial differences in IBS subgroups did not result in a detectable difference in the rectal tone response after meal intake. When comparing our findings with other studies, there are trends in the same direction, but either a different definition of patient groups or anatomical points of measurement have been used. Steens et al36 reported an increased tone after meal intake in IBS-D and controls, but not in IBS-C. Their definition of IBS-subtype was relying on stool frequency rather than stool form, which makes the results difficult to compare. On the other hand there are results similar to ours from measurements in the sigmoid colon, but in a study without any differentiation into sensory subgroups.22
The important question whether a combined sensorimotor algorithm can improve our understanding of symptom generation in IBS remains to be proven. Even if visceral hypersensitivity is considered as a major pathophysiological mechanism, it cannot by itself explain the occurrence of abdominal pain or discomfort that is obligate for IBS since the hypersensitivity only affects a proportion of the patients. In the same manner, the even smaller group having a transit abnormality9 ,10 ,37 cannot by itself sufficiently explain the disturbed bowel habit. It is tempting to speculate that a combination of two major pathophysiological mechanisms into subtypes with dominating sensory, motor or combined sensorimotor characteristics, could lead us closer to understanding symptom generation in IBS compared with the current subtypes based on stool form.3 As seen in this manuscript regarding Rome III criteria and also shown by others regarding Rome II criteria.9 ,21 ,38 current subtypes do not offer a significant discriminatory value from a pathophysiological point of view.
We confirmed findings from previous studies in smaller cohorts when it comes to rectal sensory function: perception thresholds are lower,4–6 ,18 perceived intensities of sensations are higher20 ,21 and viscerosomatic referral areas are larger7 ,20 ,21 in IBS compared with controls. Further, 44% of patients with IBS could be classified as having rectal hypersensitivity in the preprandial state, which is roughly in line with earlier studies.18 ,32 ,39 Testing rectal sensory function for a second time after intake of a standardised meal yielded similar results as reported by Ludidi et al,26 that is, the proportion of hypersensitive patients with IBS was not altered even if meal intake significantly decreased rectal sensory thresholds, but to the same extent regardless if the person had IBS or not. The observation that the viscerosomatic referral area increases after meal intake is in line with our previous results after duodenal lipid infusions,40 but the response once more is not different between patients and controls. Meal intake therefore affects sensory function with a non-significant difference comparing IBS with the healthy controls, which results in a quite similar proportion of patients with IBS with rectal hypersensitivity postprandially (39%). However, for patients with IBS who are hypersensitive with low thresholds already in the fasting state, further reduction of sensory thresholds after meal intake will lead to generation of pain and discomfort with normally innocuous/physiological stimuli, which may partly explain exaggerated symptoms postprandially.
Decreased rectal compliance, shown by a less steep pressure/volume relationship during the distension sequences before and after meal intake, was evident in IBS compared with healthy controls. Even if the meal increased compliance, the magnitude of the increase in patients and controls was similar, and therefore the group difference remained. Having a hypersensitive rectum or belonging to any specific IBS subgroup did not result in a significant effect on compliance. There are conflicting data from other studies regarding compliance, where some report decreased compliance,31 ,36 ,41 ,42 while others cannot detect a difference between patients with IBS and control subjects.7 ,26 ,43 As a comparison, Ludidi et al26 used a separate staircase distension protocol for assessment of compliance in their recent study with a similar meal provocation as in our current one, showing no difference in dynamic compliance before or after a meal within the IBS group, or between patients with IBS and controls. Even if our distension protocol is not considered to be ideal for investigation of compliance, the results presented by Kwan et al42 some years ago are in line with our findings. The segment of the distension protocol that we used for calculations is in a relatively low pressure range (OP to OP + 25 mm Hg), meaning that only a minority of patients and just a few controls will have reached the pain threshold. Since rectal volumes in that situation are relatively low, the risk for the volume/pressure ratio to reflect physiological mechanisms other than those related to active contractile tissue properties probably are negligible. Non-compliant tissue elements get more involved in the painful pressure ranges. From this, we propose that the findings retrieved in our large patient sample show that patients with IBS have decreased rectal compliance in the physiological distension ranges.
The question arises if sensory and compliance findings like ours after a repeat barostat procedure in the same day represent an order effect or a true change in rectal physiology induced by the meal. To start with, the use of a habituation distension sequence has been shown by Hammer et al31 to result in reproducible responses of sensation and compliance on a single day. In the same manner, variation of compliance and sensory data from rectal distensions was minimal when repeating the procedure on the same day as reported by Cremonini et al44 Quite a large number of meal provocation studies with varying distension protocols, meal compositions and routes of nutrient delivery also rather uniformly favour a physiological effect,26–28 ,40 ,45 ,46 rather than an artefact from repeated distensions. Moreover, in our previous study, colonic sensitivity after duodenal infusion of saline (control day) was not different from before the infusion, as opposed to duodenal lipid infusion.45 The ideal solution to sort things out would be to randomise the order of preprandial and postprandial distensions to avoid order effects. This would be a difficult study to perform in a large sample of patients, and as long as it is lacking the existing knowledge reasonably supports the meal intake rather than other factors as the main reason for the observed changes in rectal physiology parameters in our study.
In conclusion, this large comprehensive study reports on preprandial and postprandial rectal sensorimotor function in patients with IBS and a healthy control group. Meal intake was found to have a sensitising effect on the rectum and increase rectal compliance, but not to a different extent in patients with IBS and healthy controls. The most novel finding is the close relationship between two pathophysiological factors considered as central in IBS, GI motility and GI sensitivity, where the rectal tone response in IBS is significantly different from the healthy situation and also different within the IBS group depending upon rectal sensory status. Whether it is the sensory function affecting the motor response, or the other way around needs to be further clarified, as well as the relation of these two mechanisms and their interaction to psychosocial comorbidity and symptom generation.
References
Footnotes
-
Contributors HT: analysis and interpretation of data, drafting of the manuscript, critical revision of the manuscript for important intellectual content. LVO: analysis and interpretation of data, statistical analysis, critical revision of the manuscript. JT: analysis and interpretation of data, critical revision of the manuscript. MS: study concept and design, acquisition of data, analysis and interpretation of data; critical revision of the manuscript.
-
Funding The Swedish Medical Research Council (grants 13409, 21691 and 21692). The Marianne and Marcus Wallenberg Foundation. University of Gothenburg, Centre for Person-Centred Care (GPCC), Sahlgrenska Academy, University of Gothenburg and by the Faculty of Medicine, University of Gothenburg.
-
Competing interests HT: served as a Consultant/Advisory Board member for Almirall, Danone and Shire. MS: received unrestricted research grants from Danone and AstraZeneca, and served as a Consultant/Advisory Board member for Danone, Novartis, Almirall, Albireo, and Shire. LVO: none. JT: Scientific adviser to Almirall, AstraZeneca, Cosucra, Danone, GlaxoSmithKline, Ironwood, Janssen, Menarini, Novartis, Rhythm, Shire, Takeda, Theravance, Tranzyme, Tsumura, Will pharma, Zeria. Research grant or support: Abbott, Alpro, Novartis, Shire. Speaker bureau: Abbott, Almirall, AstraZeneca, Danone, Janssen, Menarini, Novartis, Shire, Takeda, Zeria.
-
Ethics approval The Regional Ethical Review Board at the University of Gothenburg.
-
Provenance and peer review Not commissioned; externally peer reviewed.