Article Text

Abstract
Objective Data from clinical research suggest that certain probiotic bacterial strains have the potential to modulate colonic inflammation. Nonetheless, these data differ between studies due to the probiotic bacterial strains used and the poor knowledge of their mechanisms of action.
Design By mass-spectrometry, we identified and quantified free long chain fatty acids (LCFAs) in probiotics and assessed the effect of one of them in mouse colitis.
Results Among all the LCFAs quantified by mass spectrometry in Escherichia coli Nissle 1917 (EcN), a probiotic used for the treatment of multiple intestinal disorders, the concentration of 3-hydroxyoctadecaenoic acid (C18-3OH) was increased in EcN compared with other E. coli strains tested. Oral administration of C18-3OH decreased colitis induced by dextran sulfate sodium in mice. To determine whether other bacteria composing the microbiota are able to produce C18-3OH, we targeted the gut microbiota of mice with prebiotic fructooligosaccharides (FOS). The anti-inflammatory properties of FOS were associated with an increase in colonic C18-3OH concentration. Microbiota analyses revealed that the concentration of C18-3OH was correlated with an increase in the abundance in Allobaculum, Holdemanella and Parabacteroides. In culture, Holdemanella biformis produced high concentration of C18-3OH. Finally, using TR-FRET binding assay and gene expression analysis, we demonstrated that the C18-3OH is an agonist of peroxisome proliferator activated receptor gamma.
Conclusion The production of C18-3OH by bacteria could be one of the mechanisms implicated in the anti-inflammatory properties of probiotics. The production of LCFA-3OH by bacteria could be implicated in the microbiota/host interactions.
- enteric bacterial microflora
- probiotics
- lipids
- experimental colitis
- PPAR gamma
Data availability statement
All data relevant to the study are included in the article or uploaded as supplementary information.
Statistics from Altmetric.com
Significance of this study
What is already known on this subject?
Clinical use of probiotic bacteria is efficient for antibiotic-associated and Clostridium difficile-associated diarrhoea, and respiratory tract infections.
Even if effective in animal models of colitis, probiotic bacterium therapies in human intestinal inflammatory diseases are inconclusive.
There is a lack of knowledge on probiotic mechanisms of action.
What are the new findings?
Two probiotic bacteria, Escherichia coli Nissle 1917 and Holdemanella biformis produce high concentration of a free long chain fatty acid hyrdoxylated on the third carbon (LCFA-3OH): C18-3OH.
Oral treatment with C18-3OH decreases dextran sulfate sodium-induced colitis in mouse.
C18-3OH is an agonist of the peroxisome proliferator activated receptor gamma.
How might it impact on clinical practice in the foreseeable future?
Bacterial LCFA-3OH could be implicated in microbiota/host interactions.
H. biformis could have a therapeutic effect in inflammatory bowel diseases (IBD).
Prebiotic fructooligosaccharides associated with the H. biformis and/or E. coli Nissle 1917 could be a novel therapeutic approach in IBD.
Introduction
A recent review of existing meta-analyses on clinical use of probiotics revealed that evidence-based effects of probiotics are only related to antibiotic-associated and Clostridium difficile-associated diarrhoea, and respiratory tract infections.1 Regarding other fields, including intestinal inflammation, meta-analyses lack to define type and biological effects of probiotic strains. This discrepancy could be due to the probiotic bacterial strains used and the poor knowledge of their mechanisms of action. Comprehension of the mechanism of probiotic effects on the mammalian host is therefore of great necessity. Among probiotics, we focused on Escherichia coli Nissle 1917 (EcN), a gram-negative strain (serotype O6: K5: H1) used as a probiotic in the treatment of diarrhoea, irritable bowel syndrome and inflammatory bowel diseases (IBDs).2–4 However, its probiotic effects are contrasted even in preclinical models. Oral administration of EcN decreases intestinal inflammation in chronic colitis induced by the transfer of CD4+CD62L+ T lymphocytes in severe combined immune-deficient mice.5 In acute mouse models of colitis induced by the addition of dextran sulfate sodium (DSS) into the drinking water, the effect of EcN depends on the percentage of DSS used. In a 2% DSS model, EcN administration had no effect on the mucosal inflammation.5 In contrast, for a dose of 3.5% DSS, EcN promotes recovery from DSS-induced intestinal injury associated with a decrease in pro-inflammatory molecules and an increase in mucins and tight junction proteins mRNA expression.6 These few examples of the impact of EcN on colitis highlight the lack of current knowledge on the mechanisms underlying EcN probiotic activity. In vitro, few studies focused on the mechanism by which EcN decreases paracellular permeability and demonstrated that this bacterium increases tight junction proteins, Zonula occludens (ZO)-1 and ZO-2, expression in epithelial cells and decreases the production of CXCL8.7 8 In a previous study, we identified the EcN-derived lipopeptide C12AsnGABAOH as a mediator able to alleviate visceral hypersensitivity without affecting paracellular permeability.9
The aim of this study was to decipher the anti-inflammatory mechanism of EcN and to investigate whether it may be extended to other bacteria. Here, we show that a bacterial long chain fatty acid (LCFA) hydroxylated on the third carbon, C18-3OH, reduces colitis in mice by activating peroxisome proliferator activated receptor gamma (PPARγ) into epithelial cells.
Methods
Animals
C57BL/6J mice aged 6–10 weeks (Janvier, Saint Quentin Fallavier, France) were used. Mice were raised in sanitary conditions without pathogens with free access to water and food and submitted to alternating cycles of 12 hours of light and darkness. Study design is developed in online supplemental material.
Supplemental material
Identification of hydroxylated LCFA
The characterisation of hydroxylated LCFAs was performed on a high-performance liquid (U3000, Thermo Fisher Scientific, Waltham, Massachusetts, USA) coupled on line to a Fourier transform mass spectrometer (QExactive+high-resolution mass spectrometer, Thermo Fisher Scientific, Bremen, Germany) following bacterial lipid extraction (online supplemental method).
Results
Quantification of hydroxylated fatty acids produced by EcN
Based on the mass resolution of the mass spectrometer allowing the accurate m/z measurements and the analysis of product ion spectra, we identified several LCFA hydroxylated on the third carbon with Cn=C10, C12, C12:1, C14, C14:1, C16 or C16:1 (see online supplemental results and online supplemental figure 1). As the maximal length of fatty acid in E. coli is Cn=C18,10 a quantitative method was developed on a low-resolution triple quadrupole mass spectrometer coupled online to a liquid chromatography to simultaneously quantify LCFA, from 8 to 18 carbons, hydroxylated on the third carbon (LCFA-3OH). In addition, linoleic acid metabolites and alpha-linolenic acid metabolites have been added to our quantitative method. All LCFA-3OH were quantifiable and C14-3OH was the most abundant (figure 1A). Low concentrations of linoleic acid metabolites: trihydroxyoctadecanoic acids (10-TriHOME and 12-TriHOME), dihydroxyoctadecanoic acids (9,10-DiHOME and 12,13-DiHOME) and hydroxyoctadecadienoic acids (9-HODE and 13-HODE), were quantified in EcN pellets (figure 1B). In contrast, 9-octadecadienoic and 13-octadecadienoic acids (9-oxoODE and 13-oxoODE) and alpha-linolenic acid metabolites, 9-hydroxyoctadecatrienoic and 13-hydroxyoctadecatrienoic acids were not detectable in bacterial pellets. The same lipids were quantified in the EcN culture medium (online supplemental figure 2).
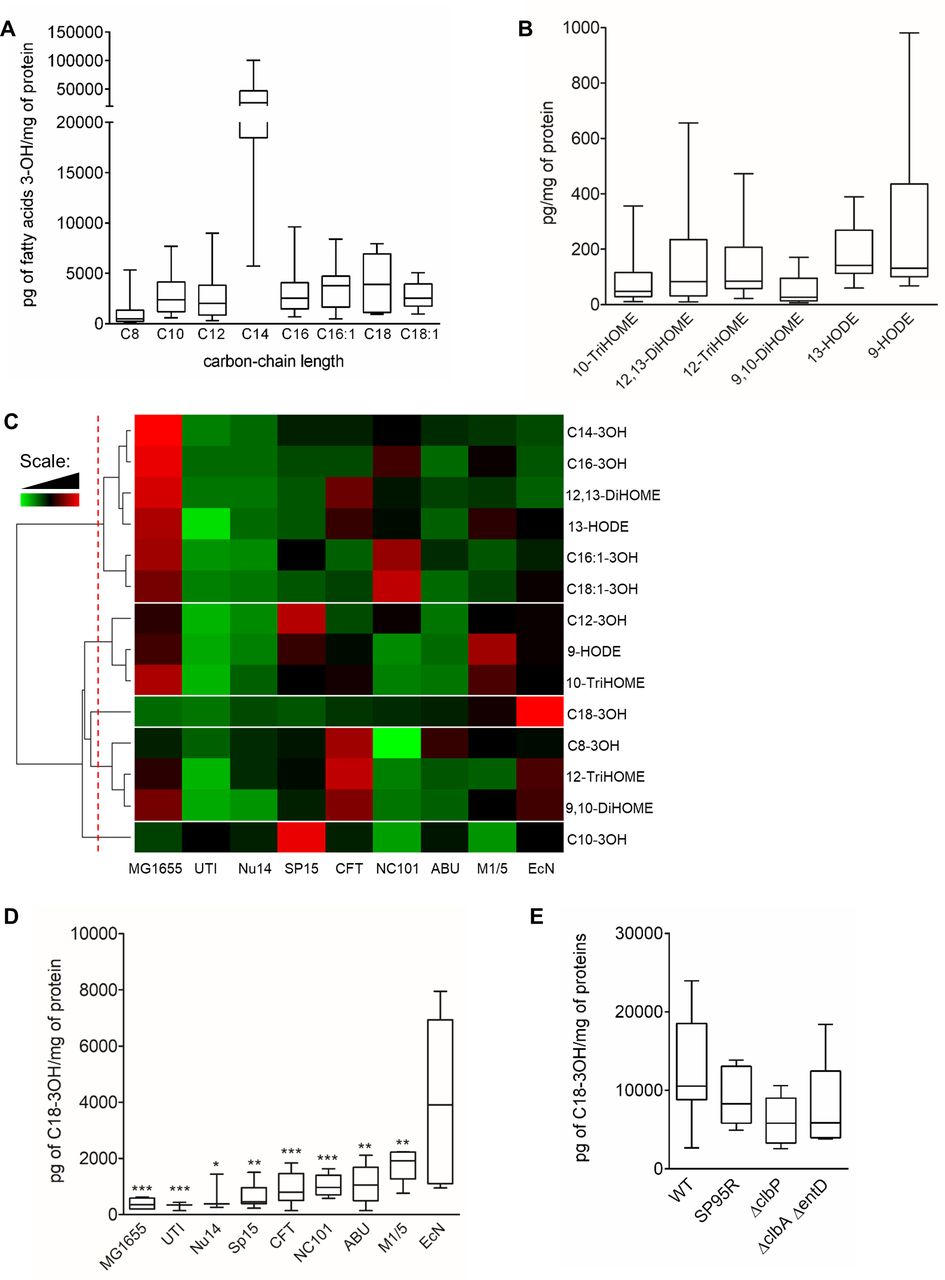
Quantification of hydroxylated long chain fatty acids by LC-QQQ in bacterial pellets. Quantification of long chain fatty acid (LCFA) hydroxylated on the third carbon (A) and of metabolites from linoleic acid (C18:2n-6) (B) in Escherichia coli Nissle 1917 (EcN). Data are represented as whiskers plot (min to max, centred value at median). N=5–10 experiments of three independent bacterial cultures per group. (C) Heat map of hydroxylated LCFA quantified by LC-QQQ. Data are shown in a matrix format: each row represents a single lipid, and each column represents a strain of E. coli. Each colour patch represents the normalised quantity of LCFA (row) in a strain of E. coli (column), with a continuum of quantity from bright green (lowest) to bright red (highest). The pattern and length of the branches in the dendrograms reflect the relatedness of the polyunsaturated fatty acid (PUFA) metabolites. The dashed red line is the dendrogram distance used to cluster PUFA metabolites. (D) Quantification of C18-3OH in the different strain of bacteria. Data are represented as whiskers plot (min to max, centred value at median). N=5–10 experiments of three independent bacterial cultures per group. (E) Quantification of C18-3OH in EcN clbP-S95R (S95R), EcN ΔclbP (ΔclbP), EcN ΔclbA ΔentD (ΔClbA ΔentD) and wild type (WT) bacteria. Data are represented as whiskers plot (min to max, centred value at median). N=2 experiments of five independent bacterial cultures per group. Statistical analysis was performed using Kruskal-Wallis and subsequent Dunn’s post hoc test. *p<0.05, **p<0.01, ***p<0.001, significantly different from EcN.
LCFA metabolites were quantified in one strain of E. coli from phylogenetic group A (MG1655)11 and eight strains from phylogenetic group B2 including five pathogens (NC101, NU14, UTI, CFT, SP15),12–16 one asymptomatic (ABU),17 one commensal (M1/5)18 and one probiotic (EcN).19 Hierarchical clustering of LCFA amounts quantified in bacterial pellets (pg/mg of proteins) was used to reveal the main differences between them (figure 1C). LCFA formed five different clusters. The first cluster was constituted by LCFA with a concentration increased in MG1655 and NC101 compared with the other strains (figure 1C). Of note, C14-3OH and 12,13-DiHOME were significantly increased in MG1655; C16-3OH and C16:1-3OH in MG1655 and NC101 and C18:1-3OH in NC101 compared with EcN (online supplemental figures 3 and 4). The second cluster discriminated LCFA which were highly produced in MG1655, SP15 and M1/5 (figure 1C). Only C12-3OH was significantly increased in SP15 compared with EcN (online supplemental figure 3). C18-3OH delineated the third cluster and was significantly increased only in EcN compared with other strains of E. coli (figure 1C,D). The fourth cluster was composed of LCFA expressed preferentially in CFT but with no significant difference in their concentration (figure 1C and online supplemental figures 3 and 4). The C10-3OH forming the fifth cluster was significantly increased in SP15 compared with EcN (figure 1C and online supplemental figure 3). Thus, among all LCFA quantified in E. coli, C18-3OH was the only one to be significantly upregulated in EcN compared with the other strains (figure 1D), warranting further investigation. Deletion or mutation of genes composing the pks island have no effect on C18-3OH synthesis (figure 1E).
C18-3OH decreases DSS-induced colitis
As EcN decreased inflammation in DSS-induced colitis model in rats19 and mice,6 we assessed the ability of C18-3OH to modulate DSS-induced colitis. Oral administration of C18-3OH in DSS mice did not change the body weight compared with DSS mice gavaged with the vehicle (figure 2A). Despite the absence of any effect on weight loss, C18-3OH significantly decreased macroscopic scores (figure 2B), colon thickness (figure 2C), microscopic scores (figure 2D) and increased colon length (figure 2E) in DSS mice. C18-3OH also decreased paracellular permeability in DSS-induced colitis in mice (figure 2F). Thus, oral administration of C18-3OH decreased the severity of the colitis induced by the DSS. Polyunsaturated fatty acid (PUFA) metabolites were then quantified in the colonic tissue of the mice using liquid chromatography/tandem mass spectrometry (LC-MS/MS). Resolvin E1 (RvE1), 11beta-prostaglandin F2α (11β-PGF2α), RvD3, lipoxin B4 (LxB4), RvD2, RvD1, leukotriene B5 (LTB5), maresin 1 (7MaR1), 5,6-dihydroxyeicosatetraenoic acid (5,6-DiHETE), 15dPGJ2 and 11,12-epoxyeicosatrienoic acid (11,12-EET) were not quantifiable in our samples. Hierarchical clustering of PUFA metabolite amounts quantified in biopsies (pg/mg of protein) was used to reveal the main differences between untreated and DSS-treated mice administered with PBS or C18-3OH (figure 2G). PUFA metabolites formed three different clusters. The first cluster contained products derived from n-6 PUFA known for their pro-inflammatory properties (PGE2, thromboxane B2 (TXB2), LtB4, PGF2α and 6kPGF1α). The concentrations of these metabolites composing the first cluster was higher in DSS mice administered with vehicle (figure 2G). PGE2, 6kPGF1a, TxB2, 8-HETE, LtB4 and 8-isoPGA2 that were significantly increased in DSS mice were decreased by the treatment with C18-3OH (online supplemental figure 5). No statistical differences between groups were observed for all the other metabolites composing this cluster. The second cluster, composed mainly by n-3 PUFA metabolites, discriminated concentration of metabolites increased in both DSS and C18-3OH/DSS mice (figure 2G). The six metabolites composing this cluster were significantly increased in DSS mice compared with control mice (online supplemental figure 5). Among these, 12-hydroxyeicosatetraenoic acid (12-HETE), protectin Dx (PDx) and PGD2 were significantly decreased by treating mice with C18-3OH (online supplemental figure 5). The concentrations of EET (5,6-EET, 8,9-EET and 14,15-EET), LxA4, 5-oxo-eicosatetraenoic acid (5-oxoETE) and 18-hydroxyeicosapentaenoic acid (18-HEPE), delineating the third cluster, were decreased following C18-3OH treatment in both control and DSS mice (figure 2G). EET concentrations were significantly decreased in C18-3OH and C18-3OH/DSS mice compared with control and DSS mice (online supplemental figure 5). Thus, the quantification of PUFA metabolites were in line with the anti-inflammatory properties of C18-3OH. Further, we observed that DSS mice showed increased expression of the genes encoding the trefoil factor 3 (Tff3) a stabiliser of the mucus layer and the antimicrobial peptide regenerating islet-derived protein 3 gamma (Reg3γ) (figure 2H). In contrast, expression of the genes encoding for the mucin 2 (Muc2) and the tight-junction proteins occludin and zonula occludens 1 (Tjp1) were decreased (figure 2H). Expression of the genes Reg3γ and Tjp1 was normalised by C18-3OH treatment (figure 2H). DSS-induced colitis was also associated with an increase in mRNA levels of both cytokines (Tnfα, Tgfβ, Il1β and Il6) and chemokines (Ccl5, Cxcl1 and Cxcl2). As shown in figure 2H, the administration of C18-3OH in DSS colitis mice resulted in a significant inhibition of the chemokines Cxcl1 and Cxcl2. Expression of Nfκb was unchanged (figure 2H). Taken together, our results showed that C18-3OH exhibits an anti-inflammatory activity in colitis mice.
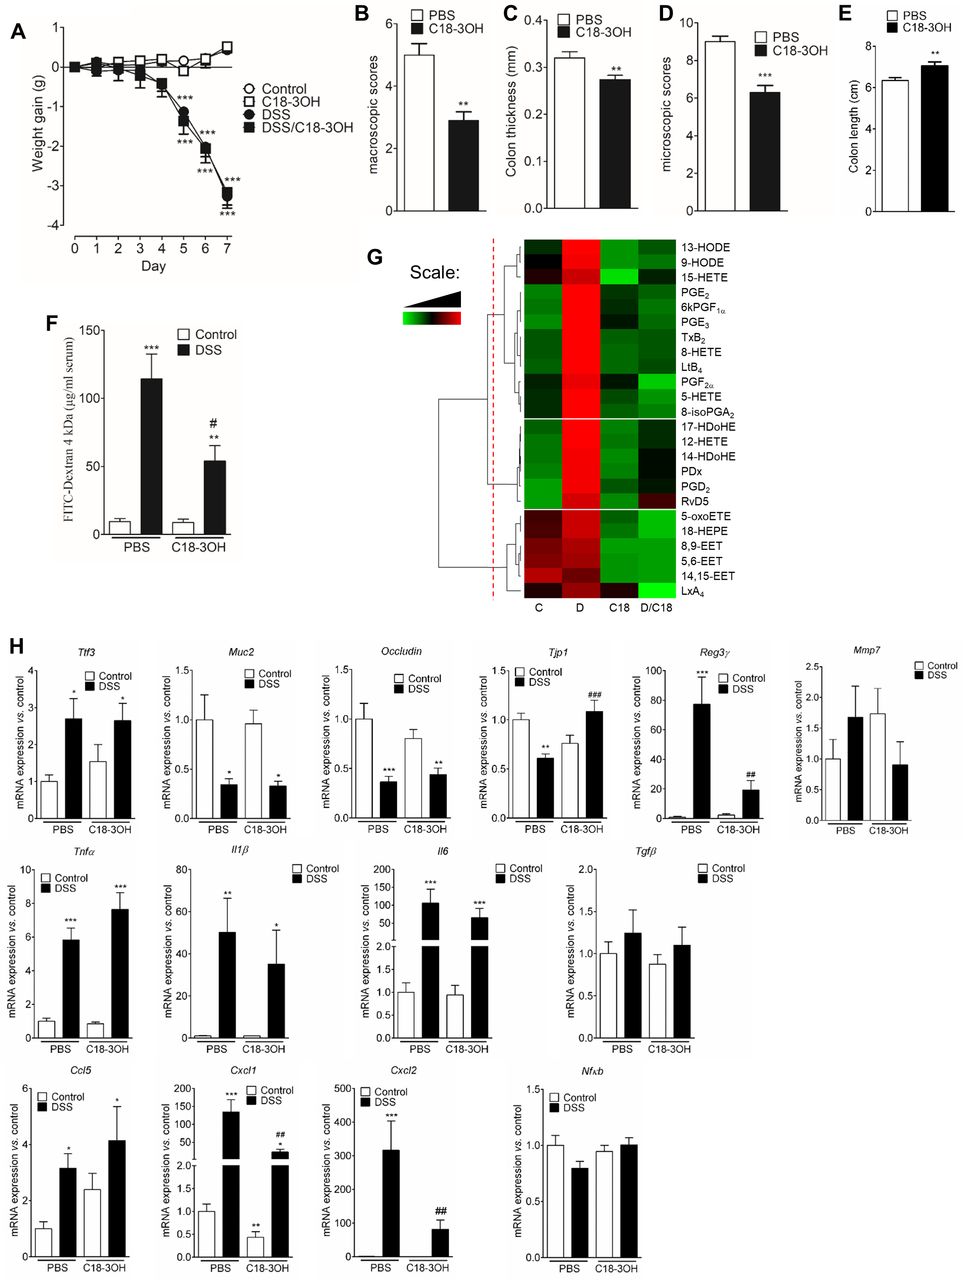
Oral administration of C18-3OH reduces dextran sulfate sodium (DSS)-induced colitis. acute colitis was induced by adding 3% DSS into the drinking water for 7 days. Mice were gavaged every day for 9 days (2 days before and the 7 days during DSS treatment) with 100 µM of C18-3OH solubilised in 100 µL of PBS/ethanol 3% or with the vehicle (PBS/ethanol 3%). (A) Weight gain was observed in DSS-treated (black symbols) or control mice (white symbols) treated with C18-3OH (square) or its vehicle (PBS, circle). Data are expressed as mean±SEM. Statistical analysis was performed using repeated-measures two-way ANOVA and a Bonferroni’s multiple comparisons post hoc tests. ***p<0.001 significantly different from control group. Colitis severity was assessed by macroscopic damage scores (B), colon thickness (C), microscopic damage scores (D) and colon length (E) in 3% DSS mice gavaged with C18-3OH (black bars) or vehicle (PBS, white bars). Data are expressed as mean±SEM. Statistical analysis was performed using Mann-Whitney test. **p<0.01, ***p<0.001 significantly different from PBS group. (F) In order to determine intestinal paracellular permeability, 4 hours after oral administration of FITC dextran 4 kDa, FITC fluorescence was quantified in the serum of mice treated with the DSS (black bars) or their control (white bars) and treated with C18-3OH (right bars) or its vehicle (PBS, left bars). Data are expressed as mean±SEM. Statistical analysis was performed using Kruskal-Wallis and subsequent Dunn’s post hoc test. **p<0.01, ***p<0.001, significantly different from control/PBS group and # p<0.05, significantly different from DSS/PBS group. (G) Heat map of polyunsaturated fatty acid (PUFA) metabolites quantified by LC-MS/MS. Data are shown in a matrix format: each row represents a single PUFA metabolite, and each column represents a group of mice: C, control; D, DSS; C18, C18-3OH and D/C18, C18-3OH/DSS. each colour patch represents the normalised quantity of PUFA metabolites (row) in a group of mice (column), with a continuum of quantity from bright green (lowest) to bright red (highest). The pattern and length of the branches in the dendrogram reflect the relatedness of the PUFA metabolites. The dashed red line is the dendrogram distance used to cluster PUFA metabolites. (H) mRNA of several genes were quantified in colon of mice treated with the DSS (black bars) or their control (white bars) and treated with C18-3OH (right bars) or its vehicle (PBS, left bars) by quantitative real-time PCR. mRNA content was normalised to HPRT mRNA and quantified relative to the control/PBS group. Data are expressed as mean±SEM. Statistical analysis was performed using Kruskal-Wallis and subsequent Dunn’s post hoc test. *p<0.05, **p<0.01, ***p<0.001, significantly different from control/PBS group and ## p<0.01, ### p<0.001 significantly different from DSS/PBS group.
Inhibition of DSS-induced colitis by using prebiotics is associated with an increase in C18-3OH and three correlating bacterial genera
In order to determine if other intestinal bacteria are able to produce LCFA-3OH, mice were treated with prebiotics (ie, fructooligosaccharides (FOS) which are non-digestible carbohydrates hydrolysed only by intestinal microbiota mainly in the ascending colon.20 As previously observed for C18-3OH, FOS has no effect on weight loss (online supplemental figure 6A) but decreased both inflammatory parameters (online supplemental figure 6B–E) and paracellular permeability in colitis mice (online supplemental figure 6F). Quantification of LCFA-3OH revealed a significant increase in C18-3OH in FOS/DSS group compared with control or DSS group (figure 3A). Among all other lipid tested, only C16-3OH showed an increased concentration in DSS/FOS groups as compared with control (online supplemental figure 7A) but its concentration was similarly increased in DSS group compared with control. Hence, C16-3OH could unlikely account for the anti-inflammatory effect of FOS diet. Thus, the anti-inflammatory effects of FOS were associated only with the increase in C18-3OH DSS mice. Hierarchical clustering of the PUFA metabolites revealed four clusters (figure 3B). Interestingly, the composition of the different clusters was comparable to the clusters obtain in the C18-3OH experiments, except one new cluster (cluster 2, figure 3B). This cluster was composed by RvD5 and PDx, two pro-resolving bioactive lipids,21 significantly increased in the DSS/FOS group compared with control (online supplemental figure 5) suggesting that they could participate to the anti-inflammatory properties of the prebiotic treatment. Treatment with FOS of DSS-induced colitis mice decreased the concentration in pro-inflammatory prostaglandins (PGE2, PGD2 and PGF2α), LtB4 and TxB2 (online supplemental figure 7) as observed with the treatment with the C18-3OH (online supplemental figure 5). In agreement with a role of C18-3OH in the effects of FOS, the concentrations of EET were decreased in DSS/FOS group compared with control and DSS group (online supplemental figure 7D) as shown for C18-3OH (online supplemental figures 5C and 7D). Regulation of gene expression in mice treated with FOS also uncovered similarities with the C18-3OH/DSS mice. Indeed, FOS decreased Reg3g, Tjp1, Cxcl1 and Il1β gene expression in DSS-induced colitis (online supplemental figure 8). In order to identify bacteria potentially implicated in the increased concentration of C18-3OH, we performed a microbiota analysis. Hierarchical clustering of the % of the genus revealed six clusters (figure 3C). The first cluster was constituted by genus with an abundance increased in FOS/DSS mice (figure 3C). Abundances in Akkermansia, Holdemanella, Allobaculum, Parabacteroides, Intestinimonas, Blautia and Christensenella were significantly increased in FOS/DSS group compared with control (online supplemental figure 9A). Abundances in Akkermansia, Holdemanella, Allobaculum and Parabacteroides were also significantly increased in FOS/DSS group compared with DSS group (online supplemental figure 9A). The second cluster discriminated abundances in genera decreased in DSS group. In contrast, abundance in genera of bacteria composing the third cluster was increased in DSS group (figure 3C). Abundances in Odoribacter, Escherichia, Turicibacter and Coprococcus were significantly increased in DSS group compared with control group (online supplemental figure 9B) and abundances in Turicibacter and Coprococcus were significantly decreased in the FOS/DSS group compared with DSS group (online supplemental figure 9B). The fourth cluster was composed by abundances in genera decreased in FOS/DSS, the fifth by abundances increased in control and the sixth by abundances increased in FOS group (figure 3C). Significant differences were observed for the abundance in Barnesiella, Alistipes, Lactobacillus, Desulfovibrio, Butyrivibrio, Nubsella and Pedobacter between DSS group and control for the cluster 5 and, in Kopriimonas and Bifidobacterium between FOS group and control for the cluster 6 (online supplemental figure 9C,D). Only the abundances in Akkermansia, Holdemanella, Allobaculum and Parabacteroides were increased in the FOS/DSS group compared with control and DSS mice (figure 3C and online supplemental figure 9A) as observed for the concentration of C18-3OH (figure 3A). In order to determine which genus of bacteria could be implicated in the production of C18-3OH, we studied the correlation between the abundance in these four genera and the concentration of C18-3OH. The concentration of C18-3OH was correlated with the abundance in Holdemanella, Allobaculum and Parabacteroides but not Akkermansia (figure 3D). We cultured Holdemanella biformis to quantify LCFA-3OH in bacterial pellets and supernatants. All LCFA-3OH, except C16:1-3OH, were quantifiable in H. biformis and in its supernatant (online supplemental figure 10). The concentration of C18-3OH in H. biformis was higher than in EcN (figure 3E). Thus, a bacterium of the genus Holdemanella might be implicated in the increased of C18-3OH concentration observed in FOS/DSS mice.

Fructooligosaccharides (FOS) diet increases C18-3OH concentration in colitis and gut microbiota analysis. Acute colitis was induced by adding 3% dextran sulfate sodium (DSS) into the drinking water for 7 days. FOS (10%) was added to the drinking water for 10 days (3 days before and the 7 days during DSS treatment). (A) Quantification of C18-3OH in colon of mice treated with the DSS (black symbols) or their control (white symbols) and treated with FOS (right) or not (left). Data are expressed as mean±SEM. Statistical analysis was performed using Kruskal-Wallis and subsequent Dunn’s post hoc test. *p<0.05, ***p<0.001, significantly different from control/water group and #p<0.05, significantly different from DSS/water group. (B) Heat map of polyunsaturated fatty acid (PUFA) metabolites quantified by LC-MS/MS. Data are shown in a matrix format: each row represents a single PUFA metabolite, and each column represents a group of mice: C, control; D, DSS, F, FOS and F/D, FOS/DSS. Each colour patch represents the normalised quantity of PUFA metabolites (row) in a group of mice (column), with a continuum of quantity from bright green (lowest) to bright red (highest). The pattern and length of the branches in the dendrogram reflect the relatedness of the PUFA metabolites. The dashed red line is the dendrogram distance used to cluster PUFA metabolites. (C) Heat map of % of abundance in genus determinate by Illumina sequencing method. Data are shown in a matrix format: each row represents a single genus, and each column represents a group of mice: C, control; D, DSS, F, Fos and F/D, FOS/DSS. Each colour patch represents the normalised quantity of PUFA metabolites (row) in a group of mice (column), with a continuum of quantity from bright green (lowest) to bright red (highest). The pattern and length of the branches in the dendrogram reflect the relatedness of the PUFA metabolites. The dashed red line is the dendrogram distance used to cluster PUFA metabolites. (D) Correlation between the concentration of C18-3OH in the colonic tissue and % of abundance in Akkermansia, Holdemanella, Allobaculum and Parabacteroides. C18-3OH and % of abundance were determined for each mouse (black circle). Coefficient of correlation (r) between the % of abundance and the concentration of C18-3OH in the colonic tissue of mice was calculated. Data are represented as aligned dot plot with mean and errors linear regression lines. The significance of each correlation is indicated on each graphic by the p value. (E) Quantification of long chain fatty acid hydroxylated on the third carbon in bacterial pellets and culture medium of Escherichia coli Nissle 1917 (EcN) and Holdemanella biformis. Data are expressed as mean±SEM. Statistical analysis was performed using Mann-Whitney test. *p<0.05, **p<0.01, significantly different from EcN group.
C18-3OH enters into epithelial cells where it binds to and activates PPARγ
In order to study the mechanism by which C18-3OH decreased colitis, we investigated whether this molecule was able to cross the intestinal epithelial barrier (IEB). In a first set of experiments, confluent human intestinal epithelial cells (caco2) differentiated in Transwell chambers were treated at the apical side by C18-3OH at different concentrations (0 µM, 1 µM, 10 µM and 100 µM) (online supplemental method). C18-3OH concentration was significantly increased in cells 24 hours after treatment with 10 µM or 100 µM of C18-3OH (figure 4A). Further kinetics experiments showed that the accumulation of C18-3OH was optimal within 6 hours (figure 4B). For all the experimental conditions tested, C18-3OH was never recovered in the basolateral compartment (figure 4A,B). In agreement, treatment with C18-3OH did not modify the paracellular permeability of the caco2 cell monolayer (online supplemental figure 11). These findings suggest that C18-3OH enters intestinal cells but does not seem to be able to cross the intestinal barrier. In a second set of experiments, we evaluated the passage of C18-3OH through the intestinal epithelium using Ussing chambers where a luminal compartment and a serosal compartment are delineated by biopsies from the colon, the ileum or Peyer patches ex vivo (online supplemental method). One hour after addition of C18-3OH (1 µM and 100 µM) in the luminal compartment, its concentration was increased in the colonic tissue (figure 4C), ileum or Peyer patches tissues (online supplemental figure 11B,C) but remained at low levels in the serosal compartment (figure 4C, online supplemental figure 11B,C). The paracellular permeability was not modified by C18-3OH (1 µM and 100 µM) treatment in either of the tissue samples (online supplemental figure 11D). Finally, the passage of C18-3OH was assessed in vivo (online supplemental method). Mice were orally administered with 100 µM C18-3OH daily for 7 days. Blood, colon, ileum and Peyer patches were then collected to quantify C18-3OH by LC-MS/MS 30 min, 2 hours and 4 hours after the last gavage. C18-3OH concentration was only increased in the colonic tissue 2 hours after the last gavage (figure 4D). No change in C18-3OH concentration was observed in all the other organs whatever the time point (figure 4D, online supplemental figure 12). Thus, as assessed in vitro, ex vivo and in vivo, C18-3OH does not cross the IEB.

C18-3OH does not cross the epithelial barrier and penetrates the epithelial cells. Caco2 cells were cultivated into Transwell chambers. After 24 hours treatment with C18-3OH (0 µM white bar, 1 µM light grey bar, 10 µM dark grey bar or 100 µM black bar) at the apical side (A) or 0.5, 2, 6, 12 and 24 hours after C18-3OH treatment (100 µM, (B), C18-3OH was quantified inside the cells and at both the apical and basolateral compartments by LC-MS/MS. n=5 experiments of three wells per condition. (C) One hour after treatment with C18-3OH (0 µM white bar, 1 µM grey bar or 100 µM black bar) at the luminal side of a colonic biopsy mounted in Ussing chamber, C18-3OH was quantified in the luminal and serosal compartment and in the tissue. n=12–15 experiments. (D) Mice were orally treated with C18-3OH (0 µM white bar or 100 µM black bar) every day during 7 days and C18-3OH was quantified 30 min, 2 hours and 4 hours after the last gavage in the colonic tissue. Data are represented as mean±SEM. Statistical analysis was performed using Kruskal-Wallis and subsequent Dunn’s post hoc test. *p<0.05, **p<0.01, ***p<0.001, significantly different from 0 µM of C18-3OH condition.
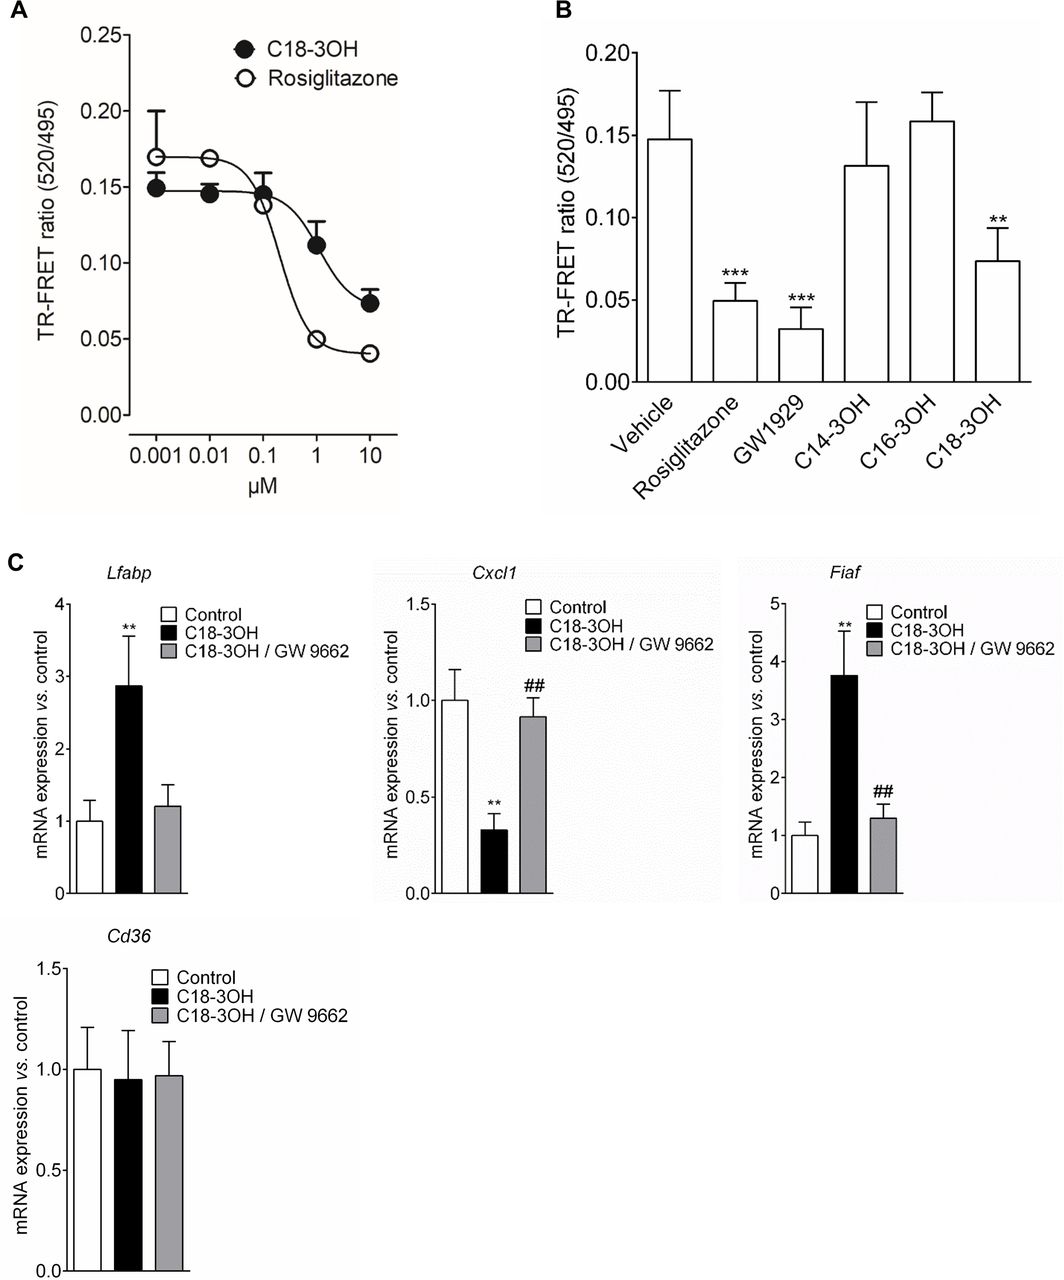
As C18-3OH enters epithelial cells, we hypothesised that it could interact with intracellular receptor such as the PPARγ. To study the ability of C18-3OH to bind PPARγ, we performed a competitive TR-FRET ligand-binding assay. C18-3OH directly bound to purified human PPARγ LBD with an IC50 of 1.11 µM, which was weaker than that of rosiglitazone used as a positive control (IC50=0.22 µM) (figure 5A). C18-3OH (10 µM) significantly decreased the TR-FRET ratio, along with the two known PPARγ agonists Rosiglitazone (10 µM) and GW1929 (1 µM) (figure 5B). In contrast, C14-3OH (10 µM) and C16-3OH (10 µM) were not able to bind to PPARγ (figure 5B). These findings showed that C18-3OH is able to specifically bind PPARγ. Then, we investigated whether the binding of PPARγ by C18-3OH regulated the expression of known PPARγ target genes. Mouse gavage by C18-3OH increased expression of the Lfabp and Fiaf genes, decreased that of Cxcl1 and showed no effect on Cd36 (figure 5C). Furthermore, treatment of mice by a specific PPARγ antagonist, GW9662, abrogated C18-3OH effects on gene expression (figure 5C). In conclusion, our findings indicate that C18-3OH is an activating ligand of PPARγ, and strongly suggest that activated PPARγ has a key role in the anti-inflammatory effect of C18-3OH.

C18-3OH and peroxisome proliferator-activated receptor gamma interactions. (A) The binding affinity of 0.001, 0.01, 0.1, 1 and 10 µM of C18-3OH or rosiglitazone for peroxisome proliferator activated receptor gamma (PPARγ) was determined by the competitive binding assay. Data are expressed as mean±SEM. n=5 independent experiments. (B) The binding affinity of C14-3OH (10 µM), C16-3OH (10 µM), C18-3OH (10 µM), rosiglitazone (10 µM), GW1929 (1 µM) or their vehicle (dimethyl sulfoxide (DMSO) 2%) was determined by the competitive binding assay. Data are expressed as mean±SEM. n=3–5 independent experiments. Statistical analysis was performed using Kruskal-Wallis and subsequent Dunn’s post hoc test. **p<0.01, ***p<0.001, significantly different from vehicle. (C) mRNA of Lfabp, Cxcl1 and Fiaf were quantified in colon of mice gavaged during 7 days with C18-3OH (100 µM/ 100 µL; black and grey bars) or its vehicle (control, white bars) and treated by intraperitoneal injection of GW9662 (1 mg/kg, grey bar) or its vehicle (black bar) by quantitative real-time PCR. mRNA content was normalised to hypoxanthine-guanine phosphoribosyltransferase (HPRT) mRNA and quantified relative to the control group. Data are expressed as mean±SEM. Statistical analysis was performed using Kruskal-Wallis and subsequent Dunn’s post hoc test. **p<0.01, significantly different from control group and ## p<0.01, significantly different from C18-3OH group.
Discussion
The administration of EcN in conjunction with standard therapy to ulcerative colitis (UC) patients did not increase the remission induction rate while the treatment with this probiotic could have a similar effect to mesalazine in maintaining remission.22 Since 2011, the use of EcN is recommended for the maintenance of remission in human UC.23 Anti-inflammatory mechanisms of EcN are mainly associated with its ability to interfere with different cell pathways like NF-κB or to modulate the activity of the MAPKs.24 25 In this study, we showed that the production of C18-3OH by E. coli is enhanced in EcN compared with pathogenic, asymptomatic and commensal E. coli, making it a potential component of the anti-inflammatory effect. In order to study the potential anti-inflammatory effect of C18-3OH, we assessed the effect of C18-3OH pretreatment in DSS-induced colitis and established that this lipid decreased colitis. In order to assess if the pks island harboured by EcN could be implicated in the production of C18-3OH, we quantified it in EcN deleted for the peptidase encoded by clbP (EcN ΔclbP) or with a mutation on the catalytic site of the peptidase (EcN clbP-S95R) and in EcN unable to produce enterobactin, salmochelin, yersiniabactin and colibactin (EcN ΔclbA ΔentD). These different mutations known to impair EcN probiotic activity26 did not change the production of C18-3OH compared with wild-type bacteria meaning that the pks island is not implicated in C18-3OH synthesis. In E. coli, LCFA are generated by synthases, dehydratases and a reductase and are incorporated into the cell membrane27 or secreted in the medium as shown in our study. The mechanism implicated in the secretion of this LCFA-3OH still needs to be studied.
Similarly to the probiotic approach, the use of FOS as a prebiotic has previously been shown to have anti-inflammatory effects in rodent models of colitis,28–30 and to improve the gut barrier function.28 31 These effects have been correlated to changes in microbial community and microbial metabolites induced by FOS.20 31 Among these bacterial metabolites, we assessed the impact of FOS diet on C18-3OH production. We demonstrated that the oral administration of FOS in DSS mice induced a reduction of colitis associated with an improvement of gut permeability. Furthermore, it was accompanied by an increased C18-3OH production in the colonic tissue and a change in microbial taxonomy. In particular, we showed an increased abundance of Akkermansia, Holdemanella, Allobaculum and Parabacteroides genera in the caecum of DSS mice treated with FOS. In a previous study, we demonstrated that FOS feeding specifically increases the abundance of three of these genera (ie, Akkermansia, Allobaculum and Parabacteroides), decreases inflammatory tone and reinforces the gut barrier function on diet-induced obesity and diabetes.32 In the current study, the abundance of Holdemanella, Allobaculum and Parabacteroides was positively correlated with the production of C18-3OH in the colon. Among this three genera, Holdemanella was the most abundant and H. biformis, previously misclassified as Eubacterium biforme,33 is the only strain described in this genus. This bacterium, present in human faeces,34 35 contains high concentrations of fatty acids with 18 carbons compared with their closer phylogenetic neighbours of the family Erysipelotrichaceae.33 Interestingly, H. biformis was able to produce C18-3OH in larger quantities than EcN, suggesting that H. biformis might be more effective regarding C18-3OH-mediated anti-inflammatory activity.
We then investigated, the mechanism involved in the anti-inflammatory effect of C18-3OH. A number of preclinical mouse models of inflammation including DSS-induced colitis reported that inflammatory parameters (eg, Cxcl1 and Reg3γ) were reduced following treatment with a LCFA of 18 carbons as well as a PPARγ agonist in vivo.36–38 As C18-3OH enters epithelial cells, we hypothesised that it could interact with the PPARγ, which is an intracellular receptor strongly expressed in the colon39 and that may potentially bind hydroxylated LCFA of 18 carbons.40 In line with our hypothesis, C18-3OH treatment and FOS diet during colitis (figures 2 and 3 and online supplemental figures 5,7) reduced the concentrations of EET issued from the metabolism of arachidonic acid by cytochrome epoxygenases41 which are decreased in adipocytes overexpressing PPARγ or following treatment of primary culture of hepatocytes by PPARγ agonists.42–45 Moreover, the significant increase in abundance of Escherichia observed in inflammatory condition was not present in the FOS/DSS group (figure 3C and online supplemental figure 9) as shown in a recent study which demonstrates that increasing PPARγ activity in the gut modulates microbiota by decreasing Enterobacteriaceae46 (eg, pathogenic E. coli) in colitis. TR-FRET experiments showed that the C18-3OH is a PPARγ ligand. Gavage of naïve mice with C18-3OH recapitulated the consequences of pharmacological or physiological activation of PPARγ in epithelial cells or colonic tissue as reported elsewhere.37 38 47 However, whether the activation of PPARγ signalling in the intestinal epithelial cells is the driving mechanism needs to be studied further.
C18-3OH administration could be a treatment in IBD patients for the control of intestinal inflammation during remission periods, as shown with other PPARγ agonists such as 5-aminosalicylic acid (5-ASA).22 48 49 In addition, C18-3OH does not cross the epithelial intestinal barrier leading to a local anti-inflammatory effect, and thus, should not lead to the systemic adverse effects reported by IBD patients treated with 5-ASA, such as headache, rash or bronchitis.50 The advantage of using probiotics compared with a drug is that it could exerts its anti-inflammatory effect by different mechanisms, thus if one of the anti-inflammatory pathways is not functional, due to tissue damage, for instance, they still could have an effect on the colitis. In addition, probiotics are associated with less side effects than drugs used against inflammation. While the use of EcN in UC patients has been described, the therapeutic efficacy of H. biformis has never been investigated in preclinical or clinical studies in the treatment of colonic inflammation. Our study is the first to show that this strain could have therapeutic effects in IBD. Interestingly, both H. biformis and PPARγ, have recently been reported as having anti-tumourigenic effects in the colon, thus suggesting that perhaps the C18-3OH could have a broader probiotic role and exert beneficial effects in colorectal cancer treatment.51 Recently, a pilot trial showed that the association of a FOS prebiotic mixture with a probiotic Bifidobacterium longum resulted in improvement of the appearance of chronic inflammation in patients with active UC.52 53 The same approach using FOS coupled to EcN and/or H. biformis could be an interesting therapeutic approach in IBD regarding the anti-inflammatory effects found in our study.
Together our findings, highlights the implication of LCFA-3OH in the effects of the gut microbiota on the host. The release of LCFA-3OH and not solely of C18-3OH by bacteria, could participate to the dialogue between bacteria and their host, and potentially represent a new beneficial treatment of flares and maintaining remission in patients with IBD.
Data availability statement
All data relevant to the study are included in the article or uploaded as supplementary information.
Ethics statements
Ethics approval
All procedures were performed in accordance with the Guide for the Care and Use of Laboratory Animals of the European Council and were approved by the Animal Care and Ethics Committee of US006/CREFE (CEEA-122; application number APAFIS #7762-CE2016112509278235V2).
Acknowledgments
We gratefully acknowledge the animal care facility, Genetoul, anexplo, US006/INSERM, Toulouse, the Toulouse INSERM Metatoul-Lipidomique Core Facility-MetaboHub ANR-11-INBS-010, where lipidomic analysis were performed, and the platform Aninfimip, an EquipEx (‘Equipement d’Excellence’) supported by the French government through the Investments for the Future programme (ANR-11-EQPX-0003).
References
Footnotes
JP and CP are joint first authors.
Twitter @MicrObesity
Contributors JLFP and CP designed and conducted experiments, performed data acquisition, analysis and interpretation, and wrote the manuscript. PLF designed and conducted experiments, performed data acquisition, analysis and interpretation and drafting of the manuscript. VE, GP, SM, TP-B, MVH, FB and CB carried out experiments, performed data acquisition, analysis. SC and FVI conducted experiments and contributed with the drafting of the manuscript. JB-M and EO contributed to data analysis and interpretation and edition of the manuscript. GD participated in the manuscript writing. PDC designed experiments, performed interpretation of data, helped with manuscript drafting and supervised microbiota study. NC designed and conducted experiments, performed analysis and interpretation of data, wrote the manuscript and directed the project.
Funding NC is a recipient of the grant from ANR (ANR-18-CE14-0039-01). PDC is a senior research associate at FRS-FNRS (Fonds de la Recherche Scientifique) and recipient of grants from FNRS (WELBIO-CR-2019C-02R, 'The Excellence Of Science: EOS 30770923') and the Funds Baillet Latour (Grant for Medical Research 2015). CK is a recipient of the grant from ANR (ENDIABAC, ANR-18-CE14-0007-01).
Competing interests None declared.
Patient and public involvement Patients and/or the public were not involved in the design, or conduct, or reporting, or dissemination plans of this research.
Provenance and peer review Not commissioned; externally peer reviewed.