Article Text

Abstract
Objective The anti-α4β7 integrin antibody vedolizumab is administered at a fixed dose for the treatment of IBDs. This leads to a wide range of serum concentrations in patients and previous studies had suggested that highest exposure levels are associated with suboptimal clinical response. We aimed to determine the mechanisms underlying these non-linear exposure-efficacy characteristics of vedolizumab.
Design We characterised over 500 samples from more than 300 subjects. We studied the binding of vedolizumab to T cells and investigated the functional consequences for dynamic adhesion, transmigration, gut homing and free binding sites in vivo. Employing single-cell RNA sequencing, we characterised α4β7 integrin-expressing T cell populations ‘resistant’ to vedolizumab and validated our findings in vitro and in samples from vedolizumab-treated patients with IBD. We also correlated our findings with a post-hoc analysis of the Gemini II and III studies.
Results Regulatory T (TReg) cells exhibited a right-shifted vedolizumab binding profile compared with effector T (TEff) cells. Consistently, in a certain concentration range, the residual adhesion, transmigration, homing of and availability of functional α4β7 on TReg cells in vivo was higher than that of/on TEff cells. We identified a vedolizumab-‘resistant’ α4β7-expressing β1+PI16+ TReg cell subset with pronounced regulatory properties as the substrate for this effect. Our observations correlated with exposure-efficacy data from Gemini II and III trials.
Conclusion Completely blocking TEff cell trafficking with vedolizumab, while simultaneously permitting residual homing of powerful TReg cells in an optimal ‘therapeutic window’ based on target exposure levels might be a strategy to optimise treatment outcomes in patients with IBD.
- IBD
- adhesion molecules
- T lymphocytes
This is an open access article distributed in accordance with the Creative Commons Attribution Non Commercial (CC BY-NC 4.0) license, which permits others to distribute, remix, adapt, build upon this work non-commercially, and license their derivative works on different terms, provided the original work is properly cited, appropriate credit is given, any changes made indicated, and the use is non-commercial. See: http://creativecommons.org/licenses/by-nc/4.0/.
Statistics from Altmetric.com
Significance of this study
What is already known on this subject?
The anti-α4β7 antibody vedolizumab blocks gut homing of regulatory T (TReg) and effector T (TEff) cells and is approved for the therapy of Crohn’s disease and UC.
TReg cells counteract active inflammation in IBDs.
Fixed dosing of vedolizumab in the therapy of IBD leads to a wide range of serum drug levels observed in patients.
Phase II trials of vedolizumab suggested a non-linear dose–response correlation at high exposure levels.
What are the new findings?
Vedolizumab has a right-shifted exposure-efficacy profile regarding TReg compared with TEff cells in vitro and in vivo.
Single-cell RNA sequencing identifies a α4+β7+ TReg cell subset expressing integrin β1 and PI16 that does not bind vedolizumab.
α4β7-expressing β1+PI16+ TReg cells are ‘resistant’ to vedolizumab in patients with IBD.
Differential exposure-efficacy profiles of TReg and TEff cells correlate with outcomes in Crohn’s disease phase III trials.
How might it impact on clinical practice in foreseeable future?
Achieving optimal serum drug levels by personalised dosing strategies might increase the efficacy of vedolizumab therapy.
Introduction
IBDs with the main entities Crohn’s disease (CD) and ulcerative colitis (UC) are characterised by chronically relapsing inflammation of the gastrointestinal tract.1 The worldwide incidence and prevalence of IBDs is continuously growing,2 but the exact pathogenesis is still not fully understood. However, insights into the mechanisms driving these diseases have increased and facilitated the development of new treatment strategies.3 4 One of the newer therapeutic options is the anti-α4β7 integrin antibody vedolizumab that has been approved for the treatment of IBDs in 2014. By binding to the α4β7 integrin heterodimer expressed on the surface of several leucocyte populations, the antibody inhibits the interaction of α4β7 integrin with its ligand mucosal addressin cell adhesion molecule (MAdCAM)-1 expressed on high endothelial venules of the gut.5 In consequence, firm adhesion of α4β7-expressing cells to the endothelium and the subsequent steps of the extravasation process known as homing are blocked.6 7 It is perceived that by interfering with gut homing, vedolizumab reduces the number of immune cells recruited to the intestine and consistently attenuates inflammation. In particular, T cells are considered an important target of vedolizumab.8 9 Intriguingly, vedolizumab blocks α4β7-mediated gut homing of pro-inflammatory effector T (TEff) as well as anti-inflammatory regulatory T (TReg) cells,10 raising the question, whether the latter effect might limit the efficacy of the antibody. Yet, vedolizumab has demonstrated convincing efficacy and safety profiles in clinical trials as well as in a plethora of real world studies11–15 in recent years, but due to so far unknown reasons only a part of the patients treated with vedolizumab achieves remission.
It has been proposed that serum drug levels might be one part of the explanation for non-response to vedolizumab, since the fixed-dosing regimen leads to a wide range of serum concentrations in individual patients.11 12 Consistently, several drug-monitoring studies could demonstrate that achieving a certain minimum trough-level serum concentration of vedolizumab is a necessary (but not sufficient) prerequisite to enter remission16 and several authors described improved outcomes with increasing vedolizumab exposure over a wide concentration range.17–21 However, two independent phase II trials22 23 reported worse clinical outcomes in the highest compared with medium dosage groups suggesting a non-linear exposure-efficacy correlation in the higher range of drug levels.
Therefore, the aim of this work was to investigate the dose–response characteristics of vedolizumab on cell level. We show that higher vedolizumab concentrations are necessary to block α4β7 integrin on TReg compared with TEff cells. This functionally translates into differential adhesion, transmigration, gut homing and α4β7 availability in vivo. Mechanistically, we identify a β1+PI16+ TReg cell subset with powerful regulatory features that is ‘resistant’ to vedolizumab and enriches in the gut of successfully treated patients as the putative mediator of this effect. In a post-hoc analysis of Gemini II and III trials, the impact observed coincidences with exposure-efficacy data.
Methods
The key methods are listed in this section. Further methods are available as online supplemental file 1.
Supplemental material
Human blood samples
To determine the dose–response characteristics of vedolizumab in vitro, peripheral EDTA-anticoagulated blood was collected from healthy donors and patients with UC or CD not receiving treatment with vedolizumab. For assessment of the in vivo binding of vedolizumab, EDTA-anticoagulated full blood and serum samples from patients with IBD aged 18–75 and without relevant comorbidities undergoing vedolizumab therapy were collected. These materials were obtained at the IBD Outpatient Clinic of the Department of Medicine 1 of the University Hospital Erlangen, Germany. Characteristics of study subjects with CD, UC and control donors are summarised in online supplemental table 1. For fluorescence-activated cell sorting (FACS)-based isolation of TReg and TEff cells, leucocyte cones were obtained from the Department of Transfusion Medicine and Haemostaseology of the University Hospital Erlangen. In total, 571 samples from 358 subjects were analysed (including 59 leucocytes cones).
Supplemental material
Flow cytometry
Flow cytometry was performed according to standard protocols using the following fluorochrome-conjugated extracellular antibodies: CD3 (VioGreen, REA613, Miltenyi Biotec), CD4 (FITC/VioBlue/VioGreen/APC-Vio770, VIT4, Miltenyi Biotec), CD45RO (BV510, UCHL1, Biolegend), CD25 (PE/Cy7, BC96, Biolegend), CD127 (APC-Vio770/VioBright FITC, REA614, Miltenyi Biotec; APC, A019D5, Biolegend), CD49d (VioBlue/FITC, MZ18-24A9, Miltenyi Biotec; PE/Cy7, 9F10, Biolegend), integrin beta 7 (PerCP/Cy5.5/PE, FIB27, Biolegend; BV605, FIB504, BD BioSciences), integrin beta 1/CD29 (PE/PerCP/Cy5.5, TS2/16, Biolegend), PI16 (PE/VioBright FITC, REA699, Miltenyi Biotec), GITR (APC, 108–17, Biolegend), CD8 (PerCP/Cy5.5, RPA-T8, Biolegend), CD19 (VioBlue, Miltenyi Biotec), CD16 (APC/Cy7, 3G8, Biolegend), CD14 (AF488, HCD14, Biolegend), CD56 (PE-Vio770, REA196, Miltenyi Biotec), CCR3 (FITC, 5E8, Biolegend), Siglec 8 (PE-Dazzle594, 7C9, Biolegend). Where indicated, vedolizumab (Entyvio, Takeda) and MAdCAM-1 (rh Fc Chimera Protein, R&D Systems) were labelled using Alexa Fluor Antibody Labelling Kits (AF674/AF488, Life Technologies) according to the manufacturer’s instructions and used for staining.
For intracellular staining, the Foxp3/Transcription Factor Staining Buffer Set (eBioscience) in combination with a specific fluorochrome-conjugated antibody targeting human Foxp3 (PE/AF700/APC, 236A/E7, Invitrogen) or interleukin 10 (IL-10) (PE, JES3-19F1, Biolegend) was used.
For the quantification of free vedolizumab binding sites, human peripheral blood mononuclear cells (PBMCs) were incubated with unlabelled vedolizumab at different concentrations (0, 2, 10, 50 and 110 µg/mL) for 1 hour at 37°C, then harvested and stained as described above with fluorochrome-conjugated extracellular antibodies as well as with 50 µg/mL of fluorescently labelled vedolizumab.
Data were acquired on LSR Fortessa (BD Bioscience), MACSQuant 10 and MACSQuant 16 (Miltenyi Biotec) instruments. Data were analysed with FlowJo single-cell analysis software V.7.6.5 and V.10.06.1 (Tree Star).
Vedolizumab ELISA
Serum from patients receiving treatment with vedolizumab was analysed for vedolizumab concentrations using the Vedolizumab Drug Level ELISA (ImmunDiagnostics) according to the manufacturer’s instructions. Optical densities were determined using a NOVOstar plate reader (BMG Labtech).
Dynamic adhesion assays to MAdCAM-1
To quantify the capacity of cells to adhere to MAdCAM-1 after incubation with different concentrations of vedolizumab, FACS-isolated TReg cells were stained with CellTrace CFSE and TEff cells with CellTrace FarRed (both Invitrogen) for 15 min at 37°C. Rectangle miniature capillaries (CM Scientific) were coated with 5 µg/mL rh MAdCAM-1 Fc Chimera (R&D Systems) in coating buffer (150 mM NaCl+1 mM 4-(2-hydroxyethyl)-1-piperazineethanesulfonic acid), then blocked with 5% BSA or 10% fetal bovine serum (FBS) in phosphate buffered saline (PBS). Cells were mixed in a 1:1 ratio and treated with or without 10 or 50 µg/mL vedolizumab for 1 hour at 37°C. Next, cells were resuspended at a concentration of 1.5 Mio cells/mL in adhesion buffer (150 mM NaCl, 1 mM CaCl2, 1 mM MgCl2) with 1 mM MnCl2 and then perfused through MAdCAM-1-coated capillaries for 3 min at a speed of 10 µL/min using a peristaltic pump (Schenchen). Capillaries were rinsed for 5 min at a speed of 50 µL/min and the adherent cells in the capillaries were imaged using a confocal microscope (Leica). Data analysis and quantification was performed using Fiji (National Institutes of Health).
Single-cell RNA sequencing
Magnetic activated cell sorting-purified CD4+ T cells were stained for dead cells with fixable viability dye (FVD) efluor780 (Invitrogen) and with the following fluorochrome-conjugated extracellular antibodies: CD4 (FITC, VIT4, Miltenyi Biotec), CD45RO (BV510, UCHL1, Biolegend), CD49d (VioBlue, MZ18-24A9, Miltenyi Biotec), integrin beta 7 (PE, FIB27, Biolegend) and 10 µg/mL of AF647-labelled vedolizumab. Vedolizumab-negative (FVD−CD4+CD45RO+CD49d+β7+VDZ−) and vedolizumab-positive (FVD−CD4+CD45RO+CD49d+β7+VDZ+) memory CD4+ T cells were sorted by FACS. Purified cells were washed, counted and viability was assessed by trypan blue staining. Cells were resuspended at a concentration of 1 Mio cells/mL in PBS+2% FBS. Single-cell RNA sequencing was performed at the Next-generation Sequencing Core facility of the University of Erlangen-Nuremberg using the Chromium Platform (10× Genomics). Cells were subjected to 10× Chromium Single Cell 3′ Solution v3 library preparation according to the manufacturer’s instructions. Library sequencing was performed on an Illumina HiSeq 2500 sequencer to a depth of 200 million reads each. Reads were converted to FASTQ format using mkfastq from Cell Ranger 3.0.1 (10× Genomics). Reads were then aligned to the human reference genome v3.0.0 (10× Genomics, GRCh38, Ensembl annotation release 93). Alignment was performed using the count command from Cell Ranger v3.0.1 (10× Genomics) with standard parameters.
Post-hoc analysis of vedolizumab phase III trials in patients with CD (Gemini II/III)
To study exposure-efficacy correlation in the Gemini II and III trials, we submitted a scientific request to Vivli. Following approval, this analysis was based on research using data from Takeda that has been made available through Vivli. Vivli has not contributed to or approved, and is not in any way responsible for the contents of this publication. To evaluate the relationship between vedolizumab trough levels and clinical remission at week 6, we determined the binary outcome ‘clinical remission at week 6’ considering the independent variable ‘serum level at week 6’ by the R-package mgcv (online supplemental file 2).24 Serum level groups were defined based on our in vitro results and on data from our own patient cohort. Clinical remission was defined as a Crohn’s Disease Activity Index score ≤150 points. Relative frequencies of clinical remission were calculated using Excel 2010 (Microsoft). Statistical analysis was performed with Prism 8.
Supplemental material
Results
Differential preferential binding of vedolizumab to TReg and TEff cells at different concentrations
To explore, whether non-linear exposure-efficacy correlations for vedolizumab might be due to α4β7-expressing immune cells not binding vedolizumab, we analysed the frequency of α4+β7+VDZ− immune cells by flow cytometry using fluorescently labelled vedolizumab. We chose a concentration of 10 µg/mL, which was in the range of trough levels associated with optimal outcomes in a phase II trial.22 While the fraction of α4+β7+ cells was highest in CD4+ T cells and eosinophils, only a substantial portion of CD4+α4+β7+ T cells did not bind vedolizumab (online supplemental figure 1 and online supplemental table 12). Thus, we decided to further focus on subsets of CD4+ T cells.
Supplemental material
Supplemental material
To elucidate, whether vedolizumab binding to TReg and TEff cells differed at various concentrations, we used fluorescently labelled vedolizumab and performed flow cytometry analysis of PBMCs from patients with UC, CD and from healthy controls. We gated on CD4+CD127lowCD25highFoxp3+ TReg cells and CD4+CD127highCD25low TEff cells co-expressing integrin α4 and integrin β7 and quantified the fraction of these cells that bound fluorescently labelled vedolizumab (online supplemental figure 2). Here, we used concentrations of up to 50 µg/mL vedolizumab, a trough level that was associated with suboptimal outcomes in a phase II trial.22
Supplemental material
The portion of α4+β7+ cells was significantly higher in TEff compared with TReg cells and comparable between UC, CD and healthy controls (online supplemental figure 3A and online supplemental table 13), while the expression of α4 and β7 per cell (as measured by mean fluorescence intensity (MFI)) was equal or higher on TReg compared with TEff cells (online supplemental figure 3B).
Supplemental material
Supplemental material
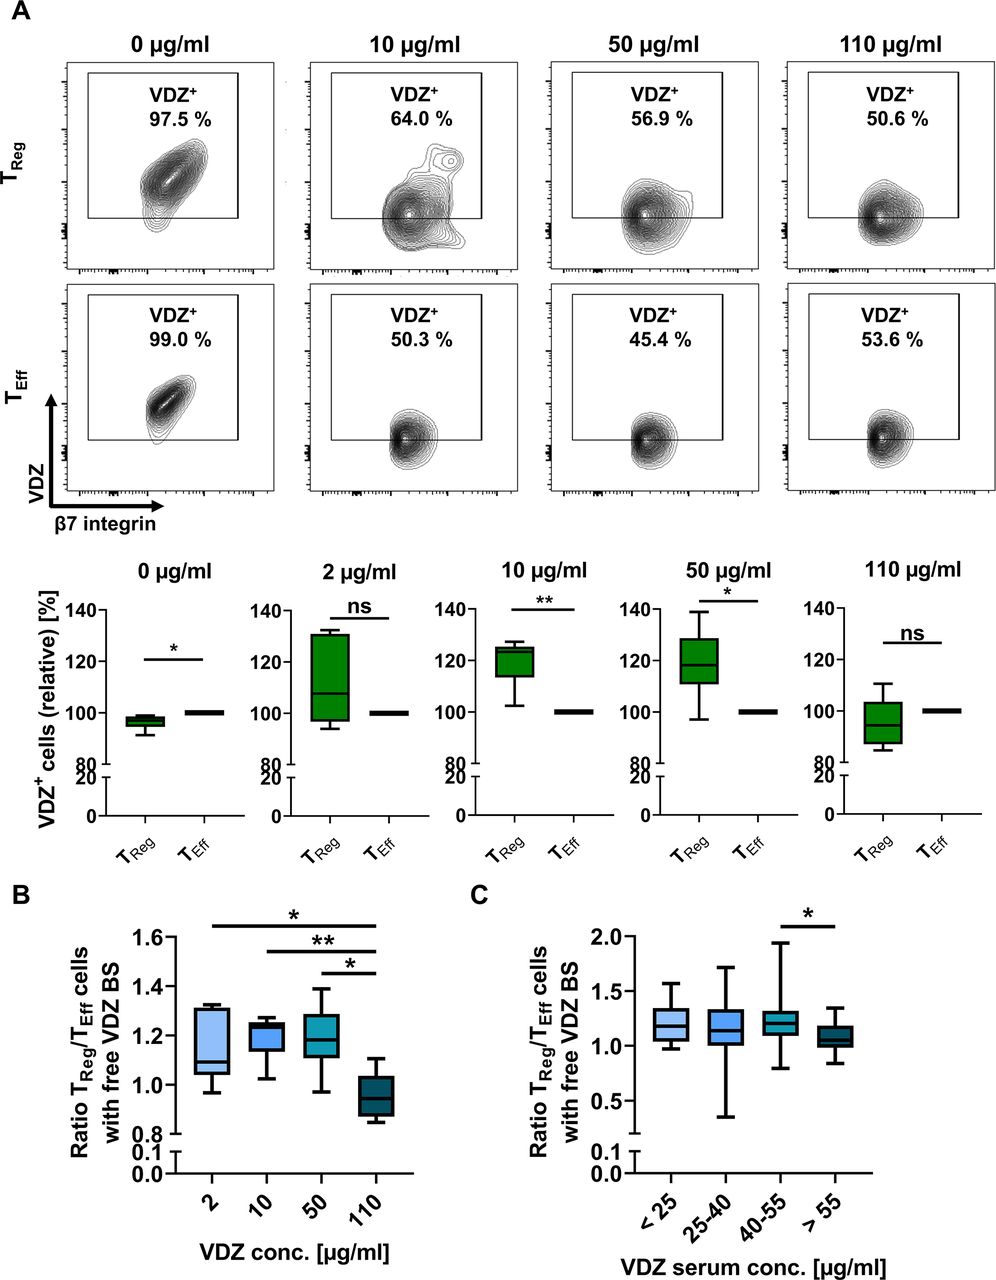
The portion of VDZ+ cells among α4+β7+ CD4+ T cells was similar between TReg and TEff cells from healthy donors and higher on TReg than on TEff cells from patients with UC and CD after exposure with 0.4 µg/mL vedolizumab. However, the fraction of VDZ+ TEff cells was significantly higher compared with TReg cells in healthy donors after exposure with 2 µg/mL vedolizumab and in all entities at 10 µg/mL vedolizumab with some individual differences. Following exposure with 50 µg/mL vedolizumab, virtually 100% of α4+β7+ TReg and TEff cells were positive for vedolizumab (figure 1A,B). In an additional series of experiments, we sought to confirm that these differences were not due to α4β7low naïve T cells in either population. However, we could reproduce our findings, when additionally gating on CD45RO to exclusively select memory T cells (online supplemental figure 3C).
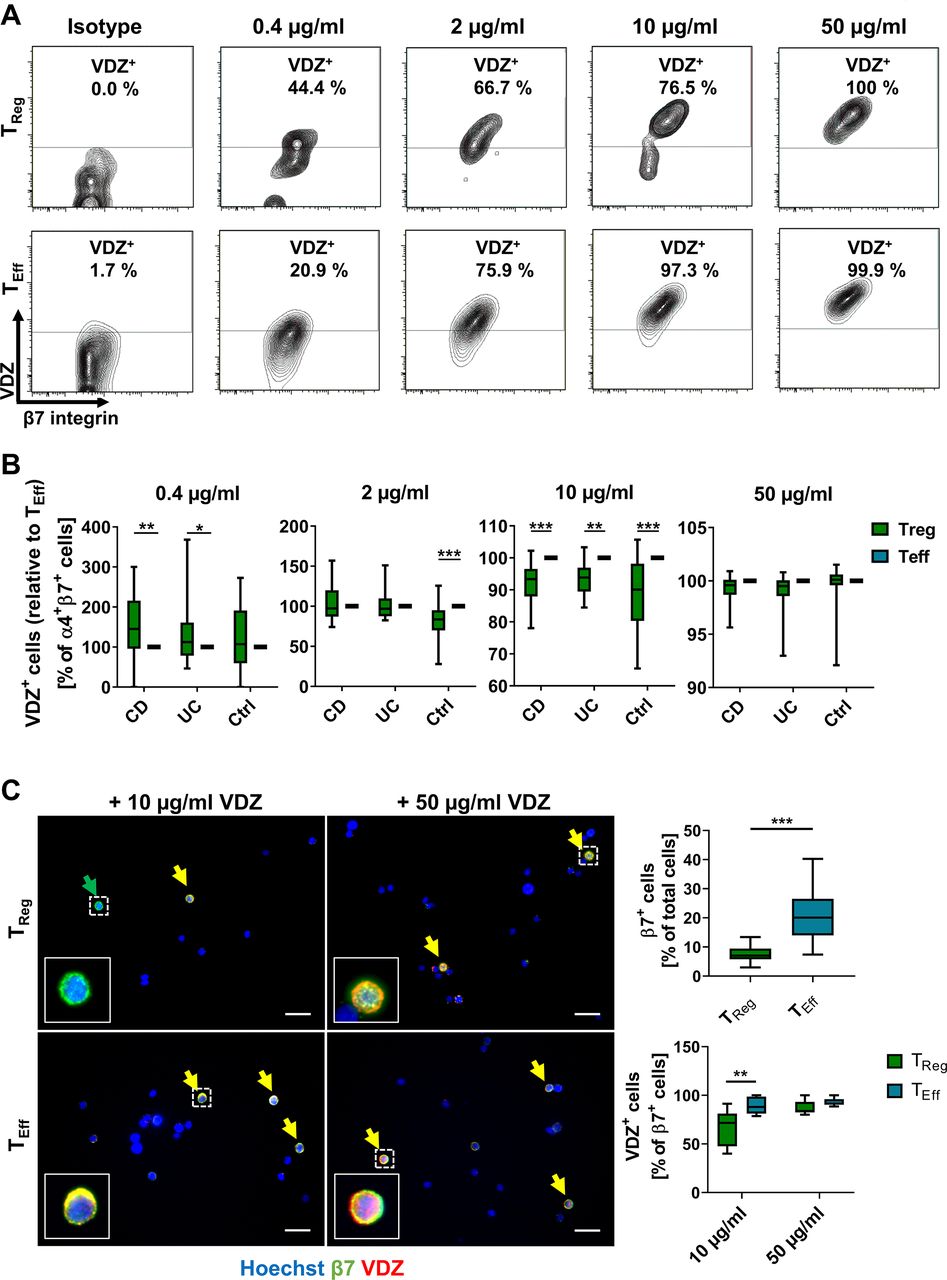
Concentration-dependent binding profile of vedolizumab (VDZ) to TReg and TEff cells. Representative (A) and quantitative (B) flow cytometry of VDZ+ cells after gating on α4+β7+ TReg and TEff cells following incubation with the indicated concentrations of fluorescently labelled VDZ. Quantitative data are expressed relative to TEff cells. n=17–28 patients with IBD or healthy controls as indicated. (C) Representative (left) and quantitative (right) fluorescence microscopy of FACS-purified TReg and TEff cells stained with anti-β7 antibody (green) and different concentrations of fluorescently labelled VDZ (red) and counterstained with Hoechst (blue); scale bar 10 µm. Quantification of β7+ and β7+VDZ+ cells in eight high-power fields. n=5–6 (cells purified from leucocyte cones). Significant outliers were identified using Grubbs test and excluded from the analysis. Statistical comparisons were performed using two-way analysis of variance (ANOVA) with Sidak’s multiple comparison test (A, B) and Student’s t-test and mixed-effects analysis with Sidak’s multiple comparison test (C). Sample donor characteristics are listed in online supplemental table 2. CD, Crohn’s disease; FACS, fluorescence-activated cell sorting; TEff, effector T cell; TReg, regulatory T cell.
Supplemental material
Moreover, microscopic analysis of FACS-isolated TReg and TEff cells stained with a non-competing anti-β7 antibody and incubated with different concentrations of vedolizumab confirmed that less TReg than TEff cells bound vedolizumab at a concentration of 10 µg/mL, which was not the case in cells exposed to 50 µg/mL vedolizumab (figure 1C, online supplemental figure 3D).
We further explored, whether the activation status of the cells and associated differences in α4β7 integrin conformation might be relevant for the differential binding pattern. However, we were also able to reproduce a right-shifted binding profile of TReg cells following stimulation with MnCl2, phorbol-12-myristat-13-acetat/ionomycine and anti-CD3/CD28 (online supplemental figure 4, online supplemental table 14), suggesting that this is not the case.
Supplemental material
Supplemental material
In synopsis, our data showed that blocking α4β7 integrin with vedolizumab on TReg cells requires higher concentrations of the antibody compared with TEff cells. This implied that clinical efficacy of vedolizumab might at least partly result from residual TReg cell homing at concentrations already completely blocking TEff cell homing.
Differential vedolizumab binding to TReg and TEff cells leads to differential dose-dependent adhesion and transmigration profiles
To explore the functional relevance of our findings, we analysed FACS-purified CD4+CD127lowCD25high TReg and CD4+CD127highCD25low TEff cells in functional assays in vitro. Sorting achieved a purity of >99% for both cell types, cells were viable and TReg cells exhibited marked suppressive abilities, when co-cultured with TEff cells (online supplemental figure 5).
Supplemental material
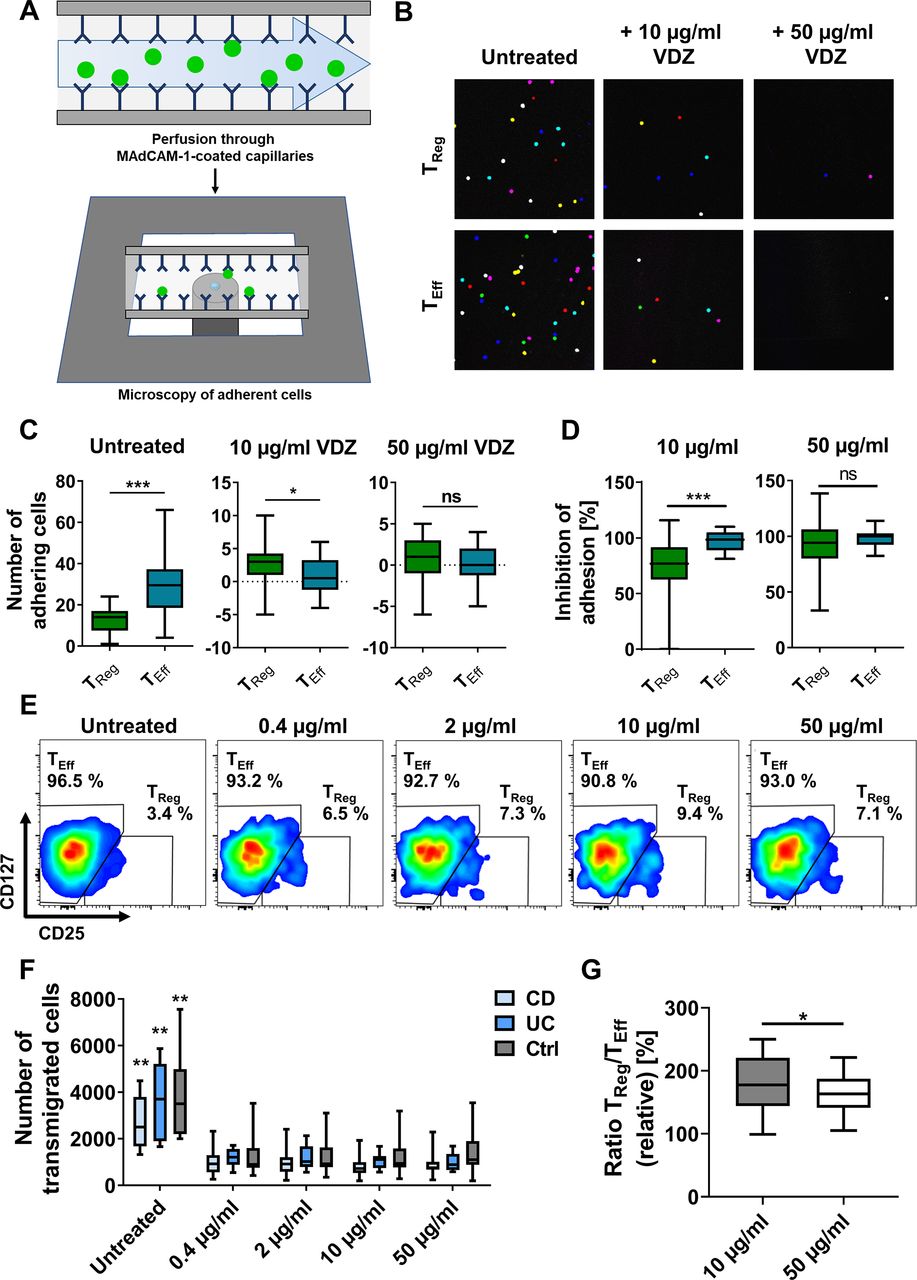
We analysed the impact of in vitro treatment with vedolizumab on the dynamic adhesion of TReg and TEff cells to MAdCAM-1 (figure 2A). We focused on 10 µg/mL and 50 µg/mL as the most clinically relevant concentrations.25 Consistent with α4β7 integrin expression, adhesion was significantly higher for untreated TEff compared with untreated TReg cells (figure 2B,C). Either treatment led to a reduction of the dynamic adhesion of both cell types. However, inhibition of adhesion of TReg cells was substantially lower compared with TEff cells after treatment with 10 µg/mL vedolizumab, while almost complete inhibition of adhesion and no difference between TReg and TEff cells could be observed after treatment with 50 µg/mL vedolizumab (figure 2D).

Concentration-dependent adhesion and transmigration of TReg and TEff cells in functional assays in vitro. (A–D) Dynamic adhesion of TReg and TEff cells treated with different concentrations of vedolizumab to MAdCAM-1. (A) Schematic representation of the experimental setup; fluorescently labelled TReg and TEff cells were incubated with different concentrations of VDZ, perfused through MAdCAM-1-coated capillaries and adhering cells were quantified using confocal microscopy. (B) Representative microscopic images of adhered cells (overlay of counted high-power fields) and (C) quantification of the background-corrected number of TReg and TEff cells incubated with or without 10 or 50 µg/mL VDZ adhering to MAdCAM-1. (D) Relative inhibition of adhesion of TReg and TEff cells to MAdCAM-1 after treatment with 10 or 50 µg/mL VDZ. n=22 (cells purified from leucocyte cones). (E–G) Transmigration assays with CD4+ T cells. The fraction of TReg and TEff cells in the transmigrating cells was quantified by flow cytometry. Representative (E) and quantitative flow cytometry (F) of transmigrating CD4+ cells after treatment with different concentrations of VDZ. **p<0.01 compared with all treatment groups. (G) TReg/TEff ratio of transmigrated cells after treatment with 10 versus 50 µg/mL VDZ (G). n=8–17 patients with IBD or healthy controls as indicated. Statistical comparisons were performed using paired t-test (C, D) and mixed-effects analysis with Tukey’s multiple comparisons test and paired t-test (F, G). Sample donor characteristics are listed in online supplemental table 3. CD, Crohn’s disease; MAdCAM-1, mucosal addressin cell adhesion molecule-1; TEff, effector T cell; TReg, regulatory T cell; VDZ, vedolizumab.
Supplemental material
In a second approach, we investigated the impact of different concentrations of vedolizumab on MAdCAM-1-dependent transmigration of TReg and TEff cells in vitro. T cells were left to transmigrate towards CCL25 over MAdCAM-1-coated transwell plates with 3 µm pores in the presence of different vedolizumab concentrations. Treatment with all concentrations of vedolizumab led to a significant and similar reduction of transmigration of cells from patients with UC and CD as well as healthy controls. However, the ratio of transmigrated TReg to TEff cells was substantially higher after treatment with 10 µg/mL vedolizumab compared with 50 µg/mL (figure 2E–G).
Taken together, these data supported the notion that differential binding of vedolizumab to TReg and TEff cells has functional implications for T cell adhesion and transmigration.
Differential vedolizumab binding to TReg and TEff cells leads to differential homing to the inflamed gut in vivo
We next aimed to address, whether we could detect similar effects in vivo. To this end, we made use of a previously described humanised mouse model of T cell homing to the inflamed gut (figure 3A), in which we had earlier shown a comparable or even higher reduction of TReg cell homing to the gut after treatment with high vedolizumab concentrations.10 Based on our above findings, we now investigated the effect of treatment with 10 µg/mL vedolizumab. Intravital confocal microscopy demonstrated active trafficking of the transferred cells (figure 3B). As expected, more untreated TEff cells homed to the gut compared with untreated TReg cells. Interestingly, treatment with 10 µg/mL vedolizumab led to substantially reduced homing of TEff cells, while TReg cell homing was not significantly affected as assessed by flow cytometry and lightsheet fluorescence microscopy (figure 3C,D). These observations further supported our concept of differential responses of T cell subsets to vedolizumab.
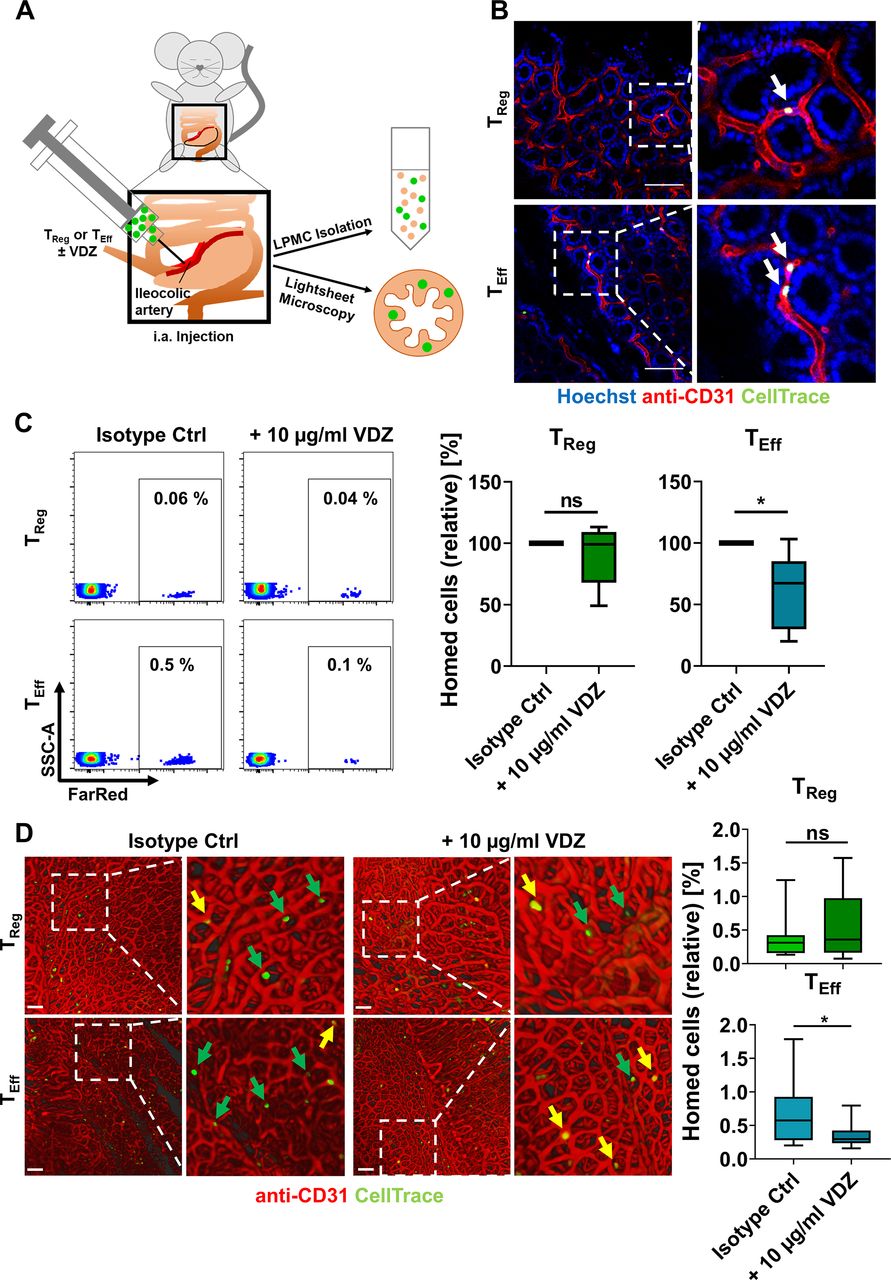
In vivo homing of TReg and TEff cells in a humanised mouse model. (A) Schematic representation of in vivo homing assays. Fluorescently labelled TReg or TEff cells±10 µg/mL VDZ were injected into the ileocolic artery of anesthetised mice for subsequent quantification of homed cells by LPMC isolation and flow cytometry or lightsheet microscopy. (B) Visualisation of homed cells (green) using intravital confocal microscopy. Red: blood vessels stained with anti-CD31; blue: nuclear counter-stain with Hoechst. Arrows indicate adhering human cells. Scale bar 100 µm. (C) Representative (left) and quantitative (right) flow cytometry of FarRed+ human TReg and TEff cells accumulating in the lamina propria of Rag1−/− mice after treatment with either isotype control or with 10 µg/mL VDZ. n=6 per group (cells purified from leucocyte cones). (D) Representative (left) and quantitative (right) lightsheet fluorescence microscopy. Arrows indicate adherent cells still inside the vasculature (yellow) or extravasated into the tissue (green). Quantification of homed cells in 15 representative 3D cubes from three individual experiments (relative to the number of injected cells). Scale bar 100 µm. Statistical comparisons were performed using one-sample t-test and Student’s t-test. LPMC, lamina propria mononuclear cells; TEff, effector T cell; TReg, regulatory T cell; VDZ, vedolizumab.
Differential vedolizumab binding to TReg and TEff cells correlates with the availability of α4β7 integrin in vivo
We reasoned that for in vivo action of vedolizumab in patients with IBD, the remaining availability of free α4β7 molecules at a certain exposure is crucial. Thus, to understand, how different vedolizumab concentrations affect available α4β7 integrin, we exposed PBMCs to ascending doses of vedolizumab in vitro and subsequently labelled free binding sites. While we observed no significant difference in the ratio of TReg and TEff cells with free vedolizumab binding sites at a concentration of 2 µg/mL, a significantly higher portion of TReg compared with TEff cells had free α4β7 molecules available on their surface after incubation with 10 and 50 µg/mL vedolizumab. At a concentration of 110 µg/mL vedolizumab (in the range of the highest serum levels observed in patients25), the abundance of cells with free binding sites was similar again (figure 4A,B, online supplemental figure 6A,B), further supporting the concept of a right-shifted TReg cell response to vedolizumab.
Supplemental material

Quantification of TReg and TEff cells with free vedolizumab binding sites in vitro and in vivo. (A) Representative and quantitative flow cytometry of free VDZ binding sites on α4+β7+ TReg and TEff cells after incubation with different concentrations of unlabelled VDZ in vitro and consecutive staining with saturating concentrations of fluorescently labelled VDZ. Quantitative data are expressed relative to TEff cells. n=5–6 patients with IBD and healthy controls. (B) TReg/TEff ratio of cells with free vedolizumab binding sites (free VDZ BS) after treatment with different concentrations of vedolizumab. n=5–6 patients with IBD and healthy controls. (C) TReg/TEff ratio of cells with free vedolizumab binding sites in patients undergoing vedolizumab therapy stratified according to VDZ trough levels. Staining was performed at week 2 and/or 6 of treatment, trough levels were determined using vedolizumab drug level ELISA. n=8–58 samples from patients with IBD per serum group, some patients provided blood at week 2 and week 6. Statistical comparisons were performed using one-sample t-test (A) and Student’s t-test (B, C). Sample donor characteristics are listed in online supplemental tables 4 and 5. TEff, effector T cell; TReg, regulatory T cell.
Supplemental material
Supplemental material
To explore, whether this holds also true in vivo, we determined the serum trough levels in patients with IBD receiving vedolizumab therapy at week 2 and 6 and simultaneously determined free binding sites. In an exploratory analysis, we observed an optimum in the ratio of TReg and TEff cells with free α4β7 molecules available in the range of 40 to 55 µg/mL vedolizumab trough level and a significantly reduced ratio at even higher serum levels (figure 4C, online supplemental figure 6C).
In conclusion, these data suggested that certain vedolizumab exposure levels go along with higher residual availability of functional α4β7 integrin on TReg compared with TEff cells in patients with IBD in vivo.
Single-cell RNA sequencing identifies an ITGB1+PI16+ TReg cell subset ‘resistant’ to vedolizumab
To further dissect the mechanisms underlying our observations, we decided to use single-cell RNA sequencing. To this end, we FACS-purified CD4+CD45RO+α4+β7+ cells binding fluorescently labelled vedolizumab (VDZ+) or not (VDZ−) at a concentration of 10 µg/mL. Re-analysis of sorted cells confirmed that all selected cells expressed the integrins α4 and β7 (online supplemental figure 7A). Moreover, we observed that the vast majority of α4+β7+VDZ− cells also stained positive for fluorescently labelled MAdCAM-1 (online supplemental figure 7B) and observed dynamic adhesion of CD4+CD45RO+α4+β7+VDZ− cells to MAdCAM-1, corroborating that α4β7 integrin expressed on cells not binding vedolizumab is functional (online supplemental figure 7C).
Supplemental material
Following single-cell sequencing, VDZ− and VDZ+ samples were merged for comparative analysis. Clustering analysis using unique molecular identifiers at a resolution of 1 identified 11 distinct clusters (figure 5A). Using eight different marker genes (online supplemental figure 8A,B), clusters 9 and 10 were identified as TReg cell clusters (figure 5B).
Supplemental material

Single-cell RNA-sequencing of CD4+CD45RO+α4+β7+VDZ+ and CD4+CD45RO+α4+β7+VDZ− cells. (A) UMAP plot showing clustering of 14 265 cells based on Leiden algorithm at resolution 1. (B) UMAP plots showing the distribution of cells from the VDZ+ and VDZ− sample in all cells (left panel) and in the TReg cell clusters 9 and 10 (right panel). (C) Violin plots displaying the differential gene expression of selected genes in the TReg and TEff cell clusters from the VDZ+ and VDZ− sample. (D) UMAP plots of the TReg cell subclusters showing cells expressing PI16, CCR10, ITGB1, CCR9 and CD38. TEff, effector T cell; TReg, regulatory T cell; UMAP, uniform manifold approximation and projection; VDZ, vedolizumab.
Our further analyses showed that—consistent with our previous data—the fraction of TReg cells was higher in the VDZ− compared with the VDZ+ sample (figure 5B). Interestingly, the VDZ− TReg cells also expressed TReg marker genes to a higher extent than VDZ+ TReg cells (online supplemental figure 8C). When comparing VDZ- and VDZ+ TReg and TEff cells, we identified a specific signature of differentially expressed genes, many of which were associated with adhesion, extravasation and chemotaxis (figure 5C). As we aimed to characterise α4β7-expressing TReg cells not binding vedolizumab, we further focused on VDZ− in comparison with VDZ+ TReg cells. Taking into account differential gene expression and the fraction of cells expressing the relevant genes, we identified a distinct TReg cell subpopulation expressing ITGB1, PI16 and CCR10, but not expressing CCR9 and CD38 that was predominant in the VDZ− sample and almost completely absent in the VDZ+ sample (figure 5D, online supplemental table 16).
Supplemental material
β1+PI16+ TReg cells show reduced vedolizumab binding in vitro and in vivo
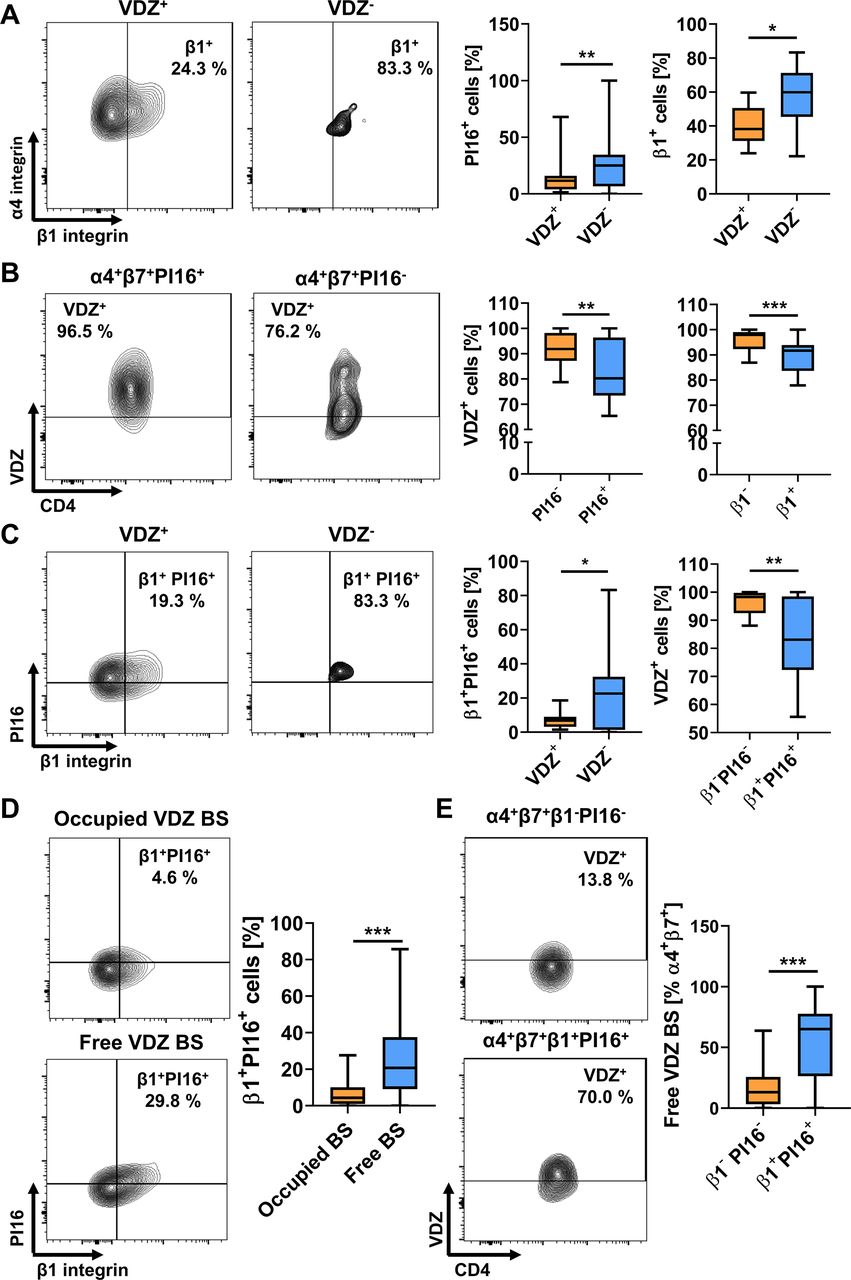
To validate our findings, we stained PBMCs from healthy controls with antibodies against the different molecules identified above. We confirmed that a significantly higher portion of TReg cells not binding VDZ at 10 µg/mL expressed PI16 and β1 integrin compared with vedolizumab-binding TReg cells (figure 6A). Vice versa, the abundance of VDZ+ cells was lower in α4β7-expressing TReg cells positive for PI16 or β1 (figure 6B). Consistently, co-expression of β1 integrin and PI16 was observed in substantially more VDZ- compared with VDZ+ cells and vedolizumab binding to β1+PI16+ cells was clearly lower than to β1−PI16− cells (figure 6C).

Flow cytometric validation of differentially expressed marker genes between VDZ+ and VDZ− TReg cells in vitro and in vivo. (A) Representative (left) and quantitative (right) flow cytometry showing the fraction of α4+β7+ TReg cells binding (VDZ+) or not binding (VDZ−) vedolizumab at a concentration of 10 µg/mL and expressing PI16 or integrin β1. n=14 healthy donors. (B) Representative (left) and quantitative (right) flow cytometry showing vedolizumab binding to α4+β7+ TReg cells expressing PI16 or integrin β1. n=16 healthy donors.(C) Representative (left) and quantitative (right) flow cytometry showing the fraction of α4+β7+ TReg cells binding (VDZ+) or not binding (VDZ−) vedolizumab at a concentration of 10 µg/mL and co-expressing PI16 and integrin β1 or showing vedolizumab binding to α4+β7+ TReg cells co-expressing PI16 and integrin β1. n=16 healthy donors. (D) Representative (left) and quantitative (right) flow cytometry showing the fraction of α4+β7+ TReg cells with occupied or with free vedolizumab binding sites (VDZ BS) expressing integrin β1 and PI16 in patients treated with vedolizumab. n=57 samples from patients with IBD, some patients provided blood at week 2 and week 6. (E) Representative (left) and quantitative (right) flow cytometry showing free vedolizumab binding sites on β1+PI16+α4+β7+ TReg cells. n=57 samples from patients with IBD, some patients provided blood at week 2 and week 6. Statistical comparisons were performed using paired t-test. Sample donor characteristics are listed in online supplemental tables 6 and 7. TEff, effector T cell; TReg, regulatory T cell.
Supplemental material
Supplemental material
Next, we obtained PBMCs from patients with IBD receiving clinical treatment with vedolizumab and assessed free vedolizumab binding sites (BS) on TReg cells together with the expression of the above markers. We observed that among TReg cells expressing α4β7 integrin with free binding sites for vedolizumab, cells expressing β1 and PI16 were significantly more abundant than among TReg cells already saturated with vedolizumab (figure 6D). Furthermore, among β1+PI16+ TReg cells, substantially more cells had free vedolizumab binding sites available than among β1−PI16− TReg cells (figure 6E).
Together, these data corroborated our in silico findings and suggested that a β1+PI16+ TReg cell subset is the substrate of differential vedolizumab binding to TReg and TEff cells.
Vedolizumab-‘resistant’ β1+PI16+ TReg cells show a pronounced regulatory phenotype
Next, we aimed to further characterise the function of this TReg cell subset. Transcript levels in our single-cell dataset suggested that TReg cells not binding vedolizumab express a high level of regulatory markers and might therefore be a particularly suppressive cell population (online supplemental figure 8C).
Thus, we performed flow cytometry of CD4+CD25highCD127lowα4+β7+ TReg cells co-expressing integrin β1 and PI16 or not. We observed higher expression of CD25 per cell on β1+PI16+ than on β1−PI16− gut-homing TReg cells (figure 7A). In addition, more β1+PI16+ TReg cells expressed Foxp3 and GITR and also to a higher extent (figure 7B,C). Functionally, after in vitro stimulation, a massively higher portion of β1+PI16+ TReg cells than β1−PI16− TReg cells produced the suppressive cytokine IL-10 (figure 7D). These observations could also be reproduced using PBMCs from patients with IBD (online supplemental figure 9, online supplemental table 15). Finally, using in vitro co-culture suppression assays, VDZ-, but not VDZ+ TReg cells clearly inhibited TEff cell proliferation (figure 7E).
Supplemental material
Supplemental material

Characterisation of vedolizumab-‘resistant’ β1+PI16+α4+β7+ TReg cells in the peripheral blood. (A) Quantitative flow cytometry showing mean fluorescence intensity (MFI) of CD25 on β1+PI16+α4+β7+ TReg compared with β1−PI16−α4+β7+ TReg cells. n=8 healthy donors. (B) Representative (left) and quantitative (right) flow cytometry showing the frequency of Foxp3-expressing β1+PI16+α4+β7+ TReg compared with β1−PI16−α4+β7+ TReg cells. n=8 healthy donors. (C) Representative (left) and quantitative (right) flow cytometry showing the frequency and mean fluorescence intensity (MFI) of GITR on β1+PI16+α4+β7+ TReg compared with β1−PI16−α4+β7+ TReg cells. n=6 healthy donors. (D) Representative (left) and quantitative (right) flow cytometry showing the frequency and the mean fluorescence intensity (MFI) of IL-10 on β1+PI16+α4+β7+ TReg compared with β1−PI16−α4+β7+ TReg cells after incubation with PMA, ionomycine and brefeldin A for 4 hours. n=8 healthy donors. (E) Representative flow cytometry of TEff cell proliferation as determined by dilution of CellTrace FarRed. Representative images from one out of five independent experiment (cells purified from leucocyte cones). Statistical significance was calculated using paired t-test. Sample donor characteristics are listed in online supplemental table 8. PMA, phorbol-12-myristat-13-acetat; TEff, effector T cell; TReg, regulatory T cell; VDZ, vedolizumab.
Supplemental material
In a next step, we aimed to elucidate, whether the subset identified was also present in the gut of patients with IBD. Therefore, we performed in silico analyses with a publically available single-cell RNA sequencing dataset of CD45+ cells from the rectum of 11 patients with UC (GSE162335). We identified TReg cells and compared the expression of several key regulatory genes between β1+PI16+ and other TReg cells. In line with our single-cell data from the peripheral blood, we observed that many of these genes were expressed by a larger fraction of β1+PI16+ cells or at higher levels in these cells (figure 8A,B). To confirm these transcriptomic data, we isolated lamina propria mononuclear cells (LPMCs) from gut biopsies of patients with IBD and analysed CD4+CD25highCD127lowFoxp3+β7+ TReg cells co-expressing integrin β1 and PI16 or not using flow cytometry (online supplemental figure 10). β1+PI16+ TReg cells demonstrated a clearly higher expression of CD25 per cell (as determined by MFI) compared with β1−PI16− TReg cells (figure 8C). Moreover, in vitro stimulation of LPMCs led to a significantly higher portion of β1+PI16+ than β1−PI16− TReg cells producing IL-10 (figure 8D).
Supplemental material

Characterisation of β1+PI16+β7+ TReg cells in the lamina propria of patients with IBD. (A) UMAP plot showing clustering of T cells from a publicly available single-cell RNA sequencing dataset (GSE162335) of CD45+ LPMCs from the rectum of 11 patients with UC (left panel) and UMAP plots showing the distribution of TReg cells (right panel). (B) Heat map showing differential gene expression and the portion of cells expressing five prominent regulatory genes in β1+PI16+ compared to all other TReg cells from the dataset shown in (A). (C) Representative (left) and quantitative (right) flow cytometry showing mean fluorescence intensity (MFI) of CD25 on CD4+CD25highCD127lowFoxp3+β7+β1+PI16+ TReg compared with CD4+CD25highCD127lowFoxp3+β7+β1−PI16− TReg cells. n=8 patients with IBD. (D) Representative (left) and quantitative (right) flow cytometry showing the frequency of IL-10 on CD4+Foxp3+β7+β1+PI16+ TReg compared with CD4+Foxp3+β7+β1−PI16− TReg cells after incubation with PMA, ionomycine and brefeldin A for 4 hour. n=8 patients with IBD. Statistical significance was calculated using Student’s t-test. Sample donor characteristics are listed in online supplemental table 9. LPMC, lamina propria mononuclear cells; PMA, phorbol-12-myristat-13-acetat; TReg, regulatory T cell; UMAP, uniform manifold approximation and projection.
Supplemental material
Collectively, these data strongly supported the notion that vedolizumab-‘resistant’ β1+PI16+ gut-homing TReg cells have a powerful regulatory function in the peripheral blood as well as in the intestine and might counteract inflammation in the gut.
β1+PI16+ TReg cells are ‘resistant’ to vedolizumab in vivo and enrich in the gut of patients with IBD responding to vedolizumab therapy
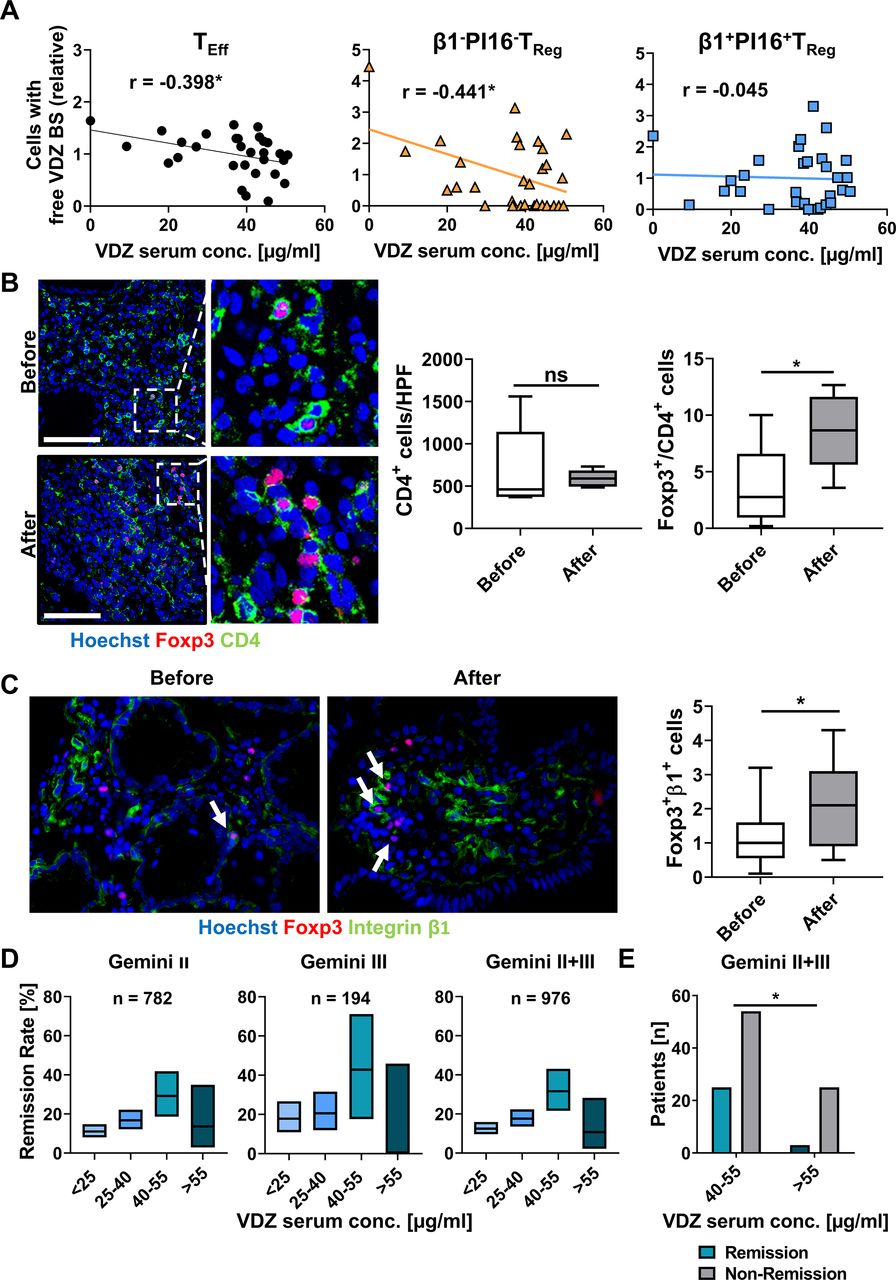
In a next step, we aimed to study, whether vedolizumab ‘resistance’ of α4β7-expressing β1+PI16+ TReg cells can also be observed in vivo. To this end, we quantified serum trough levels in patients with IBD receiving vedolizumab therapy and determined the availability of free vedolizumab binding sites on these cells. As expected, the portion of TEff cells with untargeted α4β7 integrin on their surface decreased in a dose-dependent fashion. However, this was not the case for α4β7-expressing β1+PI16+ TReg cells, while α4β7-expressing β1−PI16− TReg cells exhibited a dose-dependent decrease similar to TEff cells (figure 9A).
Resistance of β1+PI16+α4+β7+ TReg cells to vedolizumab in patients with IBD in vivo and correlation with Gemini II and III trials. (A) Correlation of TEff cells (left), β1+PI16+α4+β7+ TReg cells (middle) and β1−PI16−α4+β7+ TReg cells with free vedolizumab binding sites (VDZ BS) as determined by flow cytometry with serum trough levels of vedolizumab as determined by ELISA in a cohort of patients with IBD treated with vedolizumab. Line showing simple linear regression. n=30 patients with IBD. (B, C) Representative (left) and quantitative (right) immunohistochemistry of human colon biopsies obtained from patients before or under treatment with VDZ. (B) CD4 (green), Foxp3 (red) and nuclei counterstain with Hoechst (blue), (C) Integrin β1 (green), Foxp3 (red) and nuclei counterstain with Hoechst (blue). Scale bar 100 µm (B), 50 µm (C). Quantification of eight high-power fields (HPF) per sample. n=6 (B), n=12–16 (C) patients with IBD. (D) Percentage of patients with CD from Gemini II and/or III trials achieving clinical remission at week 6 stratified according to VDZ though levels at week 6. 28–463 patients with CD per group. Boxes indicate remission rates with 95% Clopper-Pearson CI. (E) Comparison of the number of patients with or without clinical remission at week 6 in Gemini II and III with a trough level between 40–55 µg/mL and >55 µg/mL. Statistical comparisons were performed using Student’s t-test (B, C) and Fisher’s exact test (E). Sample donor characteristics are listed in online supplemental tables 10 and 11. TEff, effector T cell; TReg, regulatory T cell; VDZ, vedolizumab.
Supplemental material
Supplemental material
Since these data further suggested that residual TReg cell homing might crucially contribute to clinical efficacy of vedolizumab, we stained colon biopsies from responders to vedolizumab therapy obtained before the initiation of and under vedolizumab treatment for CD4 and Foxp3. While there was no quantitative difference in overall CD4+ T cells before and under therapy, the portion of Foxp3+CD4+ cells was significantly increased in patients with active therapy compared with before therapy (figure 9B). Interestingly, further stainings showed that more Foxp3+ cells present in the colon of patients treated with vedolizumab co-stained for β1 than before treatment (figure 9C). Again and on tissue level, this was consistent with the idea of residual gut homing of β1+ TReg cells under vedolizumab therapy.
Finally, we performed a post-hoc analysis of phase III data from the Gemini II and III trials of vedolizumab in patients with CD to correlate our observations to clinical outcomes. We determined the primary efficacy endpoint (remission rate at week 6) depending on the corresponding vedolizumab trough levels. Intriguingly, when stratifying for serum concentrations as in our cohort, remission rates in the range from 40 to 55 µg/mL vedolizumab were clearly higher than below and above. In a pooled analysis, the difference between the 40 to 55 µg/mL and the above 55 µg/mL group was significant (figure 9D,E). In conclusion, these observations were well reconcilable with non-linear dose–response characteristics due to residual homing of β1+PI16+ TReg cells.
Discussion
Vedolizumab is successfully used for the treatment of IBD and is applied as a fixed dose.26 27 Both in clinical trials and in real-world cohorts a broad range of resulting serum drug levels has been observed,11 12 19 indicating that individual pharmacokinetics substantially differ. At the same time, vedolizumab is only efficient in a portion of patients and optimising drug levels has been proposed as one strategy to improve results, but yet to be further investigated and developed.16 28 Here, we show that α4β7-expressing TReg cells exhibit a right-shifted response to vedolizumab compared with TEff cells and identify a β1+PI16+ TReg cell subset as the substrate of this effect. From a clinical perspective, our data argue for a concept of optimally exploiting residual TReg cell homing by aiming at high, but avoiding too high serum concentrations. This would mean that vedolizumab exposure would have to be increased in the vast majority, but limited in a small part of the patients, which could be achieved by therapeutic drug monitoring and applying individual doses of the antibody.
Multiple pieces of evidence show that reaching a certain vedolizumab drug level is a prerequisite or at least increasing the odds for therapeutic benefit. Earlier post-hoc analyses of phase III trials had shown that the median trough levels in patients with clinical remission were higher than in patients without. Moreover, below a trough level of 17 µg/mL in UC and 16 µg/mL in CD, remission rates were not significantly different from placebo.17 Another recent analyses of the GEMINI I data for UC identified target trough levels of >37.1 µg/mL,>18.4 µg/mL and 12.7 µg/mL for weeks 6, 14 and maintenance to achieve clinical remission.29 Similar observations have been made in real-world cohorts with regard to different end-points: Dreesen et al identified a trough level of >24 µg/mL and >14 µg/mL in week 6 and 14, respectively, to be associated with effectiveness at weeks 14 and 22.28 In a cohort described by Yacoub et al, trough levels at week 6 were clearly higher in those patients achieving mucosal healing within 1 year.30 Another prospective study identified serum trough levels at week 2 (median 24.8 µg/mL vs 20 µg/mL) and 6 (median 25 µg/mL vs 17.3 µg/mL) to be associated with long-term endoscopic remission at week 52.31 A French retrospective cohort study was able to link higher vedolizumab serum levels with higher rates of histological healing.32 And in the cohort of Ungaro et al, patients with trough levels of >11.5 µg/mL were more than twice as likely as patients below this threshold to enter steroid-free endoscopic remission after 1 year.33 While all those data point into the same direction, the cohorts described, the endpoints assessed and the time points of trough level determination were heterogenous. Consistently, therapeutic management based on trough level monitoring has not entered clinical practice so far.
On first view, these real-world studies seem to contradict the postulation of a non-linear exposure-efficacy correlation of vedolizumab at high concentrations. However, one has to acknowledge that only very few patients actually reach drug levels at which we observed inhibition of residual TReg cell homing and decreased efficacy in Gemini II and III. As a consequence, such patients are likely to ‘vanish’ in the patient population with optimal drug exposure, particularly since many of the studies mentioned are based on quartiles of trough levels.17 32 Moreover, two independent dose-ranging phase II trials reported non-linear correlations in the high exposure range22 23 and a phase II trial of the anti-β7 integrin antibody etrolizumab revealed a similar correlation.34
Thus, our data are not only significant for providing a mechanistic explanation for the efficacy of vedolizumab in the optimal drug level range through residual gut homing of TReg cells, but also underscore that a ‘therapeutic window’ might exist for this effect that is lost at very high concentrations. Obviously, the ranges observed for this window slightly differed depending on the experimental technique used (eg, binding analyses vs analyses of free binding sites). However, this is not unsurprising regarding the different approaches employed and the overlap is still substantial and consistent with read-outs of the same effect. Our data are different from earlier data reporting an EC50 for binding of vedolizumab to T cells of 0.042 µg/mL.35 Yet, this might also be explained by different methodology; importantly the flow cytometric read-out was based on MFI and not as in our case on the fraction of cells with positive staining.
In particular, we show that an α4β7-expressing β1+PI16+ TReg cell subset is ‘resistant’ to vedolizumab. A question yet to answer in future studies is, what drives resistance of these cells. The specific expression profile of chemokine receptors in this population raises the questions, whether chemokine signalling36 37 might induce particular conformations of the α4β7 integrin that might be better or worse accessible for vedolizumab. Similarly, differential post-translational modifications of α4β7 integrin might regulate accessibility. And as in mice,38 high expression of β1 integrin has been reported to interfere with the functionality of α4β7 integrin.
More importantly, also in a broader context, the β1+PI16+ TReg cell subset we identified seems to be a functionally clearly distinct cell population and we show that these cells have a pronounced regulatory phenotype predesignating them as powerful anti-inflammatory cells capable of counteracting intestinal inflammation. PI16 expression by TReg cells had first been described in 2010.39 Fully consistent with our characterisation of the subset, a later study yielded first hints at particular migratory features of PI16+ TReg cells by identifying enhanced migration to CCL17 and CCL20.40 Moreover, a recent study characterising PI16+ vs PI16− TReg cells, provided a first glimpse at the phenotype of our subset by describing increased expression of ITBG1 by and suggesting enhanced functional fitness of PI16+ TReg cells.41
Importantly, our data do not provide a formal proof that TReg cells such as the β1+PI16+ subset we identified are causally related with clinical efficacy of vedolizumab and we cannot definitely exclude that similar features apply to other small cell subsets. However, apart from the fact that such a proof would be almost impossible to provide and although effects of vedolizumab on innate immune cells have recently been proposed42 and interference with α4β7-dependent homing of non-classical monocytes has been shown,43 T cells are still considered to be the main target of vedolizumab therapy.8 9 44
Yet, when envisioning translation of our findings into clinical practice, our data provide a clear rationale to perform prospective studies, which should (1) characterise TReg cell populations over the course of vedolizumab therapy, (2) define the optimal target trough levels at pre-specified time points and (3) time points for and (4) the kind of intervention to correct deviations from these exposure targets.
In conclusion, we show that a β1+PI16+ TReg cell subset that displays ‘resistance’ to vedolizumab with a right-shifted binding curve might explain efficacy of vedolizumab and define an optimal ‘therapeutic window’ that is consistent with the data from randomised clinical trials. Our data support further efforts to optimise vedolizumab therapy by tailoring drug exposure in vivo in a personalised approach.
Ethics statements
Patient consent for publication
Ethics approval
All samples were collected following informed written consent from the participants and all procedures were approved by the Ethics Committee of the Friedrich-Alexander-University Erlangen-Nuremberg, Germany (40_16B, 249_13B, 135_20B).
Acknowledgments
The research of SZ, RA, IA and MFN was supported by the Interdisciplinary Center for Clinical Research (IZKF) and the ELAN programme of the University Erlangen-Nuremberg, the Fritz-Bender-Stiftung, the Ernst Jung-Stiftung, the Else Kröner-Fresenius-Stiftung, the Thyssen-Stiftung, the German Crohn’s and Colitis Foundation (DCCV), the DFG topic programme on Microbiota, the Emerging Field Initiative, the DFG Collaborative Research Centers 643, 796, 1181 and TRR241, the Rainin Foundation and the Litwin IBD Pioneers programme of the Crohn’s and Colitis Foundation of America (CCFA). ANH is supported by a Lichtenberg fellowship by Volkswagen Foundation, a Berlin Institute of Helath Clinician Scientist grant and German Research Foundation (DFG-TRR241-A05). The authors thank J. Derdau, D. Dziony, J. Marcks, J. Schuster and M. Slawik for their invaluable technical assistance. Furthermore, we thank the Core Unit for cell sorting and immune monitoring and the Core Unit Next generation Sequencing from the Friedrich-Alexander University Erlangen-Nuremberg for their excellent technical support. Parts of this publication are based on research using data from Takeda that has been made available through Vivli. Vivli has not contributed to or approved, and is not in any way responsible for, the contents of this publication.
References
Supplementary materials
Supplementary Data
This web only file has been produced by the BMJ Publishing Group from an electronic file supplied by the author(s) and has not been edited for content.
- Data supplement 1
- Data supplement 2
- Data supplement 3
- Data supplement 4
- Data supplement 5
- Data supplement 6
- Data supplement 7
- Data supplement 8
- Data supplement 9
- Data supplement 10
- Data supplement 11
- Data supplement 12
- Data supplement 13
- Data supplement 14
- Data supplement 15
- Data supplement 16
- Data supplement 17
- Data supplement 18
- Data supplement 19
- Data supplement 20
- Data supplement 21
- Data supplement 22
- Data supplement 23
- Data supplement 24
- Data supplement 25
- Data supplement 26
- Data supplement 27
- Data supplement 28
Footnotes
Correction notice This article has been corrected since it published Online First. The funding statement has been added.
Contributors EB and AS performed experiments. EB and SZ designed the study. EB, MW, AS-K, RA, IA, TMM, CV, ANH, FV, MFN and SZ provided clinical samples, protocols or reagents; ABE and MD performed and analysed RNA sequencing; CG, EB and SZ performed statistical analysis of the phase III data; EB, MD, MW, MFN and SZ analysed and interpreted the data. EB and SZ drafted the manuscript with the help of MFN; all authors critically revised the manuscript for important intellectual content.
Funding Else Kröner-Fresenius Stiftung (2016_A182), European Crohn’s and Colitis Organization (ECCO), German Research Foundation (ZU 377/4-1).
Competing interests MFN has served as an advisor for Pentax, Giuliani, MSD, Abbvie, Janssen, Takeda and Boehringer. SZ received honoraria from Takeda, Roche and Janssen. MFN and SZ received research support from Takeda, Shire (a part of Takeda) and Roche. The other authors declare no conflicts of interest.
Provenance and peer review Not commissioned; externally peer reviewed.
Supplemental material This content has been supplied by the author(s). It has not been vetted by BMJ Publishing Group Limited (BMJ) and may not have been peer-reviewed. Any opinions or recommendations discussed are solely those of the author(s) and are not endorsed by BMJ. BMJ disclaims all liability and responsibility arising from any reliance placed on the content. Where the content includes any translated material, BMJ does not warrant the accuracy and reliability of the translations (including but not limited to local regulations, clinical guidelines, terminology, drug names and drug dosages), and is not responsible for any error and/or omissions arising from translation and adaptation or otherwise.