Article Text

Statistics from Altmetric.com
SUMMARY
During the past three decades, prolonged monitoring of oesophageal pH has become increasingly popular among physicians. Most of the studies carried out with this technique focused on oesophageal acid exposure, defined as percentage of time with pH below 4. However, in most cases acid exposure variables are not very useful in the evaluation of patients with symptoms and signs of gastro-oesophageal reflux disease (GORD). An often neglected aspect of 24 hour pH recording is assessment of the temporal relation between reflux and symptoms. Various methods to quantify this relationship were developed. Here, we review these methods and the contribution of symptom association analysis to the evaluation of patients with symptoms suggestive of GORD.
INTRODUCTION
The use of prolonged monitoring of oesophageal pH as a measure of gastro-oesophageal reflux was first described in 1969.1 More than a decade after its introduction as a hospital based technique for inpatients, oesophageal pH monitoring became rather popular when ambulatory data recorders became available.2 Most of the studies carried out with the technique focused on measurement of oesophageal acid exposure, defined as percentage of time with pH below 4, in patients with various manifestations of GORD. Later, the notion emerged that 24 hour pH recording also makes it possible to investigate the temporal relation between reflux and symptoms. In this review, we focus on the contribution of symptom association analysis to the evaluation of patients with symptoms suggestive of GORD and we discuss the various methods for symptom analysis that are currently used.
MEASUREMENT OF OESOPHAGEAL ACID EXPOSURE
Since the introduction of 24 hour oesophageal pH monitoring, numerous parameters have been proposed to provide a quantitative description of a patient’s pH profile. Simple (for example, number of reflux episodes, percentage of time with pH below 4, number of reflux episodes lasting more than five minutes) as well as composite (for example, the DeMeester score) parameters are in use. Of these, the percentage of time with pH below 4 is generally accepted as the most useful.3 Using this parameter, patients can be categorised as having either physiological or pathological (excessive) oesophageal acid exposure. However, several factors limit the usefulness of such a categorisation.
Firstly, significant day to day variation occurs. Wiener et al found that the total per cent of time with pH below 4 varied between two consecutive 24 hour tests by up to a factor of 3.2-fold (218% higher to 69% lower).4 Overall reproducibility for the diagnosis of GORD was 80%, while reproducibility was much lower for patients with an acid exposure time that was borderline physiological or pathological. Data from other studies confirmed these results and although some would consider a reproducibility of 70–80% to be reasonable, most would argue that it is not acceptable that 20–30% of patients will receive a different diagnosis on repeated testing.5–7
Secondly, the published cut off values to distinguish pathological from physiological reflux differ considerably between various studies. For the parameter time with pH <4 in the upright position, values of 4.6–16.0% were published, and for supine reflux, values of 1.2–11.2%.8,9,10,11 Furthermore, a physiological increase in acid exposure time occurs with age.12 These data indicate that distinguishing between pathological and physiological reflux is fraught with a large margin of error.
Once a “diagnosis” of pathological acid exposure has been made, how does this finding relate to reflux symptoms or endoscopic abnormalities? In case of heartburn and regurgitation, a pathological pH profile provides no evidence of whether the patient’s complaints are indeed caused by acid reflux episodes.13 Howard et al found that patients with an abnormal oesophageal acid exposure often lack a positive correlation between symptom occurrence and reflux episodes.14 Klauser et al showed that of several symptoms only heartburn and regurgitation were slightly more frequent in patients with a pathological acid exposure time.15 In addition, a subset of patients with reflux induced heartburn and regurgitation had a “normal” acid exposure time and can therefore not be identified solely on basis of their acid exposure time.16–18 Pathological reflux also appears to be a poor predictor of supraoesophageal symptoms.
Many studies have shown that a high acid exposure time predisposes to erosive reflux disease, and in patients with high degree oesophagitis and Barrett’s oesophagus, almost invariably a pathological pH profile is found.13,19,20 These findings clearly help in our understanding of the pathophysiology of oesophagitis but do not implicate pH monitoring as a useful diagnostic tool. Obviously, ambulatory pH monitoring is not an alternative to endoscopy for assessment of oesophageal mucosal injury.
The importance of determining whether a patient’s reflux is pathological or still within physiological limits has often been overstressed and the presence of pathological reflux does not provide evidence about the cause of the symptoms.21
SYMPTOM-REFLUX ASSOCIATION ANALYSIS
In addition to quantification of a patient’s reflux profile, 24 hour oesophageal pH recording also provides the opportunity to assess the temporal relationship between the occurrence of reflux and the onset of symptoms. In the early days of oesophageal pH monitoring, the patient’s symptoms were recorded by placing marks on the paper of the ink writer. Nowadays, portable digital dataloggers contain event marker buttons to be pressed by the patient when experiencing symptoms. Although the temporal relation between symptoms and reflux can be convincing during visual inspection of the pH tracings, a quantitative measure of such a relationship is desirable.22 In the process of quantification of symptom-reflux associations, several criteria should be accurately defined, such as the criteria for the definition of reflux episodes and the length of the time window after a reflux episode during which a symptom is defined as reflux related.
Reflux episodes
An essential step in the analysis of symptom-reflux association is to identify all reflux episodes that occurred during the measurement period. A reflux episode is usually defined as a drop in pH below 4 that lasts for more than 10 seconds. Reflux preceding the onset of symptoms does not necessarily have to reach values below 4. It has been shown that short pH falls of more than 1 unit but not below 4 do not contribute to time with pH <4, but are also capable of eliciting symptoms.23,24 Thus incorporation of these pH drops in the symptom association analysis is likely to increase its yield.25
Time window
In the early days of analysis of symptom-reflux association, the choice of time window was arbitrary. The aim of a study by Lam et al was to determine the characteristics of the optimal time window. Repetitive symptom association analysis was carried out using time windows of various onsets and durations.26 One of the indices frequently used for symptom analysis, the symptom index (see below), showed a gradual increase for windows with increasingly early time onset, following a pattern that would be predicted on the basis of Poisson’s theory. However, a relatively sharp cut off point was found at the time window starting at two minutes before pain onset and ending at pain onset. The authors concluded that two minute time windows beginning at two minutes before the onset of symptoms are recommended for symptom-reflux association analysis. It should be borne in mind that this study was performed in patients with non-cardiac chest pain, most of whom had reflux as the cause of their symptoms. The two minute time window may not be optimal for the evaluation of other symptoms such as cough.
Methods for symptom analysis
The next question is how to express associations found between reflux and symptoms in a quantitative way. Ward et al were the first to introduce an index to describe the relation between symptoms and reflux.27 They proposed the symptom index (SI), which is defined as the percentage of symptom episodes that are related to reflux:
(Number of reflux related symptom episodes/Total number of symptom episodes) ×100%
The distribution of SIs in a population of patients with heartburn appeared to be bimodal and the result of receiver operating characteristic analysis indicated that the optimal threshold for SI is 50%, but thresholds of 25% and 75% have also been suggested.28,29 The SI and oesophageal acid exposure do not necessarily correlate. It has been shown that a substantial proportion of patients with a positive SI have physiological acid exposure.14 Figure 1 shows examples of 24 hour pH recordings with a positive SI in patients with pathological and physiological reflux, respectively.

(A) Ambulatory 24 hour pH study in a patient with pathological acid exposure (time pH <4 is 17.3%). There were 165 acid reflux episodes. The patient had seven episodes of heartburn, five of which were related to acid reflux and two of which were not. This rendered a symptom index (SI) of 71.4%. In this example, the symptom sensitivity index (SSI) was 3.0% and the symptom association probability (SAP) was 96.5% (these indices will be explained later in the text). (B) Ambulatory 24 hour pH study in a patient with symptoms of heartburn but a physiological acid exposure (time pH <4 is 2.8%). There were 24 reflux episodes. The patient experienced five episodes of heartburn, three of which were acid related which resulted in an SI of 60%. In this example, SSI was 12.5% and SAP was 99.7%.
The major shortcoming of the SI is that this index does not take the total number of reflux episodes into account. The higher the frequency of gastro-oesophageal reflux, the higher the likelihood that a symptom is found to be associated with reflux by chance. Therefore, in patients with frequent gastro-oesophageal reflux who report only one symptom episode during 24 hour pH monitoring, an SI of 100% might well occur by chance.
For this reason the symptom sensitivity index (SSI) was proposed as an additional parameter.30 SSI is defined as:
(Number of symptom associated reflux episodes/Total number of reflux episodes) ×100%
SSI values of 10% or higher are considered to be positive. Calculation of both SI and SSI for one and the same pH monitoring test may yield discordant results. However, conclusions can be drawn from discordant test results. For example, the combination of a high SSI and a low SI indicates that the patient’s oesophagus is sensitive to reflux but causes other than acid reflux are likely to contribute to the symptoms.
Both the SI and SSI suffer from the disadvantage that they do not integrate all factors determining the relationship between symptoms and reflux. As a consequence, the probability that SI becomes positive increases with an increasingly high number of reflux episodes and SSI is more likely to be positive when the number of symptom episodes is high.
The Leuven group introduced the binomial symptom index (BSI), a complex formula that calculates the probability that symptoms are related to reflux episodes by summating a number of partial probabilities.31 Apart from its complexity, BSI suffers from the disadvantage that it only takes into account episodes with a pH drop below 4, whereas it has been shown that drops of more than one pH unit that do not reach a pH of 4 constitute up to one third of the reflux related symptom episodes.24,32
Weusten et al subsequently developed the symptom association probability (SAP), a parameter that expresses the likelihood that the patient’s symptoms are related to reflux.33 It is calculated by dividing 24 hour pH data into consecutive two minute segments. For each of these two minute segments, it is determined whether reflux occurred, providing the total number of two minutes segments with (total R+) and without (total R−) reflux. Then, for each symptom episode, it is determined whether reflux did (S+R+) or did not (S+R−) occur in the preceding two minute period (fig 2). Subtraction of S+R+ from total R+ results in S−R+ and subtraction of S+R− from total R− results in S−R−. A 2×2 contingency table is then constructed in which the number of two minute segments with and without symptoms and with and without reflux are tabulated. Fisher’s exact test is used to calculate the probability (p) that the observed distribution could have been brought about by chance. SAP is calculated as (1−p) × 100%. By statistical convention, SAP ⩾ 95% is positive (fig 3). Manual calculation of SAP is cumbersome and time consuming but automatic calculation of this parameter is easy and fast. It should be borne in mind that SAP is a statistical parameter that quantifies the probability that the observed distribution is not brought about by chance. As with all other statistical tests for association, a statistically significant relationship between two parameters does not necessarily imply causality.

Schematic presentation of the calculation of the symptom association probability (SAP). The recording is divided into two minute segments. In this example, two of these contain a reflux episode. The arrows above the pH signal indicate when the patient pressed the event marker bottom. The first symptom (S) is preceded by acid reflux (R) (that is, S+R+), the second symptom is not (S+R−).
Armstrong et al described a method of symptom association analysis that used the Komolgorov-Smirnov test to compare the frequency distribution of the pH values recorded during symptom episodes with the frequency distribution of the pH values during the rest of the measurement.34 If the two distributions of pH are significantly different, it can be concluded that the patient’s pain is dependent on oesophageal pH. It should be noted however that with this technique the relation between oesophageal pH and symptoms is tested, not the relation between reflux episodes and symptoms. As short pH drops can elicit symptoms but will not have a great effect on pH frequency distributions, the technique is likely to underestimate the impact of short lived reflux episodes. Furthermore, the statistical test involved is not adequately powered if only a few symptoms occur.
Symptom association analysis can also be carried out with the use of receiver operating characteristics.35 Essential to this type of analysis are plots in which on the X axis the number of symptom associated reflux episodes divided by the total number of symptoms (SI) is shown and on the Y axis the number of reflux episodes without heartburn divided by the total number of reflux episodes is displayed. The area under the curve is thus a measure of symptom association. As this method makes use of the SI, it suffers from the disadvantages inherent with this parameter.

Two by two table of the calculation of the symptom association probability (SAP). S, symptom; R, acid reflux.
Practical issues of symptom analysis
Computerised symptom association analysis is incorporated in most commercial ambulatory pH monitoring software. As manual inspection of the tracings can sometimes reveal artefacts that are not identified by the computer, it is strongly recommended that such a visual check is carried out. Furthermore, editing of symptom events by the investigator is useful as patients can indicate on their symptom diary whether they pressed the event marker accidentally or whether the event marker was pressed for symptoms considered irrelevant in the context of 24 hour oesophageal pH testing.
Thorough instruction of the patient is one of the most important prerequisites of a successful 24 hour pH test. It has to be stressed that the patient has to press the event marker button each time a symptom is perceived. A diary on which the patient can fill in the nature of every symptom makes it possible to perform symptom analysis for different symptoms. As a result, a patient can have a positive SI, SSI, and SAP for heartburn, but not for cough, and vice versa. Furthermore, the patient has to be instructed not to reduce his normal daily activity and to consume his usual meals in order to elicit symptoms. Obviously, a 24 hour pH study during which no symptoms occur does not contribute to the evaluation of these symptoms.
CONTRIBUTION TO THE DIAGNOSTIC WORKUP
Before the advent of 24 hour pH monitoring, the relation between symptoms and acid could only be investigated using provocation tests such as the acid perfusion test according to Bernstein and Baker.36 In this test, hydrochloric acid and saline solutions are instilled into the oesophagus of the patient who is blinded for the sequence of instillation. The test is considered to be positive when acid infusion reproduces the patient’s symptoms and saline does not. Several comparative studies showed that oesophageal pH monitoring is superior to provocation testing in identifying the cause of patients’ symptoms.37–40 Discordance between the acid perfusion test and pH monitoring implied that other factors of gastro-oesophageal reflux besides the acidity of the refluxate were responsible for symptom generation. Comparison of the two tests also led to the conclusion that symptomatic gastro-oesophageal reflux, abnormal oesophageal acid exposure, and mucosal acid sensitivity are three separate although related aspects of GORD.14 As illustrated in figs 1 and 4, there is a subset of patients with a normal oesophageal acid exposure time who exhibit a positive temporal association between symptoms and oesophageal acid exposure.22,28,41–43 Whereas in the Rome II classification this frequently encountered condition is classified as functional heartburn, the Rome III consensus will incorporate it into GORD.44
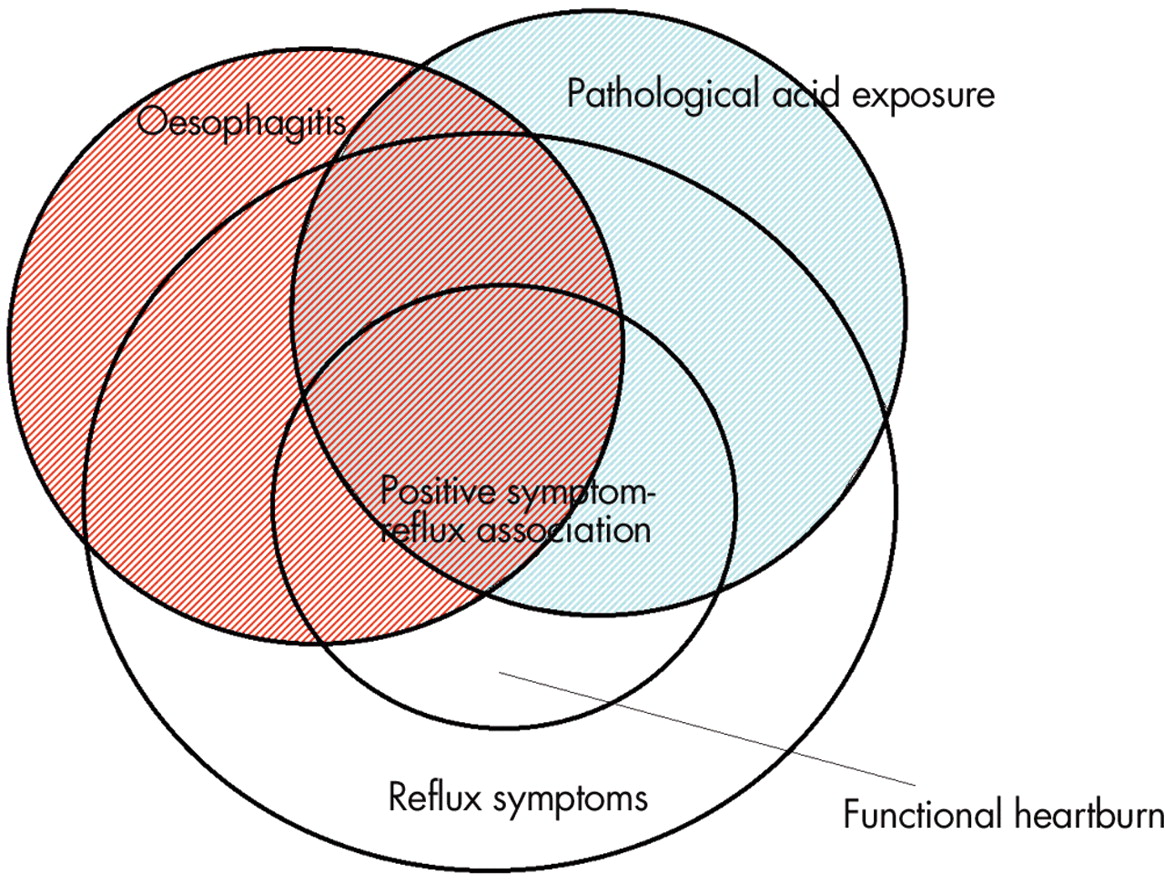
Diagram of the various elements of gastro-oesophageal reflux disease (GORD). When GORD is defined as either mucosal damage and/or symptoms induced by gastro-oesophageal reflux, all GORD patients fall in the circles “oesophagitis” and/or “positive symptom-reflux association”. Patients with symptoms of heartburn and/or regurgitation but no oesophagitis and no relation between symptoms and reflux on pHmetry do not fall under the definition of GORD. Patients who have neither pathological acid exposure nor oesophagitis but do have a positive symptom association are classified by the Rome II criteria as functional heartburn.
Watson et al have shown that in a group of patients with heartburn and regurgitation and physiological oesophageal acid exposure, those with a positive SI showed a considerably better symptomatic response to omeprazole than those with a negative SI, suggesting that SI is a good predictor of response to proton pump inhibitor (PPI) therapy.45 A recent study by Taghavi et al compared the predictive value of symptom association analysis for outcome after a short term treatment with a high dose of omeprazole (PPI test).46 Whereas the positive predictive values of SI, SSI and SAP were high, the negative predictive values were relatively low. This implies that patients may react satisfactorily to treatment with PPIs while there is no demonstrable relation between the onset of their symptoms and reflux. Whereas the authors of this study interpret this finding as imperfection of the association indices, it seems more likely that false positive responses to PPIs played a role. Diaz et al also showed that SAP is a good and independent predictor of the success of antireflux surgery; failure to reach a positive SAP value for the principal symptom reduced the likelihood of responding favourably to antireflux surgery.47 It has also been suggested that patients with physiological acid exposure and a positive SI benefit as much from antireflux surgery as patients with pathological acid exposure.48
Oesophageal pH monitoring is not only used for evaluation of typical oesophageal reflux symptoms such as heartburn and regurgitation, but also for evaluation of atypical reflux symptoms. Whereas the acute onset of heartburn and regurgitation makes it possible to investigate the temporal correlation with reflux events, this is not possible with symptoms lacking a crisp onset, such as globus sensation and hoarseness. In the case of unexplained chronic cough however, symptom association analysis showed a temporal relation between acid reflux and cough in one third of patients.49 Combined oesophageal pH and pressure monitoring makes it possible to distinguish between reflux-cough and cough-reflux sequences, as coughs spells can be recognised manometrically. Making this distinction is important because reflux induced coughing should be treated differently from cough induced reflux.
Studies using symptom association analysis of combined 24 hour pH and pressure signals in patients with non-cardiac chest pain have shown that an oesophageal origin of the pain can be identified in a small subset of patients only.32,50,51 In these patients reflux is the likely cause of the symptoms far more often than oesophageal dysmotility. Despite the relatively low yield of 24 hour pH and pressure monitoring, this investigation is still considered useful as a positive diagnosis contributes significantly to the patient’s well being.52
FUTURE PROSPECTS
Although acid gastro-oesophageal reflux is responsible for symptoms of heartburn and regurgitation in a large proportion of patients, these symptoms sometimes occur without any evidence of acid reflux. Several studies have shown that besides acid, heartburn can also be elicited by hyperosmolar solutions, certain foods, bile acids, oesophageal contractions, and oesophageal distension.53–59
Studies using the Bilitec 2000, a fibreoptic spectrophotometric probe that makes use of the absorbance spectrum of bilirubin for the detection of duodenogastro-oesophageal reflux, showed that reflux of bile can only be held responsible for a minor proportion of symptoms.60,61 Another study calculated that only 7% of patients with GORD had a positive SAP for bile reflux, as detected by the bilirubin absorbance technique, which is 2% above the percentage that is expected to be found by pure chance.62 However, reflux detection using the bilirubin absorbance technique has several limitations. The most important of these is that clearance of material trapped in the probe gap takes much longer than oesophageal clearance of bile. As a consequence, individual reflux episodes cannot be detected with sufficient accuracy. Furthermore, the signal-response relationship of this device is distorted in an acid environment, a situation that often occurs in the oesophagus of patients with GORD.63
Intraluminal impedance monitoring appears to hold much more promise for symptom association analysis. With this technique, movements of liquid and air within the oesophageal lumen, either in an antegrade or retrograde direction, can be monitored. Using impedance monitoring, reflux can be detected independently of the acidity of the refluxate.64 The temporal resolution of reflux detection by intraluminal impedance monitoring is high, which makes it suitable for symptom association studies (fig 5). Using this technique, Vela et al showed that heartburn and regurgitation in patients off acid secretion inhibiting medication were caused by both acid and non-acid reflux, while during acid suppression non-acid reflux was responsible for symptom generation.65 In patients using acid suppression, addition of impedance monitoring to pH monitoring leads to a higher SI, SSI, and SAP.66,67 Preliminary data also suggest that a positive SI for non-acid reflux predicts a good symptomatic response to fundoplication.68

Combined oesophageal pH-impedance measurement. There is a decrease in impedance starting in the most distal impedance segment (arrow) and moving in a proximal direction, indicating liquid reflux. No drop in pH below 4 is measured and thus this episode would not have been identified on pHmetry alone. The symptom event marker (“pain”) is pressed by the patient less than two minutes after the onset of this reflux episode, classifying this symptom as non-acid reflux associated.
As already mentioned, acid reflux can be the cause of chronic cough. A recent study showed that combined pH-impedance monitoring can identify reflux as a causative agent for cough in more patients compared with pH monitoring alone.69
One of the restrictions of 24 hour reflux monitoring is that the frequency of symptoms varies from day to day, which implies that a single 24 hour period may not be representative. Recently, a wireless system for ambulatory pH monitoring has become available. A capsule containing a pH electrode and a radiotransmitter placed in the distal oesophagus transmits data to an external datalogger.70 It appears that pH monitoring carried out with this technique is tolerated better by patients than conventional catheter based pHmetry, and measurement time can therefore be increased. It was shown that 48 hour ambulatory pH monitoring doubles the SI and SAP in patients with atypical reflux symptoms in comparison with 24 hour monitoring.71
Summary
-
Oesophageal acid exposure (% time with pH <4) does not provide information as to whether symptoms are reflux related.
-
Thorough instruction of the patient is pivotal to the success of symptom association analysis.
-
SI describes the proportion of symptoms that are reflux related. SAP describes the probability that the observed relation between symptoms and reflux did not occur by chance.
-
Symptom association analysis can be performed for typical and atypical symptoms with a sudden onset, not for symptoms lacking a crisp onset, such as hoarseness or globus sensation.
-
Patients with a positive relationship between symptoms and reflux are more likely to respond to medical and surgical therapy.
Symptom index (SI)
-
Definition
– Per cent of reflux associated symptom episodes
-
Threshold (positive)
– ⩾50%
-
Advantage
– Simple understandable parameter. Easy to calculate
-
Disadvantage
– Does not take the total number of reflux episodes into account
Symptom sensitivity index (SSI)
-
Definition
– Per cent of symptom associated reflux episodes
-
Threshold (positive)
– ⩾10%
-
Advantage
– Simple understandable parameter. Easy to calculate
-
Disadvantage
– Does not take the total number of symptom episodes into account
Symptom association probability (SAP)
-
Definition
– Calculation of the statistical relationship between symptoms and reflux episodes using Fisher’s exact test
-
Threshold (positive)
– ⩾95%
-
Advantage
– Better insight into relationship between symptoms and reflux. Uses all parameters
-
Disadvantage
– Manual calculation is difficult
CONCLUSIONS
Reflux of gastric content may lead to symptoms and mucosal inflammation. While the latter can be detected endoscopically, symptom-reflux association analysis is the only method that can adequately identify reflux as the cause of short lived symptoms with sudden onset, such as heartburn, regurgitation, chest pain, and cough. Such analysis should therefore be included in every 24 hour pH study evaluating these complaints. Indices that express the strength of the symptom-reflux association numerically, such as the SI and SAP, constitute the most important information that can be obtained from a 24 hour pH study.
Acknowledgments
AJ Bredenoord is supported by a clinical research trainee grant from Janssen Pharmaceuticals, Tilburg, the Netherlands.
REFERENCES
Footnotes
-
Conflict of interest: None declared.