Article Text

Abstract
Objective Colorectal cancer (CRC) screening programmes can reduce CRC mortality. However, the implementation of a screening programme may create or exacerbate socioeconomic and ethnic health inequities if participation varies by subgroup. We determined which organised programmes characterise participation inequities by socioeconomic and ethnic subgroups, and assessed the variation in subgroup participation among programmes collecting group-specific data.
Design Employing a literature review and survey among leaders of national or regional screening programmes, this study identified published and unpublished data on participation by socioeconomic status and ethnicity. We assessed programmes offering faecal occult blood tests (FOBT) for screening. Primary outcome was screening participation rate.
Results Across 24 organised FOBT-screening programmes meeting the inclusion criteria, participation rates ranged from 21% to 73%. Most programmes (13/24, 54%) did not collect data on participation by socioeconomic status and ethnicity. Among the 11 programmes with data on participation by socioeconomic status, 90% (28/31 publications) reported lower participation among lower socioeconomic groups. Differences across socioeconomic gradients were moderate (66% vs 71%) to severe (35% vs 61%). Only six programmes reported participation results by ethnicity. Ethnic differences were moderate, though only limited data were available for evaluation.
Conclusions Across organised CRC screening programmes worldwide, variation in participation by socioeconomic status and ethnicity is often not assessed. However, when measured, marked disparities in participation by socioeconomic status have been observed. Limited data were available to assess inequities by ethnicity. To avoid exacerbating health inequities, screening programmes should systematically monitor participation by socioeconomic status and ethnicity, and investigate and address determinants of low participation.
- CANCER PREVENTION
- COLORECTAL CANCER SCREENING
- COLORECTAL CANCER
Statistics from Altmetric.com
Significance of this study
What is already known on this subject?
Variations in colorectal cancer (CRC) screening participation by socioeconomic status and ethnicity have been observed in few organised programmes, but have not been comprehensively assessed.
What are the new findings?
Fewer than half of organised screening programmes worldwide have measured participation differences by socioeconomic status and/or ethnicity.
When measured, participation differences by socioeconomic subgroups appear to be substantial.
How might it impact on clinical practice in the foreseeable future?
If lower socioeconomic and ethnic subgroups are less likely to participate in screening, CRC screening programme implementation has the potential to create or even exacerbate health inequities within a population.
Organised CRC screening programmes should systematically monitor for variation in participation by socioeconomic status and ethnicity, and implement strategies to ensure equal opportunities for participation.
Introduction
Colorectal cancer (CRC) has a high disease burden worldwide. It is the third most common cancer in men and second most common cancer in women, leading to 694 000 deaths per year.1
Multiple studies show an even higher risk of CRC and higher morbidity and mortality for socioeconomically deprived groups and ethnic minorities.2 ,3 Screening with faecal occult blood tests (FOBT) has proven to be effective in reducing CRC mortality in several randomised controlled trials.4–6 However, the implementation of CRC screening may lead to increased health inequities within the population if participation differs by socioeconomic status and ethnicity.
To reduce the population burden of CRC, international health organisations recommend the implementation of organised screening programmes.7–10 Organised programmes, in contrast to opportunistic programmes, actively invite all individuals in a specific geographical area between certain age limits to take part in a protocol-based screening programme. In other words, each individual is invited, and the invitation does not depend on the initiative of the individual or healthcare workers.11 According to the European guidelines: ‘In order to maximize the impact of the intervention and ensure high coverage and equity of access, only organized screening programs should be implemented as opposed to case-finding or opportunistic screening as only organized programs can be properly quality-assured’.11
Population health benefit from screening depends on achieving high rates of participation. However, in England, where a large-scale, population-based screening programme has been implemented since 2006, marked variations in CRC screening participation have been described. Von Wagner et al12 showed participation rates ranging from 35% in the lowest socioeconomic group to 61% in the highest, and 38% for ethnically diverse compared with 58% in predominantly white areas. Also, in the USA, where opportunistic CRC screening has been promoted for over 15 years, marked differences in rates of participation among socioeconomic status and ethnic minorities exist.13 ,14
If lower socioeconomic and ethnic subgroups have a higher risk of CRC incidence and mortality, and are less likely to participate in screening, the implementation of a CRC screening programme has the potential to create or exacerbate health inequities within a population. To assess and anticipate this risk, the scope of existing inequities must be measured and understood. Outside of England and the USA, only few data on disparities in participation have been published and an overview of available data from organised programmes has not been published.
Accordingly, we aimed to address the following research questions: (1) What proportion of organised CRC screening programmes characterise participation inequities by socioeconomic and ethnic subgroups? (2) What is the variation in subgroup participation among programmes collecting group-specific data?
Methods
To determine the proportion of organised programmes measuring variation in participation by socioeconomic status and/or ethnicity, and characterise results, several strategies were used. We did not perform a systematic review according to the Cochrane criteria15 because that would exclude unpublished data, which were of particular interest and were gathered by the survey described below.
Screening programme selection and inclusion
Existing screening programmes were selected based on information from the WHO and a recently published report by Schreuders et al, summarising existing CRC screening programmes (opportunistic and organised) worldwide.16 ,17 To verify, update and complement this overview, we retrieved details on the organisational characteristics of all screening programmes from national governmental websites and from national contact persons involved in CRC screening programmes. Additionally, we searched MEDLINE for each country of interest, using the terms colorectal cancer, screening and faecal occult blood test.
Based on information both from the literature and from the received questionnaires, screening programmes were included for our summary if they met the following criteria:
‘Organised’, defined by criteria of the International Agency for Research on Cancer and the European Commission: ‘an explicit screening protocol defining a target population (age, geographical area), screening method, screening interval, implemented by a management team, the availability of a health-care team for decisions and care, a quality assurance structure, and a method for identifying cancer occurrence in the target population’.11 ,18 The definition of organised is in contrast to opportunistic screening, in which invitation depends on healthcare provider's or participant's initiative.19
Fully implemented programmes or programmes that are currently in implementation phase, because we aim to identify inequities in established screening programmes.
Primary screening method was FOBT (guaiac or immunochemical).
Literature review on participation by socioeconomic status or ethnicity
To identify published data on participation by socioeconomic status or ethnicity within organised CRC screening programmes, the literature search included all terms for colorectal cancer, screening, faecal occult blood test, various indicators for socioeconomic status and ethnicity. Results were limited to articles from 1995 until 2016 since no population-based, non-opportunistic, CRC screening programme was offered prior to 1995. Online supplementary appendix 1 describes the specific search strategy. Title and abstract of all publications were screened by CK and verified by MEB. Additional publications were identified by examination of the bibliographies of retrieved articles and from suggestions of national contact persons. Publications were included if (1) primary screening was performed with FOBT, (2) implementation of the organised programme was completed or the roll-out was ongoing and (3) participation rates were analysed by some measure of socioeconomic status and/or ethnicity. Data from pilot programmes that have subsequently been fully implemented were included (n=6). Qualitative research was excluded.
supplementary appendix
Questionnaire study
To identify recent, unpublished or expected data on participation by socioeconomic status or ethnicity, we conducted a questionnaire survey among contact persons involved in CRC screening programmes. These contact persons were identified through the Screening Committee of the World Endoscopy Organization (WEO), as well as through our professional network. As noted below, in some cases, contact persons were unable to provide programme data that met inclusion criteria.
The questionnaire was composed by CK and MEB. Contact persons were asked to report programme characteristics (pilot/roll-out ongoing/completion and opportunistic/organised), whether data on participation by socioeconomic status or ethnicity were available and, if available, rates of participation stratified by socioeconomic status and/or ethnicity. The approach to measuring socioeconomic status and/or ethnicity was also collected. The original survey was updated to include two additional questions about organisational aspects of screening programmes after circulation. The final survey is shown in online supplementary appendix 2.
supplementary appendix
Data abstraction and summary
From published reports and surveys we abstracted, for each programme meeting inclusion criteria: contact strategy, implementation status and primary screening strategy (guaiac faecal occult blood test (gFOBT) or faecal immunochemical test (FIT)).
We had two primary outcomes of interest. First, we characterised the proportion of programmes measuring subgroup-specific screening participation, based on either a measure of socioeconomic status or ethnicity. Second, among programmes reporting subgroup-specific participation, we characterised the range of participation rates reported by socioeconomic status and ethnicity. If, in one publication, participation rates on more than one socioeconomic indicator were reported, these were reported as separate ‘findings’. Five socioeconomic indicators appeared: education, income, occupation, insurance or a ‘deprivation index’ that combines different indicators as proxy for socioeconomic status. Race and ethnicity were variably reported across programmes, and hereafter is referred to as ethnicity for ease of presentation. The screening participation is presented as a rounded percentage, unless only ORs were available.
Assurance from contact persons that participation by socioeconomic status or ethnicity has not been analysed in their country (not studied) or is currently being analysed (in progress) was distinguished from the absence of response to our query (no information). Formal quality assessment of included publications was not performed given the general lack of literature in this area. Quality of data abstraction was optimised by verifying results with contact persons providing data and with members of the WEO Expert Working Group on inequities in CRC screening.
Results
Organised screening programmes: survey results
Contact persons from 26 out of 34 countries responded (76%). Twenty-four screening programmes met our inclusion criteria (table 1). Other programmes were opportunistic, still in pilot phase or did not use FOBT as the primary screening method.
Participation rates by socioeconomic status (SES) in organised colorectal screening programmes
All programmes invite eligible individuals by postal mail. Most programmes (19/24, 79%) have fully implemented screening. The other programmes (5/24, 21%) are currently being rolled out and are expected to be fully implemented within 5 years. FIT is currently the most commonly used FOBT-based screening method (18 out of 24 programmes, 75%), gFOBT is used in the other 6 out of 24 programmes and has been used in other programmes before the introduction of FIT. Programmes in England and Scotland are currently planning to switch from gFOBT to FIT.
Literature results
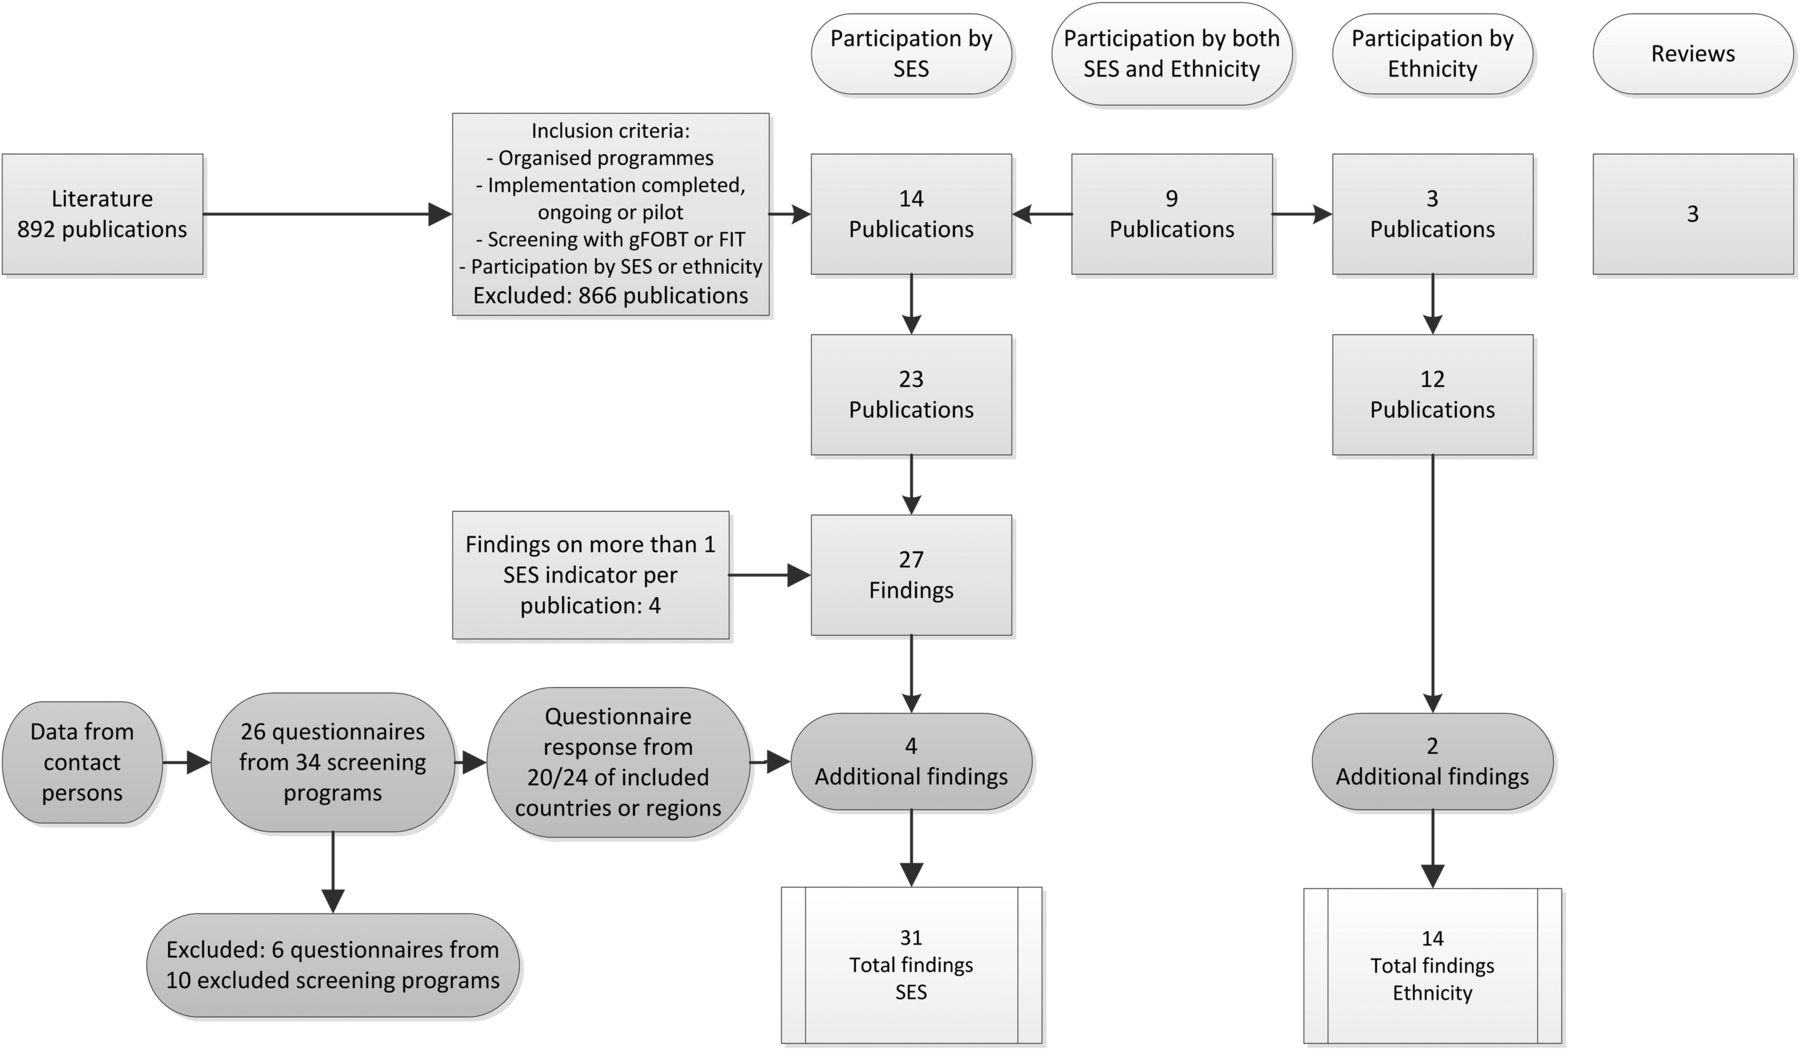
A total of 26 publications were identified that met the inclusion criteria (figure 1): 14 publications reported participation by socioeconomic status,20–33 3 publications reported participation by ethnicity34–36 and 9 publications reported results by both socioeconomic status and ethnicity.12 ,37–44 Three reviews were identified that gathered literature on differences in participation by socioeconomic status and ethnicity, these were however not limited to organised programmes and screening with FOBT.45–47 Six studies were conducted in pilot programmes for screening, in countries or regions that now have an established organised programme.28 ,30 ,34 ,35 ,39 ,43

Literature results. ‘Findings’: numerical outcome on participation per socioeconomic indicator or ethnicity from either a published study or from contact person received unpublished information. FIT, faecal immunochemical test; gFOBT, guaiac faecal occult blood test; SES, socioeconomic status.
Participation by socioeconomic status
Programmes characterising participation by socioeconomic subgroups
A total of 23 publications from eight different screening programmes reported on screening participation stratified by socioeconomic status were included for analysis (figure 1 and table 1). Most of these publications were based on research conducted in the UK (13/23=57%), of which 12 were from England and 1 was from Scotland. Canada-Manitoba, Canada-Ontario, Denmark, France, Italy, South Korea and Spain (Basque region) were also represented. From contact persons, additional data were received from three programmes: Australia, Slovenia and Spain (Barcelona region). The majority of the programmes (n=13) did not have data on participation by socioeconomic status available. Five programmes without available data reported plans to conduct analyses of participation stratified by socioeconomic status.
Socioeconomic indicators
Marked variation in approach to measurement of socioeconomic status was noted. Most used a type of ‘deprivation index’. In four publications, findings on more than one indicator were used to assess socioeconomic status Overall, 31 different findings of participation stratified by socioeconomic indicators were identified (figure 1).
Participation differences
In 28 out of 31 findings, a statistically significant association of lower socioeconomic status with lower participation in organised CRC screening was founded. Table 2 lists results and socioeconomic participation differences per programme.
Participation rates by ethnicity/race in organised colorectal screening programmes
Increased deprivation was associated with lower participation in 13 out of 15 findings. In the UK, these deprivation data were completely consistent (10/10 publications demonstrated lower participation in lower socioeconomic groups). Two findings from Spain (Basque and Barcelona region) showed highest participation rates in middle classes of deprivation, but the observed differences were not large (range 66%–72%)23 (and unpublished findings). In the seven findings using income level and/or economic difficulties, lower income and greater economic burden were associated with lower participation. The largest difference for low versus high income was 42% versus 66%.41 Participation was stratified by occupation in two studies. An Italian study demonstrated higher participation among invitees doing non-manual work than invitees doing manual work.28 A study from the UK showed higher participation rates for invitees with managerial work compared with the lowest grade work or unemployment (59% vs 74%).44 A study from South Korea stratified participation rates by insurance status, and found lower participation rates among invitees with lower socioeconomic status (medical aid beneficiaries) compared with higher socioeconomic status (national insurance).25 Education as indicator for socioeconomic status was used in five studies. In all except one, lower education was associated with lower participation rates. The exception, an Italian study, showed that invitees with academic education had an OR of 0.65 of participating in CRC screening, compared with invitees with non-school or elementary school. Translating the OR to percentages showed a 28% participation rate for the highly educated compared with 32% the less educated invitees.38
Overall, the ability to compare results across studies is limited because of variation in socioeconomic indicators used, summary measurement used and programme characteristics. However, we observed that participation differences by socioeconomic status ranged from small (66% vs 71%) to large (35% vs 61%) among those with high, compared with low socioeconomic status.
Participation by ethnicity/race
In 6 out of 24 organised programmes, data on participation by ethnicity were available through 12 publications and two survey responses. Thus, 18 organised programmes did not have any participation results by ethnicity available. Table 2 lists the results and ethnic participation differences per programme. Most published of these studies were from the UK (8/12, 67%). One publication on participation by ethnicity was from Denmark and the Netherlands, and two were from Italy. Unpublished findings were received from Slovenia and the USA (Kaiser Permanente).
Ethnic groups evaluated across studies were variable. Reported results on ethnic inequities in participation were not always statistically significant and in some cases confounding was present or was not reported in adequate detail.
Discussion
We found that less than half of the organised screening programmes characterise participation inequities by socioeconomic and/or ethnic subgroups. When inequities are assessed by socioeconomic status, substantial variation by subgroups exists, with moderate-to-severe observable differences for individuals with low compared with high socioeconomic status. These inequities may lead to a paradoxical outcome, in which a CRC screening programme, intended to improve population health, may exacerbate health inequities within the population. We found that inequities in participation by ethnicity may also exist, but limited data are available to assess differences across organised programmes worldwide.
Three reviews on participation in all types of CRC screening programmes (organised and opportunistic) confirm the gradient in participation by socioeconomic status that we found.45–47 Multiple studies on variation in participation by socioeconomic status and/or ethnicity have been reported from the USA, where most screening is opportunistic. For example, the National Health Interview Survey has reported lower rates of screening participation for individuals with low versus high education (45% vs 67%), recent immigrants versus those born in the USA (21% vs 67%) and across racial/ethnic groups (55% for African-Americans, 50% for Asians and 47% for Hispanics, compared with 60% among whites).50 Similarly, within the US Medicare insurance programme mainly focused on individuals 65 years and older, differences by income and education have been noted.51 When correcting for educational and income level, ethnic and racial uptake differences disappeared in this cohort.52
Within our analyses, there were a few exceptions to our overall observation of an association between lower socioeconomic status and lower screening participation. An Italian study demonstrated an OR of 0.65 for invitees with an academic education degree compared with invitees with elementary school education or no education.38 Overall CRC screening coverage in this regional programme was low (38%) and participation differences were small, ranging from 28% to 32%. In addition, results may be influenced by the fact that during the study period an opportunistic screening option was also available in which 11% of participants had an academic degree compared with 5% with none or elementary education. We cannot conclude that the Italian programme deviates from our main conclusion since a second conclusion of the same study, within the same screening region, shows lower participation among invitees with more economic difficulties. Moreover, another study from Italy demonstrated that 40% of screening participants had a high level of education compared with only 16% in non-participants.28 Spanish results show the highest screening uptake rates among middle classes of socioeconomic status, ranging from 66% to 72%.23 However, in this cohort, a free opportunistic screening option with colonoscopy was available for all privately insured, which might explain lower participation among higher classes of socioeconomic status. In summary, in contrasting evidence favouring lower socioeconomic status, participation differences were marginal with no more than 5% participation difference. Concurrently available opportunistic screening among the privately insured may at least partially explain this deviating result.
Notably, we found marked variation in approach to measurement of potential participation differences by socioeconomic status or race/ethnicity. Furthermore, variation in the summary measures used to report participation differences (eg, absolute percentage participation, ORs) was also noted across programmes. To enhance comparability, we recommend absolute percentage participation be the minimum metric reported since it is simple and gives a general idea of variation, though this admittedly still does not take into account population differences and other confounders.
A lack of systematic data collection on participation by socioeconomic status or ethnicity may be explained by several factors. First, most organised screening programmes have only recently been established, and therefore data on participation by socioeconomic status or ethnicity might currently be not yet available but might be in the near future. A more worrisome explanation for the lack of data is a possible lack of awareness of the potential risk of increasing health inequities within a population through unequal access to screening and thereby unequal chance of health benefit. Some programmes may erroneously assume that a uniform invitation strategy guarantees equal access to screening. However, different population subgroups may have different informational needs. This implies that, in case of unequal information needs, different and targeted information strategies may be required to provide equal access to screening.53
Interventions to increase CRC screening uptake have been studied widely.54–58 Less research is undertaken on interventions to reduce socioeconomic or ethnic inequities within organised screening programmes or simulated ‘organised’ settings, and best approaches are unclear. Prior work has included evaluation of four major strategies: reminder letters, tailored information materials, one-to-one or group education and financial support. For example, Wardle et al showed that implementing an enhanced reminder letter in England's CRC screening programme increased participation, with stronger effect in the most deprived quintile. Within this study, tailored information material interventions such as summarising leaflets, narrative leaflets with ‘people's stories’ and endorsement letters did however not influence screening participation by socioeconomic gradient.59 McGregor et al concluded the same ineffectiveness on socioeconomic uptake with the implementation of an additional narrative leaflet containing ‘individual experienced screening stories’.60 Also, implementation intentions added to the existing information leaflet,61 and materials tailored to preferred tone,62 or cultural preferences63 have been studied, with limited impact on screening. Education has been studied by multiple groups. For example, together with motivational interviewing techniques, Coronado et al64 found that one-to-one education increased screening rates among Hispanics in the USA. Among African-Americans in the USA not up to date with screening, group education was found to be superior to one-to-one education.65 Telephone counselling combined with a brochure increased screening in a Latino and Vietnamese population.66 Financial incentives have undergone some evaluation. One randomised trial found offering small financial incentives had no impact on system level outreach offering FIT,67 while another found removing out-of-pocket costs for screening also had no impact on screening in an African-American population.65 Online supplementary appendix 3 provides an overview of the described examples. A complete review of all prior interventions to address socioeconomic and ethnic inequities in screening is ongoing, and beyond scope of this discussion. However, available research suggests that much work needs to be done to develop, test and identify the best strategies for avoiding inequities in CRC screening.
supplementary appendix
A few limitations should be considered when interpreting this report. First, we compiled data across a range of programmes, and from both published and unpublished sources. Therefore, we can only offer a qualitative assessment of inequities that may exist. In the future, more rigorous analyses might be possible if (1) programmes consistently measure participation differences by socioeconomic status and ethnicity, and (2) report outcomes using at least one common metric, such as absolute proportion screened. Second, in this analysis we used screening participation as the primary outcome. We recognise that this is a surrogate marker of inequities within screening and an even more surrogate marker of inequities within CRC-related morbidity and mortality. Furthermore, we may argue that the ideal goal is not equal screening participation rates, but rather to offer an equal chance of benefit from screening based on an informed choice.53 However, measuring informed choice on a population level is challenging, and may not be feasible on a wide scale; thus, monitoring participation rates may be the best surrogate for monitoring the development of inequities in screening. Third, our survey sample was a sample of contacts established through the WEO and our own professional network; therefore, we cannot guarantee that all relevant unpublished data have been included within this work.
In conclusion, we found fewer than half of screening programmes monitor for inequities in screening participation by socioeconomic status and/or ethnicity. When measured, available data suggest that marked differences based on socioeconomic status and/or ethnicity may exist. In particular, available data suggest that the implementation of CRC screening programmes may lead to widening of cancer morbidity and mortality outcome for low socioeconomic groups because we found a strong participation gradient by socioeconomic status. To prevent widening of health inequities, CRC screening programmes should strive to systematically monitor the development of inequities in participation by socioeconomic status and ethnicity, and consider strategies to avoid introducing inequities as part of programme design. Future work should focus on interventions to ensure that the chances of benefit from organised screening programmes are equitable across the population.
Acknowledgments
The authors thank Natasa Antoljak, Nadir Arber, Bernard Badley, Robert Benamouzig, Andrea Buron, Toni Castells, Bronwen McCurdy, Mario Dinis Ribeiro, Miriam Elfström, Julia Gao, Ubaldo Gualdrini, Sunna Guðlaugsdóttir, Sarah Hoeck, Iben Holten, Tatjana Kofol, Nela Malila, Elena Martinez, Takahisa Matsuda, Folasade May, Han Mo Chiu, Ronald Myers, Louise Olsson, Susan Parry, Michael Potter, Linda Rabeneck, Colin Rees, Carlo Senore, Harminder Singh, Mehta Shivan, Christian von Wagner and Graeme Young for their response and data input to our survey. We thank Beverly Green, Frank Kallenberg, Peter Liang, Carlo Senore, Jasper Vleugels and Christian von Wagner for their comments on the manuscript. We also thank the Colorectal Cancer Screening Committee of the World Endoscopy Organization, which generously provided support for the expert working party ‘Coalition to reduce inequities in colorectal cancer screening’ which provided a forum for helping to develop and implement this work.
References
Footnotes
Essink-Bot died on May 2016.
Contributors All authors have contributed to this article in the following way: substantial contributions to the conception or design of the work, or the acquisition, analysis or interpretation of data. Drafting the work or revising it critically for important intellectual content. Final approval of the manuscript. Agreement to be accountable for all aspects of the work in ensuring that questions related to the accuracy or integrity of any part of the work are appropriately investigated and resolved. All authors: conception and design, data analysis and interpretation, critical revision of the manuscript, supervision; CMdK and MLE-B: data acquisition; CMdK: drafting the manuscript.
Competing interests None declared.
Provenance and peer review Not commissioned; externally peer reviewed.
Data sharing statement On request, we are willing to consider data sharing.