Article Text

Abstract
Background: The concept of CpG island methylator phenotype (CIMP) is not universally accepted. Even if specific clinicopathological features have been associated with CIMP, investigators often failed to demonstrate a bimodal distribution of the number of methylated markers, which would suggest CIMP as a distinct subtype of colorectal cancer. Previous studies primarily used methylation specific polymerase chain reaction which might detect biologically insignificant low levels of methylation.
Aim: To demonstrate a distinct genetic profile of CIMP colorectal cancer using quantitative DNA methylation analysis that can distinguish high from low levels of DNA methylation.
Materials and methods: We developed quantitative real time polymerase chain reaction (MethyLight) assays and measured DNA methylation (percentage of methylated reference) of five carefully selected loci (promoters of CACNA1G, CDKN2A (p16), CRABP1, MLH1, and NEUROG1) in 460 colorectal cancers from large prospective cohorts.
Results: There was a clear bimodal distribution of 80 microsatellite instability-high (MSI-H) tumours according to the number of methylated promoters, with no tumours showing 3/5 methylated loci. Thus we defined CIMP as having ⩾4/5 methylated loci, and 17% (78) of the 460 tumours were classified as CIMP. CIMP was significantly associated with female sex, MSI, BRAF mutations, and wild-type KRAS. Both CIMP MSI-H tumours and CIMP microsatellite stable (MSS) tumours showed much higher frequencies of BRAF mutations (63% and 54%) than non-CIMP counterparts (non-CIMP MSI-H (0%, p<10−5) and non-CIMP MSS tumours (6.6%, p<10−4), respectively).
Conclusion: CIMP is best characterised by quantitative DNA methylation analysis. CIMP is a distinct epigenotype of colorectal cancer and may be less frequent than previously reported.
- CIMP, CpG island methylator phenotype
- MSI, microsatellite instability
- MSI-H, microsatellite instability-high
- MSI-L, microsatellite instability-low
- MSP, methylation specific PCR
- MSS, microsatellite stable
- PCR, polymerase chain reaction
- PMR, percentage of methylated reference
- WGA, whole genome amplification
- colon cancer
- epigenetics
- hypermethylation
- real time polymerase chain reaction
- methylight
Statistics from Altmetric.com
- CIMP, CpG island methylator phenotype
- MSI, microsatellite instability
- MSI-H, microsatellite instability-high
- MSI-L, microsatellite instability-low
- MSP, methylation specific PCR
- MSS, microsatellite stable
- PCR, polymerase chain reaction
- PMR, percentage of methylated reference
- WGA, whole genome amplification
Transcriptional inactivation by cytosine methylation at promoter CpG islands of tumour suppressor genes is thought to be an important mechanism in human carcinogenesis.1 A number of tumour suppressor genes, including CDKN2A (the p16 gene), MGMT, MLH1, etc, are silenced by promoter methylation in colorectal cancer.2–4 CpG island methylation has been found in colorectal adenomas, and is considered to be an early event in colorectal carcinogenesis.5–8 CpG island methylator phenotype (CIMP) is considered to be a characteristic feature for the serrated pathway of colorectal tumorigenesis.9 A subset of colorectal cancers have been shown to exhibit promoter methylation in multiple genes, referred to as CIMP.4,10–13 CIMP colorectal tumours appear to have a distinct profile, including proximal tumour location and higher BRAF and lower TP53 mutation rates.10–18 Higher KRAS mutation rates in CIMP tumours were observed in some studies13,15 while others showed lower KRAS mutation frequencies in CIMP tumours.11,16,17 These discrepant results are likely due to lack of uniform methylation detection methods, a panel of markers for CIMP, and criteria for CIMP, emphasising the importance of carefully evaluated methylation detection methods and criteria for CIMP, based on biological relevance.
In contrast with the high degree of microsatellite instability (MSI-H) that has been established as a distinct biological subtype of colorectal cancer,19 controversies exist as to whether CIMP represents a distinct subtype of colorectal cancer. Published data have been conflicting on whether there exists a true bimodal distribution of colorectal cancer (in which CIMP tumours could easily be identified) according to the number of methylated loci or whether CIMP is merely within a spectrum of the predicted distribution of multiple stochastic and random methylation events.20,21 Although a number of clinicopathological features have been associated with CIMP in colon cancer,10–15 previous studies have not been able to demonstrate a clear bimodal distribution of the number of methylated loci. Moreover, the case numbers in some studies were small and most studies were not population based. The importance of population based studies, particularly prospective cohort studies, cannot be overemphasised to avoid obvious sources of bias. One study using large retrospective cohorts supports CIMP as a distinct phenotype based on unique clinicopathological associations.15 However, no study on a large prospective cohort has been performed to characterise CIMP in colorectal cancer.
In addition to the issues in study subjects, previous studies primarily used methylation specific polymerase chain reaction (MSP) based assays. MSP typically gives only qualitative (yes or no) results. Because of the qualitative nature of the assay, MSP cannot reliably distinguish low levels of methylation from high levels of methylation, and does not appear to be always reproducible for samples that may have low levels of methylation. By quantitative DNA methylation analysis, we have previously shown that most colorectal cancers with low levels of methylation in CDKN2A (p16), MGMT, or MLH1 do not silence corresponding gene expression.22 MSP may give positive results for tumours with such low levels of methylation with little or no biological significance. Studies based on results by MSP might overestimate the frequency of CIMP in colorectal cancer, and any associations of CIMP with clinical and pathological features might be obscured by misclassified tumours. Hence quantitative measurement of DNA methylation is important in cancer research.4,23
A variety of quantitative assays to measure DNA methylation in tumour tissue have been developed, including real time polymerase chain reaction (PCR) based assays.24–29 In this study, using quantitative real time PCR assay (MethyLight) for five carefully selected gene promoters, we show a distinct genetic profile of CIMP colorectal cancer. Our data indicate that CIMP is best characterised by quantitative DNA methylation analysis.
MATERIALS AND METHODS
Prospective cohort studies and tissue samples
We utilised two large prospective cohort studies, the Nurses’ Health Study and Health Professional Follow up Study (n = 121 700 and n = 51 529 when the studies started in 1976 and 1986, respectively).30,31 Informed consent from all cohort participants was obtained prior to the study. All colorectal cancers developed during the prospective follow up of these cohorts. We exclude previously treated tumours. Tumours were selected, based on availability of adequate tumour tissue materials and assay results at the time of this study, resulting in inclusion of a total of 460 colorectal cancer cases. Tissue collection and analysis in this study were approved by the institutional review boards.
Genomic DNA extraction and whole genome amplification (WGA)
For DNA extraction, haematoxylin-eosin stained slides of the tumours were reviewed and areas of tumour were marked in order to exclude pure normal tissue and enrich tumour DNA. Normal DNA was obtained from normal colorectal tissue at resection margins. Genomic DNA was extracted using QIAmp DNA Mini Kit (Qiagen, Valencia, California, USA). WGA of genomic DNA was performed for genetic analysis. For WGA, genomic DNA was PCR amplified using random 15-mer primers.32 Procedures for WGA were validated as previously described.33
Selection of a panel of gene promoters for determination of CIMP
CIMP in colon cancer was first described by Toyota and colleagues,12 who identified CDKN2A (p16), MLH1, and a number of hypermethylated genomic DNA fragments (MINTs) as specifically methylated in CIMP tumours. We previously tested MethyLight assays on 195 unique gene promoter regions on normal colorectal and tumour DNA samples, and found that CACNA1G, CRABP1, and NEUROG1 were among the most predictive markers for CIMP status (unpublished data). Here we assembled a panel of five CIMP specific markers, including these three markers, as well as CDKN2A and MLH1, both of which were also good predictors of CIMP status. Finally, MGMT was also evaluated in this study because of its functional importance.34 All of these genes showed frequent promoter hypermethylation in cancerous tissue and infrequent low levels of methylation in normal colonic mucosa.
Quantitative real time PCR to measure DNA methylation (MethyLight)
Sodium bisulfite treatment on genomic DNA was performed as described previously.22 Real time PCR to measure DNA methylation (MethyLight) was performed as previously described.22,24,26,27 We used ABI 7300 (Applied Biosystems, Foster City, California, USA) for quantitative real time PCR. Briefly, using six sets of primers and probes, we amplified promoters of five genes of interest (including CACNA1G,35CDKN2A, CRABP1, MLH1, and NEUROG1) and COL2A1 (the collagen 2A1 gene) to normalise for the amount of input bisulfite converted DNA. Primers and probes for CDKN2A, MLH1, MGMT and COL2A1 have been described previously.22,27 Other primers and probes were as follows: CACNA1G forward primer 5′-ttt ttt cgt ttc gcg ttt agg t-3′, CACNA1G reverse primer 5′-ctc gaa acg act tcg ccg-3′, CACNA1G probe 6FAM-5′-aaa taa cgc cga atc cga caa ccg a-3′-BHQ, CRABP1 forward primer 5′-tcg aaa ttt tcg ttg ttg cgt-3′, CRABP1 reverse primer 5′-tat ccg tac cta ccg ccg c-3′, CRABP1 probe 6FAM-5′-acc ata ccc aac ttc gcc gac acc taa-3′-BHQ, NEUROG1 forward primer 5′-cgt gta gcg ttc ggg tat ttg ta-3′, NEUROG1 reverse primer 5′-cga taa tta cga aca cac tcc gaa t-3′, and NEUROG1 probe 6FAM-cga taa cga cct ccc gcg aac ata aa-3′-BHQ1. The percentage of methylated reference (PMR)36 at a specific locus was calculated by dividing the GENE:COL2A1 ratio of a sample by the GENE:COL2A1 ratio of M SssI treated human genomic DNA (presumably fully methylated) and multiplying by 100. We used a PMR cut off of 4 to distinguish methylation positive (PMR >4) from negative (PMR ⩽4). The PMR cut off of 4 has been previously validated.22,24,26,27,36,37 Precision and performance characteristics of sodium bisulfite conversion and subsequent MethyLight assays have been evaluated previously and the assays have been validated.22 Our data of distributions of PMR values in each of the gene promoters (CACNA1G, CDKN2A, CRABP1, MLH1, and NEUROG1) also support a PMR cut off of 4 (table 1) in that there were only rare cases with PMR values between 3 and 5. Furthermore, we have shown that methylation positivity in CDKN2A and MLH1 determined by the PMR cut off of 4 was highly correlated with loss of respective protein expression (p⩽10−17).22
Microsatellite instability (MSI) analysis
Methods to determine MSI have been described previously.38 In addition to the recommended MSI panel consisting of D2S123, D5S346, D17S250, BAT25, and BAT26,39 we used BAT40, D18S55, D18S56, D18S67, and D18S487 (that is, 10 marker panel).38 PCR and DNA fragment analysis for all of the markers except for D2S123, D5S346, and D17S250, was performed in duplicate. “High degree of MSI” (MSI-H) was defined as having instability in 30% or more of the markers. “MSI-low (MSI-L)” was defined as having instability in less than 30% of the markers, and “microsatellite stability (MSS)” as having no unstable marker.
Sequencing of KRAS and BRAF
Methods of PCR and sequencing targeted for KRAS codons 12 and 13, and BRAF codon 600 have been previously described.40 All forward sequencing results were confirmed by reverse sequencing. KRAS sequencing was validated by Pyrosequencing technology, as previously described.33
Statistical analysis
For statistical analysis, Fisher’s exact test was performed on categorical data using the SAS program (version 9.1; SAS Institute, Cary, North Carolina, USA). All p values were two sided.
RESULTS
CpG island methylator phenotype (CIMP) determined by MethyLight assay
Figure 1 shows the distributions of the number of methylated loci among the 460 colorectal cancers. When CIMP was defined as having four or more (of the five) methylated loci, 78 (17%) of the 460 tumours were classified as CIMP positive. CIMP was more frequent in colorectal cancers among women (20%) than men (12%, p = 0.02) (table 2).
We evaluated sensitivity and specificity of each one of the five markers and MGMT for determination of overall CIMP status. A marker with low sensitivity and specificity would not be a good predictor of CIMP status and it would be better to exclude it from the CIMP panel. When CIMP was defined as having ⩾4 methylated loci (of the six loci including MGMT), 94 tumours (20%) were CIMP. For this CIMP definition, all markers except for MGMT showed high (>85%) sensitivity and/or specificity (see appendix). MGMT showed the lowest sensitivity (62%) and the lowest specificity (66%). Thus all markers except for MGMT were good predictors of CIMP status. When CIMP was defined as having ⩾4 methylated loci (of the five loci excluding MGMT), all five markers showed very high (>90%) sensitivity and/or specificity, validating our five marker CIMP panel (see appendix). We used the five marker CIMP panel, without MGMT, for further analysis.
Microsatellite instability (MSI) and CIMP
We determined distributions of the number of methylated loci among MSI-H, MSI-L, and MSS tumours (table 3). Among MSI-H tumours, there was a bimodal distribution with two peaks at 0/5 and 5/5 markers methylated, and no MSI-H tumours showed three markers methylated (fig 1), indicating the presence of two distinct tumour types among MSI-H tumours. CIMP tumours represented 73% of MSI-H tumours, compared with only 3.9% of MSS tumours (p<10−37) and 11% of MSI-L tumours (p<10−12).
KRAS and BRAF mutations, MSI, and CIMP
We examined KRAS and BRAF mutations and CIMP status. No tumour had mutations in both KRAS and BRAF. Thus tumours were subtyped into three groups: KRAS mutant/BRAF wild-type; KRAS wild-type/BRAF mutant; and KRAS wild-type/BRAF wild-type. Tumours with BRAF mutations showed a single dominant peak at 5/5 methylated loci (table 4). CIMP was significantly more common in BRAF mutated tumours (68%) than in BRAF wild-type tumours, regardless of KRAS status (5.2–12%; p<10−16). Among BRAF wild-type tumours, CIMP was significantly less frequent in KRAS mutated tumours (5.2%) than in KRAS wild-type tumours (12%; p = 0.05), indicating an inverse association of KRAS mutation and CIMP. Distributions of the number of methylated loci were similar when KRAS mutated tumours were divided into codon 12 mutants and codon 13 mutants, and into G>A mutants and non-G>A mutants (data not shown).
We also examined KRAS mutation frequencies among the tumours with 4/5 to 5/5 methylated loci, tumours with 1/5 to 3/5 methylated loci (maybe called “CIMP-low”), and tumours with 0/5 methylated loci. The 1/5–3/5 methylated tumours had a higher frequency of KRAS mutations (48% = 68/142) than the 0/5 methylated tumours (35% = 59/171; p = 0.02) and the 4/5–5/5 methylated tumours (9.6% = 7/73; p<10−8). In addition, the 1/5–3/5 methylated tumours had a higher frequency of BRAF mutations (11% = 15/142) than the 0/5 methylated tumours (2.9% = 5/171; p = 0.009).
We examined how status of MSI and KRAS/BRAF changed the distributions of the number of methylated loci. Remarkably, all (100%) 34 MSI-H tumours with BRAF mutations showed ⩾4/5 methylated loci (table 5). Among MSI-H tumours, there were statistically significant differences (all p<0.04) in the frequencies of CIMP between KRAS mutated tumours, BRAF mutated tumours, and tumours with both wild-type KRAS and BRAF. Again, KRAS mutation was inversely associated with CIMP. Among MSS tumours, BRAF mutant tumours showed significantly higher frequencies of CIMP (29%) than BRAF wild-type tumours, regardless of KRAS status (1.5–3.6%; p<0.001) (table 5).
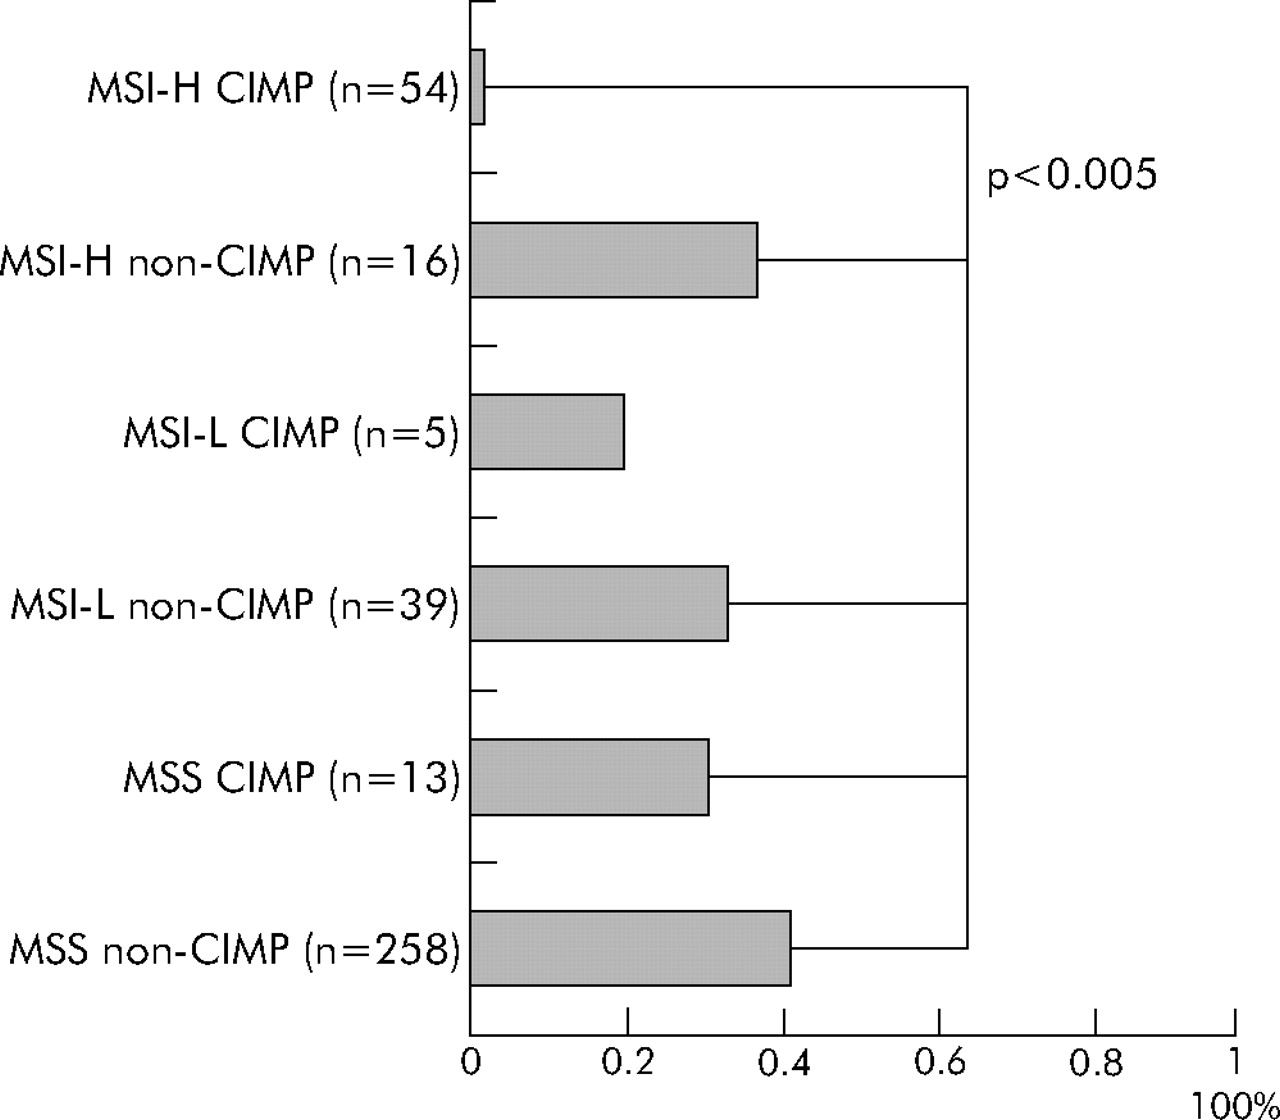
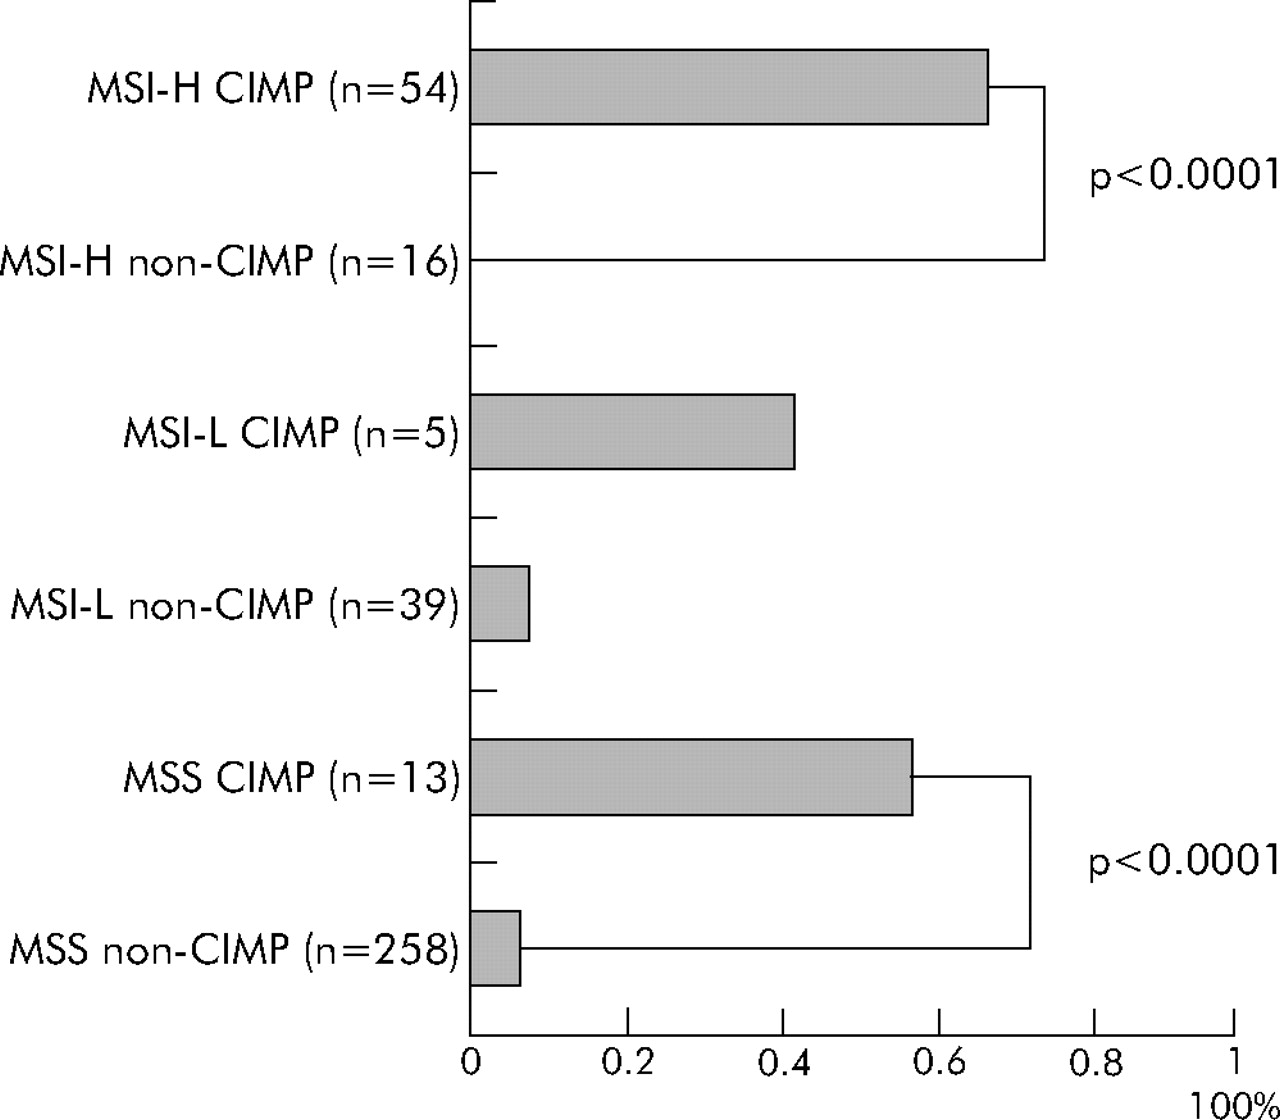
Finally, we classified tumours into six subtypes (CIMP MSI-H, CIMP MSI-L, CIMP MSS, non-CIMP MSI-H, non-CIMP MSI-L, and non-CIMP MSS). It is quite evident that CIMP tumours had a distinct genetic profile even within MSI-H tumours and within MSS tumours. Regardless of MSI status, CIMP tumours showed high BRAF mutation rates (fig 2). CIMP tumours showed a very low KRAS mutation rate only when tumours were also MSI-H (fig 3). MSI-H CIMP tumours were characterised by a high frequency of BRAF mutations (34/54 = 63%) and a low frequency of KRAS mutations (1/54 = only 1.9%) while MSI-H non-CIMP tumours had a low frequency of BRAF mutations (0/16 = 0%; p<10−5) and a high frequency of KRAS mutations (6/16 = 38%; p<0.001). MSS CIMP tumours showed a higher frequency of BRAF mutations (7/13 = 54%) and a lower frequency of both wild-type KRAS and BRAF (2/13 = 15%) than MSS non-CIMP tumours (17/258 = 6.6% BRAF mutation frequency, p<0.0001; and 133/258 = 52% frequency of both wild-types, p = 0.02, respectively).
DISCUSSION
We conducted this study to show a distinct genetic profile of colorectal cancer with CpG island methylator phenotype (CIMP). Using quantitative DNA methylation analysis, we have shown a clear bimodal distribution of 80 MSI-H tumours according to the number of methylated promoters, and that CIMP is associated with high BRAF and low KRAS mutation rates. In addition, even within MSI-H and MSS tumours, CIMP tumours have significantly higher BRAF mutation frequencies than non-CIMP counterparts. Therefore, our data indicate that CIMP is a distinct biological subtype of colorectal cancer, independent of MSI status.
The term CIMP has been used for a subset of colorectal cancers with promoter methylation in multiple genes.10–15 As most previous studies showed unimodal distributions of the numbers of methylated loci,11,14,20,21 it has been unclear how many loci should be methylated for a given tumour to be classified as CIMP. It has also been suggested that CIMP is merely within a spectrum of predicted distributions of stochastic methylation events.20,21 However, there were a number of limitations of these previous studies.
Firstly, these previous studies used MSP to determine promoter methylation in multiple genes.10–15,20,21 MSP based methylation assays have major limitations in assay quality, and cannot reliably distinguish high from very low levels of methylation with little or no biological significance. We have demonstrated that most colorectal cancers with low levels of promoter methylation in MLH1, CDKN2A (p16), or MGMT (PMR <4 by MethyLight) show intact protein expression, indicating little or no biological significance of low levels of DNA methylation in these loci.22 Thus studies to determine promoter methylation and CIMP status by MSP should be evaluated with caution.
Secondly, choice of gene promoters to determine CIMP status is important. Aberrant CpG island methylation has been shown to occur in a non-random fashion and the pattern of methylation is tumour specific.42 Thus a carefully selected and validated panel of methylation markers should be used to determine CIMP status. We evaluated each of the five gene promoters (that is, CACNA1G, CDKN2A, CRABP1, MLH1, and NEUROG1) as well as MGMT for suitability in the CIMP panel. There were previous studies that included MGMT in CIMP panels.20,21 However, our data indicate that MGMT show low sensitivity (62%) and specificity (66%) for determination of CIMP and may be better excluded from a CIMP panel. The other five markers, excluding MGMT, show very high (>90%) sensitivity and/or specificity, and methylation in each of these five markers correlates very well with overall CIMP status (that is, methylation in multiple markers) (see appendix). Therefore, inclusion of these five markers into the CIMP panel can be justified. The fact that MGMT methylation is not a good predictor of CIMP does not mitigate the biological importance of MGMT methylation as it has been associated with G>A mutations in KRAS and TP5334,46 and may contribute to field effects (field defects) that might lead to colorectal cancer development.43,44
Thirdly, in most previous studies, the numbers of subjects were limited and not population based. The importance of population based studies, particularly prospective cohort studies, cannot be overemphasised to avoid obvious sources of bias. There has been only one large population based retrospective study on over 800 cases15 which revealed unique associations of CIMP with various clinicopathological features by multivariate analyses.15 However, no previous study has been based on large prospective cohorts.
To resolve the issues mentioned above, we measured CpG island methylation in five gene promoters by quantitative real time PCR (MethyLight) assays on 460 colorectal cancer cases in large prospective cohort studies. We have demonstrated a clear bimodal distribution of the number of methylated loci among 80 MSI-H tumours (fig 1). Most previous investigators arbitrarily defined CIMP as having methylation in ⩾50% markers. Our data indicate that CIMP can be defined as having methylation in ⩾4/5 markers when using a panel of five carefully selected CIMP specific markers. The distribution of 34 MSI-H BRAF mutated tumours, all of which showed 4/5 or more methylated loci, further supports this higher cut off for CIMP (table 5).
Previous studies using MSP based assays designated approximately 30–35% of colorectal cancers as CIMP positive.10–13 However, MSP may detect very low levels of biologically insignificant methylation. Hence the previously reported frequencies of CIMP might be overestimates. Our quantitative DNA methylation data indicate that CIMP is less frequent (only 17%) than previously reported. In fact, when a lower PMR cut off of 1 was used and CIMP was defined as having methylation in ⩾3/6 loci (including MGMT in the CIMP panel), the frequency of CIMP increased to 32% ( = 148/460) (detailed data not shown). This CIMP frequency estimate matches with previous reports,11,14,20,21 suggesting that 10% or more tumours might have been misclassified as CIMP in previous studies. Misdiagnosis of CIMP might obscure associations of CIMP with various clinical and pathological features. We recommend that quantitative DNA methylation analysis should be validated and used for research in cancer epigenetics.
CIMP has been previously associated with MSI.11,13–15,20 CIMP is more common in sporadic MSI-H tumours than in MSI-H tumours in the setting of hereditary non-polyposis colorectal cancer.45 We have shown a strong association of MSI-H with CIMP, and striking bimodal distributions of the number of methylated loci among 80 MSI-H tumours (fig 1), supporting different pathogenetic mechanisms for the two distinct types (CIMP and non-CIMP) of MSI-H tumours, with different BRAF mutation frequencies (63% v 0%) and KRAS mutation frequencies (1.9% v 31%). Likewise, BRAF mutations were present in 54% of CIMP MSS tumours in contrast with only 6.6% of non-CIMP MSS tumours (fig 2), also supporting two distinct types (CIMP and non-CIMP) of MSS tumours. Thus our data confirm a striking link between BRAF mutations and CIMP, as in previous studies.16–18 All of the 34 BRAF mutant MSI-H tumours were CIMP with ⩾4/5 methylated loci (table 5).
Previous studies suggested a link between KRAS mutation and CIMP.13,15 The link might be due to hypermethylation and silencing of MGMT, a mismatch repair gene, predisposing to KRAS G>A mutation.46 However, in other studies, CIMP tumours showed lower KRAS mutation frequencies than non-CIMP tumours.11,14,16,17,47 Our data support an inverse association of KRAS mutations with CIMP (table 4). We also examined whether tumours with 1/5–3/5 methylated loci were associated with KRAS mutations. We showed that 1/5–3/5 methylated tumours had higher frequencies of KRAS mutations (48%) and BRAF mutations (11%) than the 0/5 methylated tumours (35% and 2.9%, respectively; both p<0.02). Further investigation will be necessary to determine whether the 1/5–3/5 methylated tumours should be called “CIMP-low” (analogous to “MSI-low”), which is distinct from 0/5 methylated tumours. None the less, our results could explain conflicting data on KRAS mutation frequencies among CIMP colorectal cancers in previous studies11,13–17,47 where MSP assays and looser criteria for CIMP might have included some “CIMP-low” cases (with frequent KRAS mutations) into CIMP tumours (with a low frequency of KRAS mutations).
In conclusion, CpG island methylator phenotype (CIMP) of colorectal cancer is best characterised by quantitative DNA methylation analysis and carefully selected markers. CIMP is a distinct epigenetic subtype of colorectal cancer, tightly associated with BRAF mutations and MSI-H. The frequency of CIMP is likely to be 20% or less, which is lower than previously reported. Quantitative DNA methylation assays should be validated and used for research and clinical practice in cancer epigenetics.
APPENDIX
Sensitivity and specificity of each methylation marker for overall CpG island methylator phenotype (CIMP) status
Distributions of percentage of methylated reference (PMR) values in 460 colorectal cancers
Sex and frequency of CpG island methylator phenotype (CIMP)
Microsatellite instability status and frequency of CpG island methylator phenotype (CIMP)
KRAS and BRAF mutations, and frequency of CpG island methylator phenotype (CIMP)
Microsatellite instability, KRAS and BRAF status, and frequency of CpG island methylator phenotype (CIMP)
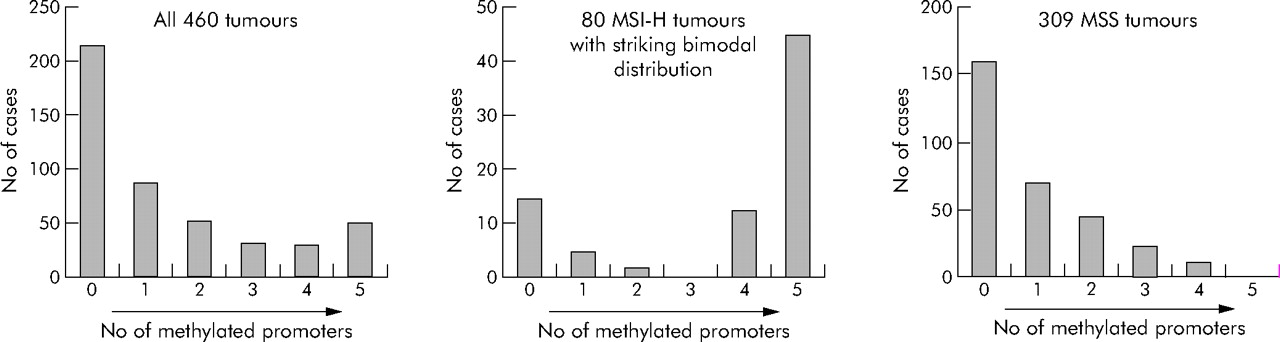
Distributions of the numbers of methylated loci in colorectal cancer. MSI-H, microsatellite instability-high; MSS, microsatellite stable.

Six subtypes of colorectal cancer and frequency of BRAF mutations. CIMP, CpG island methylator phenotype; MSI-H, microsatellite instability-high; MSI-L, microsatellite instability-low; MSS, microsatellite stable.
Six subtype of colorectal cancer and frequency of KRAS mutations. CIMP, CpG island methylator phenotype; MSI-H, microsatellite instability-high; MSI-L, microsatellite instability-low; MSS, microsatellite stable.
Acknowledgments
This work was supported by the National Institute of Health (NIH) grants P01 CA87969-03 and P01 CA55075-13. We thank the NHS and HPFS cohort participants who generously agreed to provide us with biological specimens and information through responses to questionnaires. We thank Graham Colditz, Walter Willett, and many other staff members who implemented and maintained the cohort studies.
REFERENCES
Supplementary materials
Conflict of Interest: PWL is shareholder and Scientific Advisory Board Member of Epigenomics, AG, which has a commercial interest in the development of DNA methylation markers for disease detection and diagnosis. None of the work described in this manuscript was supported by Epigenomics, AG.
Footnotes
-
Published online first 11 January 2006