Article Text

Abstract
Aims: The influence of enteric glia on the regulation of intestinal functions is unknown. Our aim was to determine the phenotype of enteric neurones in a model of glia alterations and the putative changes in intestinal motility and permeability.
Methods: Transgenic mice expressing haemagglutinin (HA) in glia were used. Glia disruption was induced by injection of activated HA specific CD8+ T cells. Control mice consisted of non-transgenic littermates injected with activated HA specific CD8+ T cells. Immunohistochemical staining for choline acetyltransferase (ChAT), substance P (SP), vasoactive intestinal peptide (VIP), and nitric oxide synthase (NOS) was performed on jejunal submucosal plexus (SMP) and myenteric plexus (MP). Neurally induced jejunal muscle activity was characterised in vitro. Gastrointestinal transit and paracellular permeability were measured using fluorescein isothiocyanate-dextran markers.
Results: CD3 positive T cells infiltrates were observed in the MP of transgenic mice. In the SMP, the proportions of VIP and SP positive neurones decreased in transgenic mice compared with control mice. ChAT remained unchanged. In the MP, the proportions of ChAT and NOS positive neurones increased and decreased, respectively, in transgenic mice. In contrast, VIP and SP remained unchanged. Neurally mediated jejunal relaxation was lower in transgenic mice than in controls. This relaxation was reduced by NG-nitro-L-arginine methyl ester in control mice but not in transgenic mice. Gastrointestinal transit was delayed and intestinal permeability increased in transgenic mice compared with control mice.
Conclusion: Glia disruption induces changes in the neurochemical coding of enteric neurones, which may partly be responsible for dysfunctions in intestinal motility and permeability.
- BDNF, brain derived neurotrophic factor
- ChAT, choline acetyltransferase
- CNS, central nervous system
- CS, cross sectional area
- DMEM, Dulbecco’s modified Eagle’s medium
- EFS, electrical field stimulation
- EGCs, enteric glial cells
- ENS, enteric nervous system
- FITC, fluorescein isothiocyanate
- GDNF, glial derived neurotrophic factor
- GFAP, glial fibrillary acidic protein
- HA, haemagglutinin
- IGC, intestinal geometric centre
- IFN-γ, interferon γ
- IL, interleukin
- L-NAME, NG-nitro-L-arginine methyl ester
- MP, submucosal plexus
- NGF, nerve growth factor
- NO, nitric oxide
- NOS, nitric oxide synthase
- NSE, neurone specific enolase
- NT-3, neurotrophin 3
- PBS, phosphate buffered saline
- PCR, polymerase chain reaction
- SMP, submucosal plexus
- SNP, sodium nitroprusside
- SP, substance P
- TCR, T cell receptor
- TNF-α, tumour necrosis factor α
- TTX, tetrodotoxin
- VIP, vasoactive intestinal peptide
- enteric glia
- permeability
- motility
- enteric nervous system
- nitric oxide synthase
Statistics from Altmetric.com
- BDNF, brain derived neurotrophic factor
- ChAT, choline acetyltransferase
- CNS, central nervous system
- CS, cross sectional area
- DMEM, Dulbecco’s modified Eagle’s medium
- EFS, electrical field stimulation
- EGCs, enteric glial cells
- ENS, enteric nervous system
- FITC, fluorescein isothiocyanate
- GDNF, glial derived neurotrophic factor
- GFAP, glial fibrillary acidic protein
- HA, haemagglutinin
- IGC, intestinal geometric centre
- IFN-γ, interferon γ
- IL, interleukin
- L-NAME, NG-nitro-L-arginine methyl ester
- MP, submucosal plexus
- NGF, nerve growth factor
- NO, nitric oxide
- NOS, nitric oxide synthase
- NSE, neurone specific enolase
- NT-3, neurotrophin 3
- PBS, phosphate buffered saline
- PCR, polymerase chain reaction
- SMP, submucosal plexus
- SNP, sodium nitroprusside
- SP, substance P
- TCR, T cell receptor
- TNF-α, tumour necrosis factor α
- TTX, tetrodotoxin
- VIP, vasoactive intestinal peptide
The enteric nervous system (ENS) is an integrative neuronal network localised all along the gut and organised into two ganglionated plexi: the submucosal plexus (SMP) and the myenteric plexus (MP). The ENS is composed of two main cell types: neurones and enteric glial cells (EGCs). Although the role of enteric neurones in the regulation of gastrointestinal functions has been thoroughly studied, the contribution of EGCs is largely unknown. Mounting evidence suggests that EGCs are the counterparts in the ENS of the astrocytes in the central nervous system (CNS). Similar to astrocytes, EGCs possess a densely integrated array of intermediate filaments rich in glial fibrillary acid protein (GFAP) and express the calcium binding protein S100β.1–3 They ensheath the neuronal cell bodies within the ganglia, as well as the connecting neuronal interganglionic processes.
Although their morphology has been well documented, little is known about their function. Various observations indicate that EGCs may promote neuronal survival by directly regulating substrate supply.4,5 They also appear to regulate perineuronal homeostasis.4 For example, EGCs are the only cell type in the ENS that express glutamine synthetase, which might be involved in the detoxification of glutamate and gamma aminobutyric acid.4 In a recent study, Nishiyama and colleagues6 showed that astrocytes in the CNS can modulate neuronal synaptic plasticity. Nevertheless, the role of EGCs in the control of enteric neuromediator synthesis is currently unknown.
Various studies have underlined the involvement of EGCs in intestinal inflammation during which both mucosal and motor functions are altered.7,8,9,10,11 In fact, EGCs can synthesise cytokines and inflammatory conditions modulate glia proliferation.12,13 Furthermore, ablation of EGCs in two transgenic mice models caused fatal intestinal inflammation. In a transgenic mouse model developed by Bush and colleagues,14 selective ablation of cycling EGCs led to compromised epithelial integrity within the jejunum and ileum, resulting in fulminant intestinal inflammation, haemorrhage, and necrosis. It was also associated with a moderate degeneration of myenteric neurones but no change in neuronal content of substance P. More recently, Cornet and colleagues7 have established a transgenic mouse model of immune mediated glia alteration which develops spontaneous fulminant jejuno-ileo-colitis, lethal within eight days of life. The resulting pathology initiated as submucosal vasculitis is reminiscent of that described for Crohn’s disease and necrotising enterocolitis.7,15,16 However, with these models it was not possible to characterise the effects of EGCs on gastrointestinal functions such as motility and permeability, because (1) the experiments were performed on neonate mice which made functional studies difficult and (2) strong inflammation rapidly developed, making it difficult to attribute the observed changes to either inflammation or glia alteration. Therefore, to study the role of EGCs in the control of gastrointestinal functions, we used an adoptive transfer model in which immune alteration of glia was induced in adult animals. In addition, this model provides a synchronised and controlled alteration in glia.
MATERIALS AND METHODS
Animal model
We used a transgenic mouse (GFAP-HA) specifically expressing the influenza virus haemagglutinin (HA) in glia, which was previously described in detail by Cornet and colleagues.7 Glia disruption was induced by adoptive transfer of activated HA specific CD8+ T cells into GFAP-HA mice. All animal experiments were performed in accordance with the National Institutes of Health’s guidelines and had local committee approval (Purpan University Hospital).
Generation of HA specific Tc1 cells and the adoptive transfer experiments were performed as previously described.17 In brief, 5×10⁵ purified CD8+ T cells from CL4-TCR mice, in which more than 90% of CD8+ T cells express an HA specific T cell receptor (TCR), were stimulated in the presence of 5×10⁶ irradiated syngeneic splenocytes, in complete Dulbecco’s modified Eagle’s medium DMEM (Gibco, France), supplemented with 10% fetal calf serum (Gibco, France), containing 1 μg/ml HA 512-520 peptide, 1 ng/ml mouse interleukin 2 (IL-2) (R&D Systems), and 20 ng/ml mouse IL-12 (a gift from Dr Stanley Wolf, Genetics Institute, Cambridge, Massachusetts, USA). On day 6, living cells were collected by Ficoll density separation and washed three times before adoptive transfer. Six day cultures contained >98% pure CD8+ T cells, as assessed by flow cytometry.
For adoptive transfer experiments, 30×106 Tc1 in 0.3 ml were injected intravenously in unirradiated GFAP-HA recipients and non-transgenic littermates. Mice were assessed daily for development of clinical signs (alertness and general health status, tail and limb strength, gait and mobility, bowel function). For each adoptive transfer experiment, as a control for the pathogenic potential of T cell cultures, 2×10⁶ HA specific Tc1 cells were injected intravenously into Ins-HA mice, which express the HA protein specifically in pancreatic β cells. All Ins-HA recipients developed diabetes 5–7 days post transfer.
Characterisation of the animal model
Histological staining
Non-transgenic mice injected with T cells (defined as control mice) and GFAP-HA mice injected with T cells (defined as transgenic mice) were sacrificed by cervical dislocation seven days after injection of T cells. The jejunum was rapidly removed and fixed for four hours in 0.1 mol/l phosphate buffered saline (PBS) containing 4% paraformaldehyde at room temperature. Tissue blocks were embedded in paraffin. Thick sections (5 μm) were stained with haematoxylin/eosin. Immunohistochemistry was performed with a biotin-avidin technique with primary antibodies against GFAP (Boehringer, Mannheim, Germany), against T cells (CD3; Seralab, Sussex, UK), or against active caspase 3 (Pharmingen, BD Biosciences, Belgium).
Real time analysis of GFAP and cytokine expression at the mRNA level in the jejunum
Real time polymerase chain reaction (PCR) was performed on whole jejunal preparations from control and transgenic mice. Total RNA was isolated using TRIzol reagent (Gibco BRL, Cergy Pontoise, France) according to Chomczynski and Sacchi.18 Complementary DNA was generated on 1 μg of total RNA in a reaction volume of 20 μl, using murine-Moloney leukaemia virus reverse transcriptase (Gibco, BRL). Real time PCR analyses were performed for quantification of GFAP, tumour necrosis factor α (TNF-α), IL-2, interferon γ (IFN-γ), IL-4, IL-10, brain derived neurotrophic factor (BDNF), neurotrophin 3 (NT-3), S6, and β-actin mRNA expression. Sequence specific PCR primers were verified using the primer Express software version 1.5 (Applied Biosystems, Foster City, California, USA). Quantification of mRNA was performed using the ABI Prism 7000 (Applied Biosystems). Each real time PCR reaction contained 5 μl of cDNA, 12.5 μl SYBR GREEN universal PCR Master Mix (Applied Biosystems), 0.5 μl (5 μM) sense and antisense primers, and H2O for a 25 μl total volume. Thermal cycling conditions comprised an initial denaturation step at 95°C for 10 minutes and 40 cycles of 95°C for 15 seconds and 60°C for one minute. The sequences of the primer used were as follows:
-
GFAP: (sense 5′-AAG CTC CAA GAT GAA ACC AAC CTG A-3′; antisense 5′-GCA AAC TTA GAC CGA TAC CAC TC-3′);
-
TNF-α: (sense 5′-TGG GAG TAG ACA AGG TAC AAC CC-3′ ; antisense 5′-CAT CTT CTC AAA ATT CGA GTG ACAA-3′);
-
IFN-γ: (sense 5′-TCA AGT GGC TGT ACA AAC CTT-3′ ; antisense 5′-TGG CTC TGC AGG ATT TTC ATG-3′);
-
IL-4: (sense 5′-CCT GAG CAG GAT GGA GAA TTA CA-3′ ; antisense 5′-GAA GCC CTA CAG ACG AGC TCA-3′)
-
IL-2: (sense 5′-CCT GAG CAG GAT GGA GAA TTA CA-3′ ; antisense 5′-TCC AGA ACA TGC CGC AGA G-3′)
-
IL-10: (sense 5′-GGT TGC CAA GCC TTA TCG GA-3′ ; antisense 5′-ACC TGC TCC ACT GCC TTG CT-3′).
-
BDNF: (sense 5′-GAT GCC GCA AAC ATG TCT ATG A-3′ ; antisense 5′- TAA TAC TGT CAC ACA CGC TCA GCT C).
-
NT-3: (sense 5′-GCC CCC TCC CTT ATA CCT AAT G-3′ ; antisense 5′- CAT AGC GTT TCC TCC GTG GT -3′).
-
S6: (sense: 5′-GGG TCA GAA GGA TTC CTA TG-3′ ; antisense 5′-GGT CTC AAA CAT GAT CTG GG-3′).
-
β-actin: (sense: 5′-GGG TCA GAA GGA TTC CTA TG-3′ ; antisense: 5′-GGT CTC AAA CAT GAT CTG GG-3′).
Results were expressed as a ratio of GFAP, TNF-α, IFN-γ, IL-2, IL-4, IL-10, NT-3, and BDNF, with the housekeeping gene β-actin in each sample. We also verified that β-actin gene expression was unaffected following T cell injection by assessing in the same sample β-actin and ribosomal S6 mRNA expression. We obtained a significant linear correlation between β-actin and S6 expression (n = 8 mice) (data not shown).
Neurochemical coding of the SMP and MP
Segments of jejunum (2 cm long) were rapidly removed from mice seven days post T cell injection, opened along the mesenteric border, and cleaned of their intraluminal contents in a Krebs-bicarbonate solution (pH 7.4). The segment was pinned flat, mucosa up, in a dissection dish containing ice cold sterile oxygenated Krebs solution. Tissue was washed four times with sterile Krebs-bicarbonate solution and pinned back in a sterile Sylgard coated Petri dish before addition of sterile culture medium. The culture medium (DMEM/HAM’s-F12; Sigma Chemical, St Louis, Missouri, USA) was supplemented with 10% heat inactivated fetal calf serum (Sigma), 100 IU/ml penicillin, 100 μg/ml streptomycin, 1.1 μg/ml amphotericin B, 20 μg/ml gentamicin (Sigma), 2.4 mmol/l glutamine, and 2.1 g/l NaHCO3. To enhance immunoreactivity for peptides in nerve cell bodies, colchicine (40 μmol/l) was added to the medium. Tissue was then maintained at 37°C overnight in a humidified incubator containing 5% CO2 and air, and continuously agitated on a rocking tray.
After culture, tissue was fixed for four hours in 0.1 mol/l PBS containing 4% paraformaldehyde at room temperature. Following several washes in PBS, the tissue was pinned in a dissection dish. SMP and MP were obtained by microdissection under a microscope and were then permeabilised for one hour in PBS/NaN3 containing 0.5% triton X-100 and 5% horse serum (Sigma). SMP and MP were incubated overnight with the following primary antibodies against goat choline acetyltransferase (ChAT 1:100; Chemicon International, Temecula, California, USA), rabbit antineurone specific enolase (NSE 1:3000; Polysciences, Eppelheim, Germany), rat antisubstance P (SP 1:1000; Fiztgerald, Concord California, USA), mouse antivasoactive intestinal peptide (VIP 1:1000; Biogenesis, Poole, UK), and rabbit antinitric oxide synthase (NOS 1:3000; Alexis, San Diego, California, USA). Following incubation with primary antisera, tissue was washed with PBS and incubated for three hours with the following secondary antibodies: donkey antimouse IgG conjugated to 7-amino-4-methylcoumarin-3-acetate (1:50; Jackson Labs, purchased from Euromedex, France), donkey antigoat IgG conjugated to carboxymethylindocyanine-3 (1:500; Jackson Labs), donkey antirabbit IgG conjugated to fluorescein isothiocyanate (FITC 1:200; Jackson Labs), and donkey antirat IgG conjugated to 7-amino-4-indodicarbocyanine (1:500; Jackson Labs). An anti-NSE (1:2000; 17437, Polysciences, Germany) was used as a general marker to determine the total number of neurones in the SMP and MP.
To determine the general neurochemical coding of the SMP and MP, a total of 25 ganglia were analysed in each preparation.
Analysis of GFAP protein expression in the SMP and MP was performed on tissue freshly fixed following microdissection, as described previously. After permeabilisation for one hour in PBS/NaN3 containing 0.5% Triton X-100 and 5% horse serum, specimens were incubated with the primary antibody against rabbit GFAP (1:3000; Dakopatts, Denmark). Following washes with PBS, specimens were incubated for three hours with the secondary donkey antirabbit IgG conjugated with carboxymethylindocyanine-3 (1:500; Jackson Labs). Specimens were viewed under an Olympus IX 50 fluorescence microscope with a 10× objective. Pictures were acquired, at constant gain, with a black and white video camera (Mod 4910; Cohu Inc., SL Microtest, Jena, Germany) connected to a Macintosh computer via a frame grabber card (Scion Image; SL Microtest). GFAP intensity of 20 ganglia was measured by an imaging analysis program (Scion) for quantitative densitometric analysis.
Intestinal contractile activity
Isometric tension recording
Segments of jejunum (1–1.5 cm long) were removed at day 7 post T cell transfer, opened along the mesenteric border, and cleaned of their intraluminal contents. The mucosa was gently removed and the preparations were then suspended under 0.4 g of tension in a 10 ml organ bath containing oxygenated (5% CO2, 95% O2) Krebs-bicarbonate solution. The preparations were then allowed to equilibrate for 30 minutes. Isometric longitudinal mechanical activity of the segments was recorded using a force transducer (Basile No 7005; Comerio, VA, Italy). The viability of each preparation was checked at the end of each experiment by reassessment of spontaneous mechanical activity and the response to 10−5 mol/l of the muscarinic receptor agonist carbachol chloride (Sigma). Results were expressed as tension (g) and normalised for cross sectional area (CS), which was determined using the following equation:
CS (mm2) = [tissue wet weight (mg)] / [tissue length (mm) × density (mg/mm3)]
A density of 1.05 was used, according to Vermillion and colleagues.19
Experimental protocol
Isolated jejunal segments from control and transgenic mice were subjected to electrical field stimulation (EFS) using a stimulator with two platinum ring electrodes. Parameters of stimulation were: 10 V, train duration 15 seconds, 20 Hz, stimulus pulse duration 200 μs.
The response of jejunal longitudinal muscle to EFS in the presence of the muscarinic antagonist atropine sulphate (10−6 mol/l; Sigma) was measured. The effect of the nitric oxide synthase inhibitor NG-nitro-L-arginine methyl ester (L-NAME 5×10⁻⁴ mol/l; Sigma) in the presence of atropine (10−6 mol/l) was also investigated. Atropine and L-NAME were applied 10 and 20 minutes before nerve stimulation, respectively. The response of the jejunal longitudinal muscle to the nitric oxide (NO) donor sodium nitroprusside (SNP 10−4 mol/l; Sigma) was measured after treatment by tetrodotoxin (TTX 10−6 mol/l; Sigma).
All EFS induced responses were of neuronal origin as they were abolished in the presence of TTX 10−6 mol/l (data not shown). All tested substances were administered in a volume which did not exceed 1% of the total bath volume.
Gastric emptying and intestinal transit
Gastric emptying and intestinal transit were determined by assessing the distribution of a 70 kDa FITC conjugated dextran marker (70 kDa FITC-dextran; Sigma) throughout the gastrointestinal tract of control (n = 4) and transgenic mice (n = 4). Mice were fasted for 12 hours. Thirty minutes after gavage with 0.1 ml of 5 mmol/l FITC-dextran, mice were sacrificed and the stomach and small intestine were carefully removed. The small intestine was divided into eight segments of equal length. The stomach was taken as segment No 1 and the eight segments were numbered consecutively from 2 to 9. Each segment was flushed with 3 ml of 50 mmol/l Tris buffered saline solution (pH 10.3). Samples were centrifuged at 1200 rpm for five minutes, and fluorescent activity of the supernatant was measured using a fluorimeter (Perkin-Elmer, France).
Gastric emptying was determined by subtracting the dextran remaining in the stomach from the total dextran (in the stomach and small intestine) and dividing this value by total dextran. This value was then multiplied by 100 and expressed as per cent. Intestinal transit was analysed using the intestinal geometric centre (IGC) of the distribution of dextran throughout the intestine and was calculated following the equation described by Miller and colleagues:20
IGC = ∑ [(fraction of amount of FITC in each segment) × (segment number)]
The dextran concentration in each segment was expressed as a fraction of total dextran recovery.
In vivo intestinal permeability
Intestinal paracellular permeability was determined by measuring the appearance in blood of a marker, FITC-dextran (4.4 kDa FITC-dextran; Sigma) administered by gavage. Briefly, control (n = 6) and transgenic mice (n = 6) were fasted for 12 hours and 22 ml/kg body weight of PBS (pH 7.4) containing 22 mg/ml FITC-dextran were administered by gavage. A blood sample (150 μl) was obtained in a capillary tube by orbital retrobulbar puncture, five hours after administration of the marker. Blood samples were centrifuged (3000 rpm at 4°C) for 20 minutes. Plasma (50 μl) was mixed with an equal volume of PBS (pH 7.4). The concentration of fluorescein was determined using a fluorimeter (Perkin-Elmer, France) with an excitation wavelength at 485 nm and an emission wavelength of 530 nm using serially diluted samples of the marker as standard.
Statistical analysis
All data are presented as mean (SEM). Significance among groups was tested by analysis of variance (ANOVA). A p value <0.05 was considered statistically significant.
RESULTS
Morphology and cytokines profile of the small intestine
Transgenic mice injected with T cells did not develop any abnormal clinical signs. In particular, they were neither hypo- nor hyperactive and no objective signs of stress were observed. Microanalysis of whole mount jejunum revealed normal morphology in control (fig 1A) and transgenic (fig 1B) mice. Only moderate vasodilatation of the submucosal capillaries was observed in transgenic mice (fig 1B). In control mice, enteric ganglia showed normal morphology (fig 2A). In transgenic mice, the vast majority of ganglia had normal morphology although incidental damage to ganglia was observed (fig 2B). In addition, at day 7, a significant increase in CD3 positive T cells was observed in the MP of transgenic compared with controls (12.4 (1.2) v 1.5 (0.6) cells/mm; n = 3, p<0.05) (fig 2C). At 15 days after injection, the number of CD3 T cells within the enteric ganglia were again similar in transgenic and control mice (3.9 (0.8) v 1.7 (1.4) cells/mm; n = 3, p>0.05). Real time PCR analysis of mRNA expression of pro- and anti-inflammatory cytokines (IFN-γ, TNF-α, IL-2, IL-4, and IL-10) did not reveal any significant changes at day 7 in the jejunum of transgenic mice compared with controls (data not shown).

Histological analysis of the jejunum of control and transgenic mice. (A) Haematoxylin-eosin stained section shows normal architecture of the tissue with no inflammatory infiltrate and no mucosal injury in control mice. (B) Haematoxylin-eosin stained section illustrates moderate dilatation of submucosal capillaries in transgenic mice. Arrows indicate a submucosal blood vessel. Bar 100 μm.

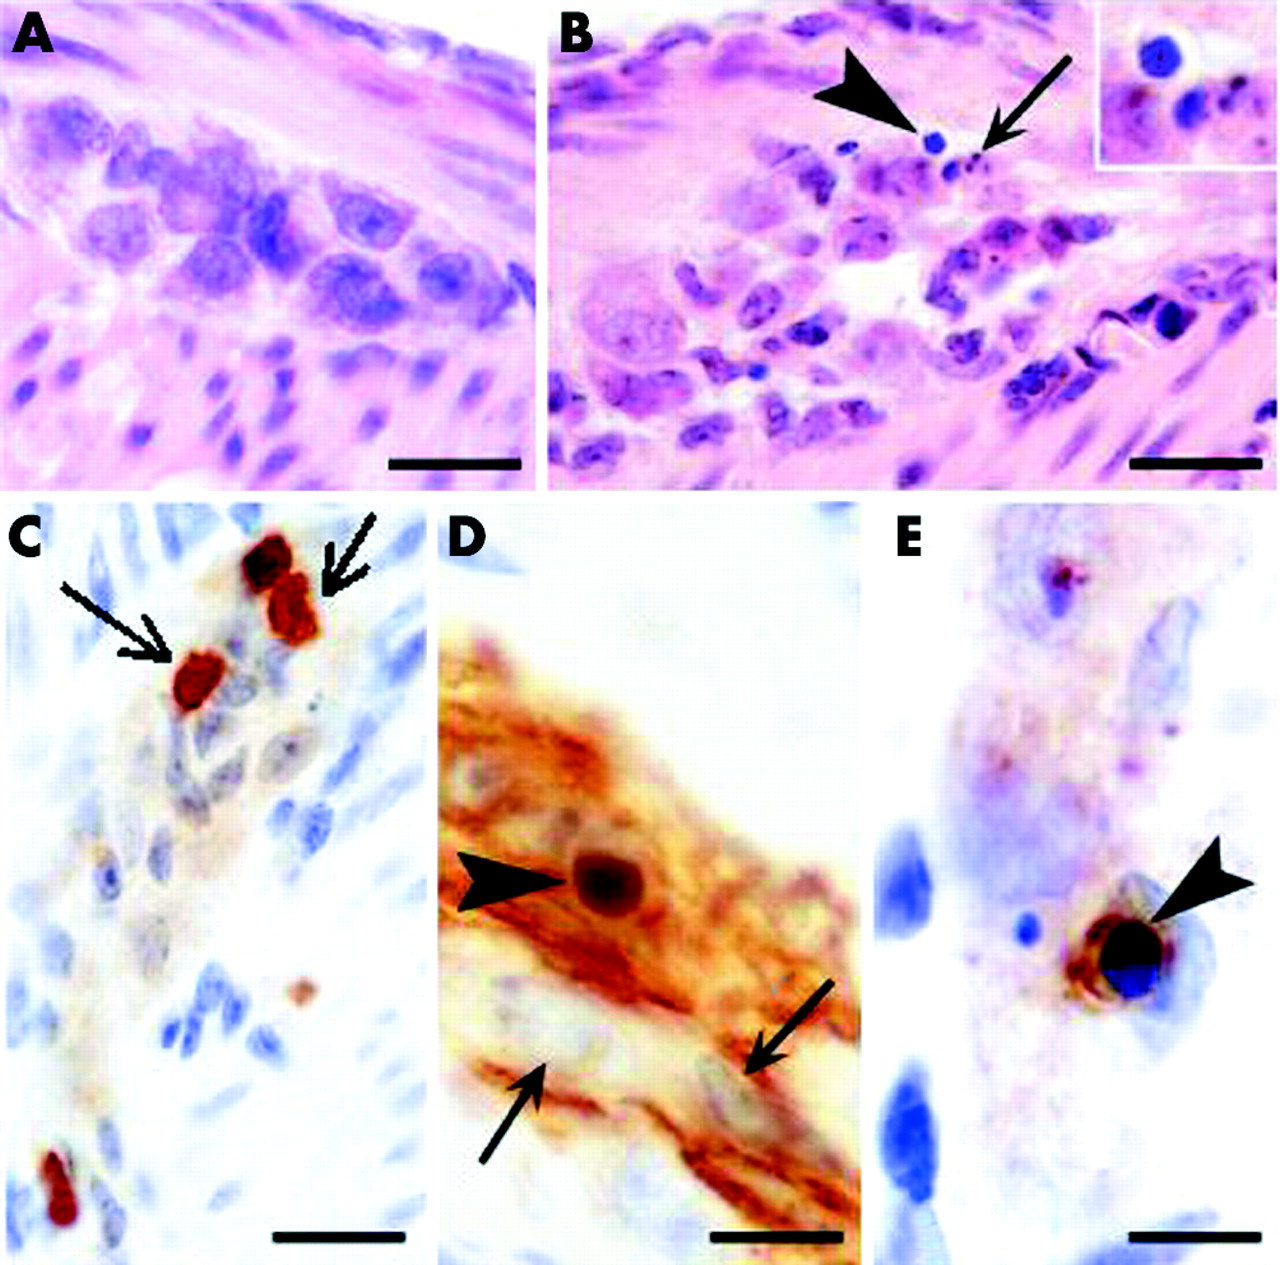
Histological analysis of the myenteric plexus of control and transgenic mice. (A) Haematoxylin-eosin stained section shows a myenteric ganglion in control mice. No injury or no inflammatory infiltrates can be seen (bar 20 μm). (B) Haematoxylin-eosin stained section from a transgenic animal shows a damaged myenteric ganglion. Arrowhead points at an apoptotic cell with condensed nucleus (magnified in inset). The arrow indicates the presence of parts of an apoptotic cell, the so-called apoptotic bodies (bar 20 μm). (C) Staining for CD3 revealing inflammatory T lymphocytes in the myenteric plexus from a transgenic mice (arrow; bar 20 μm). (D) Staining for glial fibrillary acidic protein (GFAP) shows enteric glial cells in a myenteric ganglion. The arrowhead indicates a GFAP+ cell with a small and homogenously dark stained condensed nucleus indicative of apoptosis. Arrows indicate normal nuclei which are larger and show heterochromatin patches (bar 10 μm). (E) Staining for active caspase-3 showing an apoptotic cell (probably a glial cell) in a myenteric plexus. Again, note condensation of the nucleus (arrowhead; bar 10 μm).
Expression of GFAP and GFAP mRNA in transgenic mice
Intensity of GFAP immunostaining determined by image analysis in enteric ganglia was significantly lower in the SMP of transgenic (fig 3B) than in the SMP of control (fig 3A) mice (138 (6) arbitrary units v 178 (11); n = 5, p = 0.01). A significant decrease in GFAP intensity was also observed in the MP of transgenic mice (fig 3D) compared with controls (fig 3C) (104 (9) arbitrary units v 192 (12); n = 6, p = 0.001). Consistently, real time PCR analysis revealed a significant decrease in the ratio of GFAP mRNA/β-actin mRNA in the whole gut preparation of transgenic mice compared with controls (0.7 (0.2) v 2.2 (0.5); n = 6, p = 0.019). Although the density of GFAP immunoreactive structures was similar in transgenic compared with control mice (3.5 (0.5) structures/mm v 3.3 (0.2)), GFAP immunoreactive cells with condensed nucleus, suggestive of apoptosis, were observed in transgenic mice (fig 2D, E).

Glial fibrillary acidic protein (GFAP) immunostaining in enteric ganglia was decreased in transgenic mice compared with controls. Representative photomicrographs showing decreased GFAP fluorescence in both the submucosal plexus and myenteric plexus of transgenic mice (B and D, respectively) compared with controls (A and C, respectively). Bar 100 μm.
Neurochemical coding
Submucosal plexus
The number of submucosal neurones per ganglion identified with NSE was similar in the jejunum of control mice (3.9 (0.3); n = 6) and transgenic mice (4.3 (0.2); n = 6).
The proportion of VIP positive submucosal neurones was significantly decreased by 23% (p<0.05) in transgenic mice compared with control mice (fig 4A). Similarly, the proportion of SP positive submucosal neurones was significantly decreased by 54% (p<0.05) in transgenic mice compared with control mice (fig 4A). In contrast, the proportion of ChAT positive submucosal neurones was similar in control and transgenic mice (fig 4A).

Neurochemical phenotype of the enteric nervous system is altered in transgenic compared with control mice. (A) Proportion of choline acetyltransferase (ChAT), substance P (SP), and vasoactive intestinal peptide (VIP) immunoreactive neuronal cell bodies in the jejunal submucosal plexus from control (n = 6) and transgenic (n = 6) mice. (B) Proportion of ChAT, SP, VIP, and nitric oxide synthase (NOS) immunoreactive neuronal cell bodies in the jejunal myenteric plexus from control (n = 7) and transgenic (n = 5) mice. The proportion of positive cell bodies are expressed as the percentage of the total number of neurones identified with neurone specific enolase (NSE). Values are mean (SEM); *p<0.05, transgenic versus control mice.
Myenteric plexus
The number of myenteric neurones from the jejunum of control mice (14.2 (2.3); n = 7) was also similar to that in transgenic mice (12.5 (3.4); n = 6).
The proportions of VIP and SP positive neurones were similar in control and transgenic mice (fig 4B). In contrast, the proportion of ChAT positive myenteric neurones was significantly increased by 21% (p<0.05) in transgenic mice compared with control mice (fig 4B). The proportion of NOS positive neurones was significantly decreased by 31% (p<0.05) in transgenic mice compared with controls (fig 4B).
Neurotrophic factor expression in control and transgenic mice
Quantitative PCR did not detect significant changes in jejunal expression of NT-3 and BDNF transcripts between control and transgenic mice (fig 5).

Transcript expression of neurotrophic factors (BDNF, brain derived neurotrophic factor; NT-3, neurotrophin 3) was not altered in transgenic mice compared with controls. Real time polymerase chain reaction showed no changes in mRNA expression in whole jejunum of transgenic mice (n = 4) compared with controls (n = 4), seven days following T cell injection. Values are mean (SEM); p>0.05.
Functional studies
In vitro jejunal contractile activity
In the presence of atropine (10−6 mol/l), EFS of jejunal segments evoked a biphasic response characterised by an initial relaxation followed by contraction (fig 6A). The amplitude of the relaxation in transgenic mice (22 (5) mg/mm2; n = 5) was significantly lower than that of control mice (57 (9) mg/mm2; n = 5, p<0.05) (fig 5B). L-NAME (5×10⁻⁴ mol/l) significantly reduced the relaxation by 60% (p<0.05) in control mice (fig 6B). In contrast, in transgenic mice, the neurally mediated relaxation was not modified in the presence of L-NAME. Relaxation of jejunal muscle induced by SNP (10−4 mol/l) after treatment with TTX (10−6 mol/l) was similar in control (60 (24) mg/mm2; n = 3) and transgenic (50 (6) mg/mm2; n = 3) mice.

Neurally induced motor function was altered in vitro in transgenic mice compared with controls. (A) Typical recording showing neurally mediated relaxation induced by electrical field stimulation (EFS 10 V, 200 μs, 20 Hz, 15 s duration) in the longitudinal jejunal muscle from control and transgenic mice after atropine treatment (10−6 M). (B) Amplitude of the neurally mediated relaxation was significantly lower in transgenic (n = 5) than in control (n = 5) mice; p<0.05, transgenic versus control mice. Pretreatment with NG-nitro-L-arginine methyl ester (L-NAME 5×10⁻⁴ M) significantly decreased the neurally mediated relaxation in control mice (n = 5) whereas it did not modify the neurally mediated relaxation in transgenic mice (n = 5). Values are mean (SEM); *p<0.05, transgenic versus control mice.
Gastrointestinal transit
Gastric emptying of the 70 kDa FITC-dextran fluorescent marker was delayed modestly (by 12%) but significantly (p<0.05) in transgenic mice compared with the control group (fig 7A). Similarly, intestinal transit was significantly decreased by 23% (p<0.05) in transgenic mice compared with control mice (fig 7B).

In vivo intestinal motility was altered in transgenic mice compared with controls. (A) Gastric emptying of 70 kDa fluorescein isothiocyanate (FITC)-dextran in control (n = 4) and transgenic (n = 4) mice; *p<0.05, transgenic versus control mice. (B) Intestinal transit, assessed by the geometric centre of the distribution of 70 kDa FITC-dextran throughout the intestine, in control (n = 4) and transgenic (n = 4) mice. Values are mean (SEM); *p<0.05, transgenic versus control mice.
In vivo intestinal permeability
Intestinal paracellular permeability for 4.4 kDa FITC-dextran was significantly increased by threefold in transgenic mice, as indicated by higher plasma concentrations five hours after gavage (fig 8).

In vivo intestinal permeability was altered in transgenic mice compared with controls. Intestinal paracellular permeability, assessed by determining the plasma concentration of 4.4 kDa fluorescein isothiocyanate (FITC)-dextran (FD-4) five hours after gavage, was significantly greater in transgenic (n = 6) than in control (n = 6) mice. Values are mean (SEM); *p<0.05, transgenic versus control mice.
DISCUSSION
Using an original animal model of enteric glia alteration, our results obtained in vivo and in vitro showed that enteric glia alteration induces changes both in the neurochemical coding of enteric neurones and in intestinal motor and mucosal functions.
In the adoptive transfer model that was used, no overt clinical signs were observed. These observations are at variance with those reported in previous models of glia disruption where mice died at an early stage from fulminant intestinal inflammation, haemorrhage, and necrosis.7,14 In these models, severe intestinal inflammation was correlated spatially and temporally with extensive ablation of EGCs. In contrast, our adoptive transfer model was associated with slight enteric glia disruption characterised by a decrease in GFAP expression both at the protein and mRNA levels. A similar decrease in GFAP expression has been observed in non-inflamed areas in Crohn’s disease.7 Furthermore, in our model, we also observed moderate vasodilatation that has been reported as an early feature in Crohn’s disease.16 Alteration of GFAP expression induced in our model was associated with a modest T cell infiltration restricted to the ENS but was not associated with intestinal inflammation, as detected by histology and by PCR analysis. This is also consistent with the observation that acute intestinal inflammation is usually associated with an increase in GFAP expression as well as proliferation of glial cells.21,22 This absence of intestinal inflammation could be due to the fact that glial disruption is not profound enough to cause severe inflammation as the number of GFAP structures was not affected in our model.
In our mouse model of glia disruption, the number of enteric neurones per ganglion from the SMP and MP was not modified compared with control animals, suggesting that neuronal cell loss did not occur at this stage. These results are consistent with those reported by Cornet and colleagues.7
A major finding of our study was that neurochemical coding in both plexus changed in the jejunum from mice with glia disruption. In addition, changes in the phenotype affected different populations in the SMP and MP. The mechanisms responsible for these changes remain to be explored. However, astrocytes are well known synthesisers of various neurotrophic factors (NT-3, GDNF, NGF) that could be involved in the regulation of enteric neuromediator expression.23–27 In addition, enteric neurones have been shown to express neurotrophin receptors.23 Therefore, alterations in glia could result from altered neurotrophic factor synthesis. However, we did not observe significant changes in expression of the transcripts studied (that is, NT-3 or BDNF). Apart from the involvement of other neurotrophic factors, changes in the neurochemical coding of enteric neurones could also have been associated with ganglionic T cells infiltrates, as changes in neurochemical coding are a key feature in inflammatory bowel diseases.28,29 However, in the present study, the implication of inflammatory mediators in neuronal plasticity is unlikely to play an important role as no increase in cytokine transcripts was observed. Furthermore, the inflammatory infiltrate in the ganglion has a Th1 phenotype and such a phenotype (occurring during Crohn’s disease) induce an increase in neuronal NOS and VIP expression,29,30 which is the opposite to the changes observed in our study.
Our study also provides the first evidence that alteration in enteric glia induces motor changes both in vivo and in vitro. These results are in agreement with a recent preliminary report showing that chemically induced ablation of glial cells with gliotoxin induces a decrease in in vivo motility.31 These changes in motility could be correlated with the decrease in NOS immunoreactivity in myenteric neurones which have been shown to be inhibitory motor neurones.32 Indeed, EFS induced relaxation was NO independent in transgenic mice in contrast with controls where EFS induced relaxation was significantly reduced by L-NAME. This decrease in NOS immunoreactivity could also explain the decrease in gastric emptying and intestinal transit. This hypothesis is supported by the observation that L-NAME greatly decreases intestinal transit33,34 and that gastric emptying was delayed in NOS deficient mice.35 We cannot rule out the possibility that smooth muscle sensitivity to NO changes in transgenic mice. This is however unlikely as the relaxation induced by SNP after pretreatment by TTX was similar in control and transgenic mice. Apart from changes in NO expression, alterations in neurotrophic factors could also have been involved in the delayed transit observed in transgenic mice as neurotrophins (NT-3, BDNF) accelerate intestinal transit.36,37 However, this seems not to be the case in our model as expression of NT-3 and BDNF are not significantly altered in transgenic mice. Finally, altered motility could also result from alterations in glial cells of the spinal cord described in this model of glia disruption17 as extrinsic neuronal pathways can modulate gastrointestinal functions. However, animals completely lacked any signs of clinical disease, suggesting that neuronal functions were not impaired, as also shown by the absence of enteric neuronal degeneration.
Apart from changes in intestinal motility, transgenic mice also have a clear increase in intestinal paracellular permeability, as assessed by a conventional method measuring plasma concentrations of the 4.4 kDa FITC-dextran molecule following gavage.38,39 These data suggest that EGCs are involved in the regulation of intestinal paracellular permeability. These results are consistent with preliminary results obtained both in vivo and in vitro.40 In a non-immune mediated in vivo model of glial cell disruption, increased intestinal permeability occurred prior to intestinal inflammation. Furthermore, direct coculture of enteric glial cells and intestinal epithelial cells decreased intestinal barrier paracellular permeability,40 suggesting that enteric glial cells can directly regulate paracellular permeability. It is also tempting to hypothesise that the decrease in VIPergic submucosal neurones observed in transgenic mice could be partly responsible for the increased permeability. Indeed, a recent study has shown that activation of VIPergic submucosal neurones decreases paracellular permeability.41 It is also of interest to note that a disease with altered glial cells, such as Crohn’s disease, presents an increase in intestinal permeability.42
In summary, our data indicate that EGCs are involved in the regulation of gastrointestinal functions such as intestinal motility and permeability. Furthermore, EGCs participate in the control of the neurochemical phenotype of enteric neurones. The mediators and mechanisms involved remain to be further characterised.
Acknowledgments
We are grateful to Dr Anne Jarry for her help in histological assessment and to Gerard Lecannu for excellent technical assistance. Dr Anne-Catherine Aubé is the recipient of an IRMAD Astra Zeneca grant.
REFERENCES
Footnotes
-
↵* A-C Aubé and J Cabarrocas contributed equally to this study.
-
Published online first 19 October 2005
-
Conflict of interest: None declared.
-
Parts of this study were presented at the Annual Meetings of the American Gastroenterological Association, Orlando, Florida, 18–22 May 2003, and New Orleans, 15–20 May 2004.