Article Text

Abstract
Objective Oncogenic Kras-activated robust Mek/Erk signals phosphorylate to the tuberous sclerosis complex (Tsc) and deactivates mammalian target of rapamycin (mTOR) suppression in pancreatic ductal adenocarcinoma (PDAC); however, Mek and mTOR inhibitors alone have demonstrated minimal clinical antitumor activity.
Design We generated transgenic mouse models in which mTOR was hyperactivated either through the Kras/Mek/Erk cascade, by loss of Pten or through Tsc1 haploinsufficiency. Primary cancer cells were isolated from mouse tumours. Oncogenic signalling was assessed in vitro and in vivo, with and without single or multiple targeted molecule inhibition. Transcriptional profiling was used to identify biomarkers predictive of the underlying pathway alterations and of therapeutic response. Results from the preclinical models were confirmed on human material.
Results Reduction of Tsc1 function facilitated activation of Kras/Mek/Erk-mediated mTOR signalling, which promoted the development of metastatic PDACs. Single inhibition of mTOR or Mek elicited strong feedback activation of Erk or Akt, respectively. Only dual inhibition of Mek and PI3K reduced mTOR activity and effectively induced cancer cell apoptosis. Analysis of downstream targets demonstrated that oncogenic activity of the Mek/Erk/Tsc/mTOR axis relied on Aldh1a3 function. Moreover, in clinical PDAC samples, ALDH1A3 specifically labelled an aggressive subtype.
Conclusions These results advance our understanding of Mek/Erk-driven mTOR activation and its downstream targets in PDAC, and provide a mechanistic rationale for effective therapeutic matching for Aldh1a3-positive PDACs.
- PANCREATIC CANCER
- PANCREATIC PATHOLOGY
- ONCOGENES
Statistics from Altmetric.com
Significance of this study
What is already known on this subject?
The majority of human pancreatic ductal adenocarcinomas (PDACs) with oncogenic KRAS mutations and active mammalian target of rapamycin (mTOR) signalling do not respond to mTOR inhibition.
Though oncogenic KRAS can activate mTOR through MEK/ERK or PI3K/AKT, genetic changes along the PI3K/AKT pathway have been proposed as biomarkers for mTOR inhibition.
The tuberous sclerosis complex is required to relay signals from MEK/ERK and/or PI3K/AKT to mTOR.
What are the new findings?
Tuberous sclerosis complex 1 is a dose-dependent tumour suppressor which facilitates the oncogenic Kras-mediated Mek/Erk-to-mTOR signal to drive metastatic PDACs.
Dual inhibition of Mek and PI3K effectively decreases oncogenic Kras/Mek/Erk-induced mTOR (hyper)activity.
The oncogenic activity of the Mek/Erk/mTOR axis relies on Aldh1a3, which also labels an aggressive subtype of human PDAC.
Genetically engineered mouse models can be used to specify a PDAC subset and its respective biomarker, Aldh1a3.
How might it impact clinical practice in the foreseeable future?
Therapeutic matching according to ALDH1A3 levels and dual MEK/PI3K inhibition in this subset of patients is a reasonable strategy for testing in a clinical setting.
Future mTOR inhibition studies should take the mTOR activation pattern into consideration to predict putative inhibition-induced counteractive feedback responses.
Introduction
Despite enormous progress in the understanding of underlying molecular biology, pancreatic ductal adenocarcinoma (PDAC) remains a fatal, treatment-refractory disease. Although it is homogeneous (almost uniformly carries mutant, oncogenic Kras), there is considerable heterogeneity in clinical outcomes. Recently, these findings have been attributed to various levels of oncogene addiction1 to context dependency of the oncogenic potential of Kras and to the complex signalling network dynamics activated by mutated Kras.2
Though few PDACs rely on PI3K/Akt as their oncogenic backbone,3 ,4 robust Mek/Erk activity seems to be the major driver of pancreatic oncogenesis and is a requirement for epithelial transformation.5 ,6 Deactivation of tuberous sclerosis complex (Tsc) function is one of the major effects of Mek/Erk activation. The Tsc is also where the Mek/Erk and PI3K/Akt pathways converge and has been shown to be a quantitative tumour suppressor in other tumour entities.7 ,8 Loss or impaired activity of Tsc decreases mammalian target of rapamycin (mTOR) inhibition, leading to its activation (also in PDAC9). Decreasing mTOR activity as one of the proliferation master switches was, therefore, thought to have a potentially therapeutical effect in PDAC. Clinical trials, however, have largely failed to demonstrate any benefit of direct mTOR inhibition.10 There are a number of possible explanations for these findings. Single effector inhibition may only be modestly active as Kras activates multiple parallel networks.2 Negative feedback signalling11 or molecular heterogeneity of PDAC below the level of oncogenic Kras (eg, coexisting genetic alternations along the PI3K/Akt pathway) may be other contributing factors. The latter hypothesis is supported by the activity of single molecule inhibition in small groups of patients.12 ,13 Consequently, biomarkers defining particular subsets of patients that are more likely to respond to a specific treatment must be identified. Understanding clinical failure of mTOR inhibition also necessitates an understanding of Tsc-mediated mTOR hyperactivation patterns in vivo.
Because Tsc1-haploinsufficiency has been shown to induce oncogenic Kras-driven cancer in the lungs,7 we hypothesised that TSC might be downregulated in a subset of PDACs and a reduction of Tsc function may facilitate oncogenic Kras-driven mTOR activation in PDAC. Using transgenic mouse models and in vitro signalling analyses, we dissected Mek/Erk/Tsc-driven mTOR signalling in PDAC. Further analyses identified biomarkers predictive of response to combinatorial inhibition of pathways upstream of mTOR. These data lay the foundation for transcriptional biomarker-based treatment schemes aiming to achieve a persistent decrease in mTOR hyperactivation in PDAC patient subsets.
Methods
Patient material and tissue collection
We obtained PDAC tissues from patients who had undergone pancreatic resections. All sample diagnoses were confirmed histologically. Samples were either snap-frozen in liquid nitrogen or were fixed in paraformaldehyde solution for 24 h and subsequently paraffin-embedded for histological analysis. The use of tissue for this study was approved by the local Ethics Committee and written informed consent was obtained from patients prior to surgery (Department of Surgery, Klinikum rechts der Isar, Technical University Munich; resections on patients with PDAC were performed between 2007 and 2010). Detailed clinical and pathological data were obtained from each patient. Patients who survived less than 2 months postsurgery were excluded from the survival analysis in order to rule out surgery-related mortality. Donor pancreases were obtained through an organ donor programme from previously healthy individuals. Tissue slides from human xenograft PDAC were processed, as previously reported.14 ,15
Mouse lines
Mice containing floxed allele of Pten (006440), Tsc1 (005680), p53 (008462) or the Loxp-STOP-Loxp-KrasG12D (LSL-KrasG12D; 008179) were obtained from The Jackson Laboratory (Bar Harbor, Maine, USA). The pancreas-specific Cre recombinase line Ptf1aCre/+ (also known as p48Cre/+) was from Roland M. Schmid and JTS (Department of Gastroenterology, TU Munich). The wild type (WT; C57BL/6J) and the BALB/c nude mice were obtained from Charles River Laboratory (Sulzfeld, Germany).
Mouse breeding
Mouse breeding was performed and husbandry was maintained at the specific pathogen-free mouse facility at the Technical University of Munich. The compound transgenic mice were maintained on a mixed background. All mouse experiments and procedures were approved by the Institutional Animal Care and Use Committees of the Technical University of Munich. All procedures were in accordance with the Office of Laboratory Animal Welfare and the German Federal Animal Protection Laws.
Primary cell isolation
Freshly dissected sterile tumour tissues were washed twice with ice-cold PBS, cut into small cubes (approximately 1 mm) and dispensed into 5 mL of complete medium containing collagenase (1.2 mg/mL). The resulting solution (mixed with tissue blocks) was incubated at 37°C for 0.5 h. After centrifugation at 300 rpm for 5 min, the small tissue blocks were washed twice with collagenase-free medium, followed by incubation at 37°C with medium containing collagenase for an additional 0.5 h. After passing the undigested tissue blocks through a 100 µm nylon mesh, cell suspensions were obtained. These cell suspensions were washed two times with complete medium and seeded into a 10 cm2 dish.
Further materials and methods
A detailed materials and methods section is provided as a supplement to this manuscript.
Statistical analysis
Either GraphPad Prism V.5 Software (GraphPad, San Diego, California, USA) or IBM SPSS V.19 Software (Statistical Package for the Social Sciences, IBM, New York, USA) was used for the statistical analysis. χ2 or Fisher's exact tests were used to compare distribution of categorical factors between the different groups. All experiments were repeated at least three times. Unless otherwise stated, an unpaired Student t test was used for comparisons of two groups. Statistical significance was set at p<0.05. Results are expressed as mean±SD unless indicated otherwise.
Results
Tsc1 (haplo)insufficiency facilitates oncogenic Kras/Mek/Erk signalling to mTOR, promoting development of metastatic PDACs
As Tsc is required to relay both Mek/Erk and PI3K/Akt signals to mTOR, and as oncogenic Kras can activate both of these pathways in PDAC, we first assessed mTOR phosphorylation and then analysed Tsc expression. Consistent with published data,9 89% (39/44) of PDAC samples were p-mTORser2448-positive, demonstrating active mTOR signalling in the majority of cases (see online supplementary figure S1A). Also in line with these findings, TSC1 and TSC2 mRNA were downregulated compared with the normal/healthy pancreas (see online supplementary figure S1B). This suggested that the TSC facilitates mTOR activation in human PDAC; TSC2 mutations have even been reported in a subset of human PDACs.16 As complete loss of TSC1 or TSC2 is rare,16 the majority of the following experiments are based on mouse models with Tsc1 haploinsufficiency. The well-described knock-in oncogenic Kras (LSL-KrasG12D/+), expressed specifically in the pancreas under the control of the Ptf1a promoter (Ptf1aCre/+), was used as the PDAC backbone.17 Ptf1aCre/+; LSL-KrasG12D/+ are referred to as KrasG12D/+. Unless otherwise stated, all animals were followed up for up to 1.5 years or sacrificed for histological analysis if they showed any sign of disease.
Median survival of a KrasG12D/+; Tsc1−/+ mice cohort (n=22) was 328 days, which was significantly shorter than the KrasG12D/+ mice (412 days; n=34, figure 1A). Detailed histological reports were available for 20 KrasG12D/+; Tsc1−/+ mice. Ninety-five per cent (19/20) developed invasive PDAC and 68% of those (13/19) developed metastases (figure 1B–D) affecting the liver (13/13), lungs (6/13), and kidneys (3/13, figure 1E). Detailed histological reports were available for 30 KrasG12D/+ mice. In contrast, a much smaller percentage of KrasG12D/+ mice (33%, 10/30) developed PDAC and the metastatic rate was low (20%, 2/10, figure 1B). Histological analysis of KrasG12D/+; Tsc1−/+ mice tumours showed invasive PDAC with a focal sarcomatoid-like pattern (eg, dedifferentiation, figure 1D) and focal papillary growth patterns in a few cases. The majority of tumours displayed diffuse and large necrotic areas (figure 1D) where many duct-like structures from pre-existing cancer cells were preserved. The distribution of the necrotic regions followed an eccentric pattern and the central necrotic region was surrounded by vascularised tumour tissues.
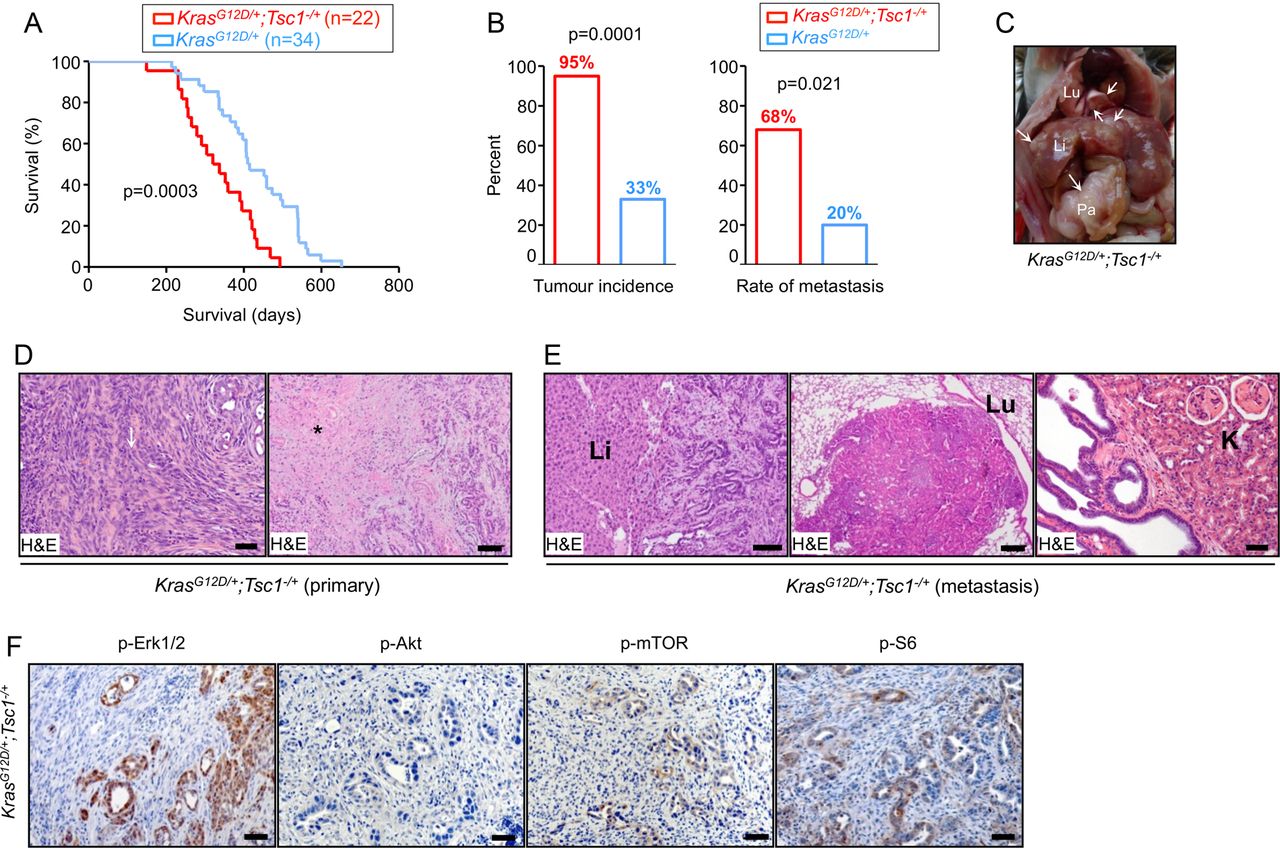
Tsc1 (haplo)insufficiency facilitates oncogenic Kras/Mek/Erk signalling to mTOR, promoting development of metastatic PDACs. (A) Kaplan-Meier survival analysis shows KrasG12D/+; Tsc1−/+ mice survival time (median survival 328 days; n=22) to be significantly shorter than KrasG12D/+ mice (median survival 412 days; n=34), log-rank test: p<0.05; (B) tumour incidence and metastatic rate of KrasG12D/+; Tsc1−/+ mice are higher than KrasG12D/+ mice; tumour incidence (χ2 test, p<0.05); metastasis rate (χ2 test, p<0.01); (C) gross pathology of a KrasG12D/+; Tsc1−/+ mouse pancreatic tumour shows the primary tumour (Pa), hepatic metastasis (Li) and pulmonary metastasis (Lu); (D) representative H&E-stained sections of KrasG12D/+; Tsc1−/+ pancreata show invasive PDAC with sarcomatoid/dedifferentiation features (left panel, arrow: sarcomatoid-like area; scale bar: 50 µm) and large areas of necrosis (right panel, * necrosis; scale bar: 200 µm); (E) representative H&E-stained sections display hepatic metastasis (left panel; scale bar: 100 µm), pulmonary metastasis (middle panel; scale bar: 200 µm) and renal invasion (right panel; scale bar: 100 µm) in KrasG12D/+; Tsc1−/+ mice; (F) representative IHC pictures show distinct in vivo activation of Akt (p-AktSer473), Erk (p-Erk1/2Thr202/Tyr204) and mTOR signalling (p-mTORSer2448 and p-S6Ser235/236) in pancreatic tissues from KrasG12D/+; Tsc1− /+ mice, scale bar: 50 µm. Tsc, tuberous sclerosis complex; mTOR, mammalian target of rapamycin; PDAC, pancreatic ductal adenocarcinoma; Li, liver; Lu, lung; K, Kidney.
To confirm robust downstream activation of mTOR and S6, phosphorylation stainings were performed. KrasG12D/+; Tsc1−/+ tumours were p-mTORSer2448-positive and p-S6Ser235/236-positive (6/6, figure 1F). Differentiation of the origin of the upstream signal (eg, Kras activation of either Mek/Erk or PI3K/Akt) in this particular setting was achieved with p-Erk1/2Thr202/Tyr204 and p-AktSer473 stainings, demonstrating that six out of six KrasG12D/+; Tsc1−/+ tumours were p-Erk1/2Thr202/Tyr204-positive but none of them were p-AktSer473-positive (figure 1F). These data suggest that—comparable to published data in breast and colon carcinomas18—the Mek/Erk axis is the in vivo driving force of KrasG12D-mediated mTOR activation in established tumours. Maintenance of mTOR signalling is also not dependent on PI3K/Akt in this mouse model, at least in the context of Tsc1 level reduction. Therefore, the role of PI3K/Akt-mediated mTOR hyperactivation in pancreatic carcinogenesis cannot be directly addressed using such models.
To delineate the oncogenic Kras-independent function of Tsc1 haploinsufficiency and to assess its hypothetical stand-alone tumour-suppressing potential, we followed up a cohort of Ptf1aCre/+; Tsc1fl/+ mice for 1.5 years (n=14, herein referred to as Tsc1−/+). These animals were healthy and no pancreas pathologies or hyperactivated mTOR signalling were observed (see online supplementary figure S2A, B). This suggests that Tsc1 haploinsufficiency alone is largely tolerable in terms of pancreas function.
Tsc1 (haplo)insufficiency facilitates the relay of PI3K/Akt signals to mTOR and promotes the development of cystic lesions in the pancreas
Oncogenic Kras has been proposed to also induce pancreatic cancer through PI3K/Akt signalling. Pten is a negative regulator of PI3K and its deficiency has been reported to lead to initiation of PDAC in mice.4 ,19 Since Pten was induced in Tsc1−/− pancreata (see online supplementary figure S2A), we reasoned that the feedback to mTOR was intact in these animals. We further hypothesised that Tsc1 haploinsufficiency might facilitate the relay of PI3K/Akt signals to mTOR in the setting of concomitant Pten deficiency. This would then be a possible alternative, oncogenic Kras-independent channel towards pancreatic carcinogenesis. To address these questions, p48Cre/+; Ptenfl/fl; Tsc1fl/+ mice (referred to as Pten−/−; Tsc1−/+) were generated. Although there was no significant difference in median survival between Pten−/−; Tsc1−/+ and Pten−/− mice (132 days, n=18 vs 162 days, n=7; figure 2A), all Pten−/−; Tsc1−/+ mice developed macroscopically visible pancreatic cysts (figure 2B; Pten−/− mice: only focal cystic lesions, figure 2C, as published19). A large proportion of the pancreatic parenchyma (40–100%) was replaced by large cysts, lined by flat-to-tall columnar epithelial cells, and/or smaller cysts with a cribriform architecture (figure 2D, middle and right panel). There was intracystic and stromal inflammation (figure 2D, left panel). Low-grade pancreatic intraepithelial neoplasias (PanIN1-2; see online supplementary figure S3A), but no PanIN3 were seen in the vicinity of the cystic lesions. In addition, we frequently observed acinar-to-ductal metaplasias, positive for Krt19, within the atrophic pancreatic parenchyma, similar to lesions previously described in Pten−/− mice20–22 (see online supplementary figure S3B). These cystic lesions (6/6) were positive for p-AktSer473, p-mTORSer2448 and p-S6Ser235/236, but negative for p-Erk1/2Thr202/Tyr204 (figure 2F; 5/6, except for one invasive case; online supplementary figure S3C), suggesting a PI3K/Akt-dependent activation of mTOR in vivo. Only one invasive PDAC was found (1/18; 6%, figure 2E, left panel) in which small invasive carcinomas were surrounded by α-smooth muscle actin-positive mesenchymal cells (figure 2E, right panel). Thus, Tsc1 haploinsufficieny together with a loss of Pten facilitate PI3K/Akt signalling to mTOR in vivo, albeit at a relatively low penetrance. We also conclude from these data that—comparable to its effect in other entities such as lung cancer7—Tsc1 functions as a PDAC tumour suppressor by facilitating mTOR hyperactivation. Interestingly and depending on the upstream stimulating signals (Mek/Erk vs PI3K/Akt), Tsc1 haploinsufficiency leads to different biological results (eg, metastatic PDAC vs cystic lesions).
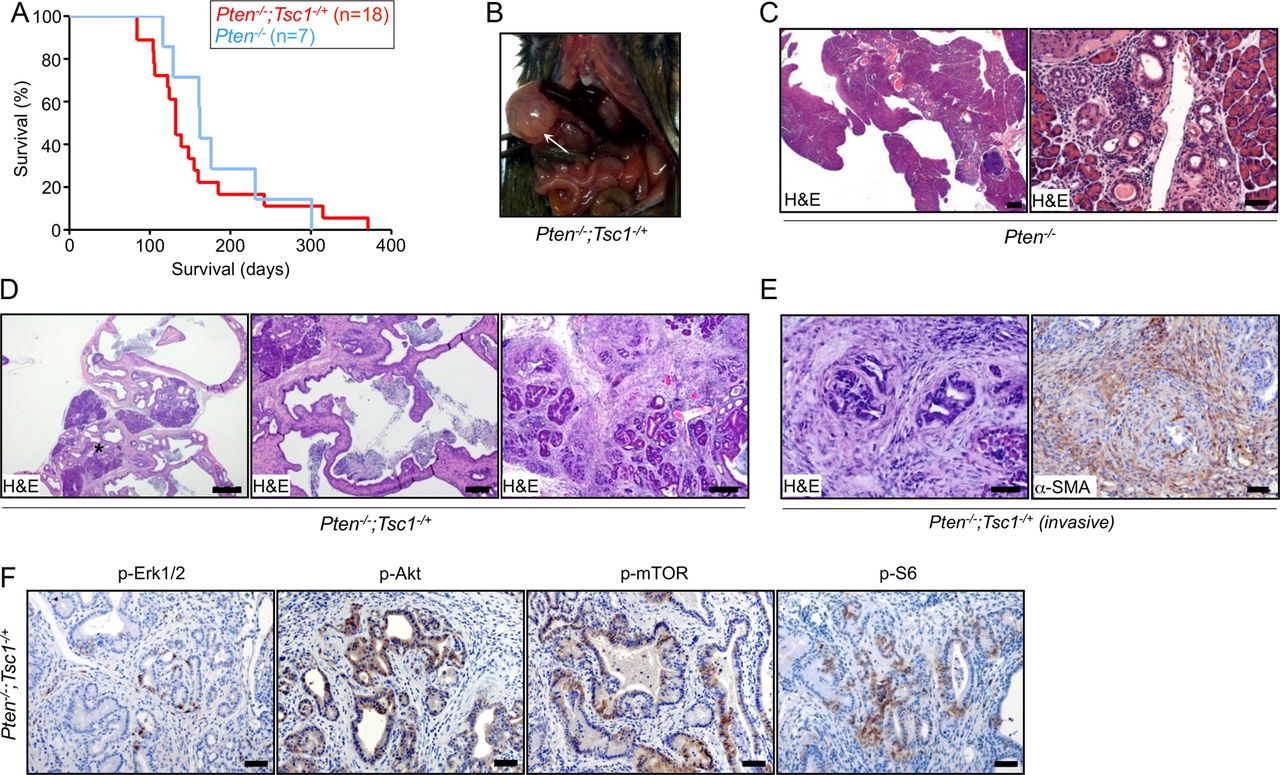
Tsc1 (haplo)insufficiency facilitates the relay of PI3K/Akt signals to mTOR and promotes the development of cystic lesions in the pancreas. (A) Kaplan-Meier survival analysis shows Pten−/−; Tsc1−/+ mice survival times (median survival 132 days; n=18) not to be significantly different than Pten−/− mice (median survival 162 days; n=7), log-rank test: p>0.05; (B) gross pathology of Pten−/−; Tsc1−/+ mice shows pancreatic cysts at necropsy; (C) representative H&E-stained sections indicate localised cystic lesions in Pten−/− pancreata; scale bar: 500 μm (left), 50 μm (right); (D) representative H&E-stained sections of Pten−/−; Tsc1−/+ pancreata indicate exocrine pancreas remodelling by cystic lesions with high-grade dysplasia in smaller cysts with cribriform architecture (* intracystic and stromal inflammatory component, scale bar: 500 µm (left), 200 µm (middle), 100 µm (right); (E) H&E-stained section demonstrates one case of focal invasion in Pten−/−; Tsc1−/+; the invasive cells are surrounded by α-SMA-positive mesenchymal cells (scale bar: 50 µm); (F) representative IHC pictures show distinct in vivo activation of Akt (p-AktSer473), Erk (p-Erk1/2Thr202/Tyr204) and mTOR signalling (p-mTORSer2448 and p-S6Ser235/236) in pancreatic tissues of Pten−/−; Tsc1−/+ mice, scale bar: 50 µm. Tsc, tuberous sclerosis complex; mTOR, mammalian target of rapamycin; α-SMA, α-smooth muscle actin.
Dual inhibition of Mek and PI3K effectively decreases oncogenic Kras/Mek/Erk-dependent mTOR activity
To further define the interaction of mTOR and oncogenic Kras signalling, including reciprocal activation/inhibition of upstream and downstream signals, cell lines from KrasG12D/+; Tsc1−/+ tumours (#399, 403, 907 and 897) and from Pten−/−; Tsc1−/+ cystic lesions (#952, 926 and 928; see online supplementary figure S4A) were generated. The genotypes of the cell lines were confirmed by PCR (see online supplementary figure S4B). To ensure that the isolation process had not changed the cells overtly, they were orthotopically transplanted into C57Bl/6 (KrasG12D/+; Tsc1−/+ cell lines) or subcutaneously into BALB/c nude (Pten−/−; Tsc1−/+ cell lines) mice. No tumour formation was observed during the transplantation of Pten−/−; Tsc1−/+ cell lines into C57Bl/6 mice (see online supplementary table S1). The major morphologies of the primary tumours in KrasG12D/+; Tsc1−/+ mice, including necrosis and dedifferentiation, were recapitulated in the orthotopic tumours (see online supplementary figure S4C and table S1). Similarly, subcutaneous injection of Pten−/−; Tsc1−/+ cell lines induced cystic tumours, reminiscent of the respective primary lesions (see online supplementary figure S4D and table S1). We, therefore, decided that it was reasonable to use these cell lines in the following signal transduction experiments.
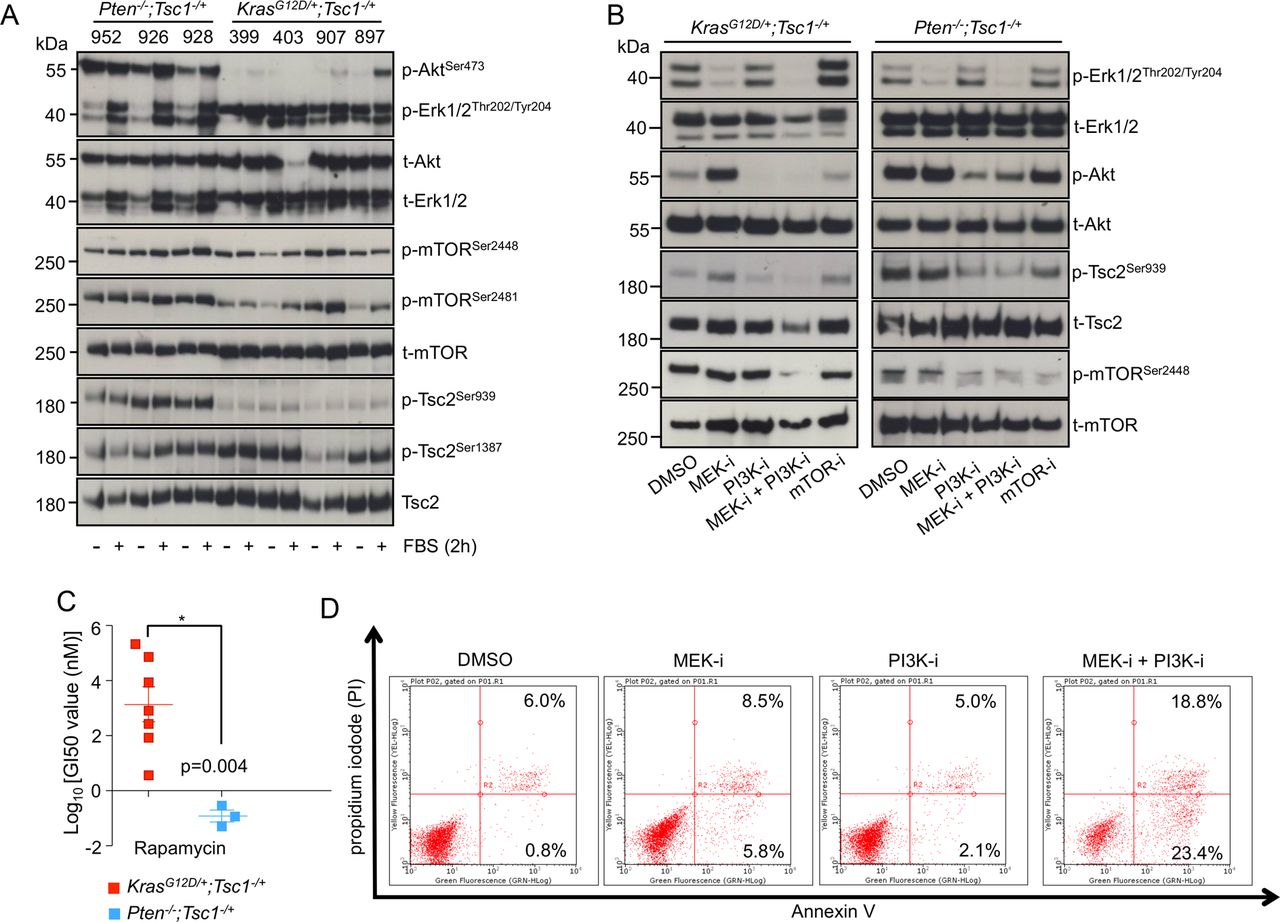
First, we tested the driving signal of mTOR in the respective cell lines by culturing the cells under serum deprivation conditions. In accordance with the in vivo findings, Akt was constitutively active (as demonstrated by p-AktSer473 stainings) in Pten−/−; Tsc1−/+ cells, whereas its activity in KrasG12D/+; Tsc1−/+ cell lines relied on the presence of serum in the culture medium. Accordingly, Erk was constantly active (p-Erk1/2Thr202/Tyr204) in KrasG12D/+; Tsc1−/+ cell lines, while its activity in Pten−/−; Tsc1−/+ cells also depended on serum concentration (figure 3A). Nevertheless, mTOR signalling (as reflected by phosphorylation levels of p-mTORSer2448 and p-mTORSer2481) was constantly active in these cell lines and in some cases could be further increased by serum treatment (eg, the 403 and 907 cells). To distinguish patterns of mTOR activation, we analysed phosphorylation of the conserved Akt site of Tsc2 in Pten−/−; Tsc1−/+ cells. Tsc2Ser939 was significantly more phosphorylated than in KrasG12D/+; Tsc1−/+ cells (figure 3A). As the levels of the Erk phosphorylation site of Tsc2 (Tsc2Ser664) could not be shown directly (due to the lack of effective antibodies), we proceeded to detect the Ampk phosphorylation site of Tsc2 as an internal control. No such difference was seen for the Ampk phosphorylation site of Tsc2 (Ser1837; figure 3A). Thus, mTOR activation in Pten−/−; Tsc1−/+ cells is driven to a greater extent by the PI3K/Akt axis, whereas in KrasG12D/+; Tsc1−/+ cells, Mek/Erk is more likely to be the driving force.

Dual inhibition of Mek and PI3K effectively decreases oncogenic Kras/Mek/Erk-dependent mTOR activity. (A) Western-blot analysis demonstrates phosphorylation levels of p-AktSer473, p-Erk1/2Thr202/Tyr204, p-mTORSer2448, p-mTORSer2481, p-Tsc2Ser939 and p-Tsc2Ser1387 in Pten−/−; Tsc1−/+ (926, 928 and 952) and KrasG12D/+; Tsc1−/+ (399, 403, 907 and 897) cells after FBS treatment for 2 h; one of the three independent experiments is shown; (B) western-blot analysis shows phosphorylation levels of p-Erk1/2Thr202/Tyr204, p-AktSer473, p-mTORSer2448, p-Tsc2Ser939 after pharmacological inhibition of MEK (PD 98069), PI3K (LY 294002), MEK+PI3K and mTOR (rapamycin) for 24 h in KrasG12D/+; Tsc1−/+ and Pten−/−; Tsc1−/+ cells, respectively; (C) in vitro chemotherapy assay indicates that KrasG12D/+; Tsc1−/+ cells are more resistant to rapamycin than Pten−/−; Tsc1−/+ cells; * p<0.05. (D) FACS analysis for Annexin V demonstrates apoptosis in KrasG12D/+; Tsc1−/+ cells following dual inhibition of MEK and PI3K. One representative experiment of three is shown. Tsc, tuberous sclerosis complex; FBS, fetal bovine serum; mTOR, mammalian target of rapamycin; MEK-I, MEK inhibition; PI3K-I, PI3K inhibition; mTOR-I, mTOR inhibition.
In order to further substantiate such activation patterns, we investigated the influence of pharmacological inhibition of Mek (using the MEK inhibitor PD 98059), PI3K (using the PI3K inhibitor LY 294002) and/or mTOR (using rapamycin) signalling in KrasG12D/+; Tsc1−/+ (‘399 cells’) and Pten−/−; Tsc1−/+ (‘926 cells’) cells, respectively. In KrasG12D/+; Tsc1−/+ cells (figure 3B, left panel), inhibition of Mek alone had no effect on mTOR activity. This was mainly due to the feedback activation of Akt which reactivated mTOR by phosphorylating Tsc2. Similarly, inhibition of PI3K alone had no significant effect. Direct inhibition of mTOR elicited strong feedback activation of Erk which counteracted mTOR inhibition; furthermore, the KrasG12D/+; Tsc1−/+ cells were highly resistant to the cytotoxic effect of rapamycin (as compared with Pten−/−; Tsc1−/+ cells, figure 3C). Only dual inhibition of Mek and PI3K reduced mTOR activity. Even more importantly, only this combinatorial inhibition effectively induced apoptosis (figure 3D (fluorescence-activated cell sorting (FACS)) and online supplementary figure S4E (cleaved caspase 3)). In Pten−/−; Tsc1−/+ cells, however, inhibition of Mek had no effect whereas inhibition of PI3K reduced mTOR activity. Dual inhibition of Mek and PI3K or direction inhibition of mTOR had similar effects (see online supplementary figure 3B, right panel).
Thus, while cells derived from KrasG12D/+; Tsc1−/+ tumours are resistant to Mek, PI3K and mTOR inhibitors alone, the dual inhibition of the Mek/Erk and PI3K/Akt cascades effectively inhibited mTOR activation and induced apoptosis. Such a dual inhibition would be a reasonable clinical approach for the treatment of patients with PDACs with oncogenic Kras mutation(s) and concomitant Mek/Erk-mediated mTOR activation. The aim of the following analyses was to identify biomarkers for this presumed subset of patients.
Aldh1a3 is a biomarker for oncogenic Kras/Mek/Erk/mTOR-driven PDAC
We compared transcriptional profiles of a panel of KrasG12D/+; Tsc1−/+ cell lines to Pten−/−; Tsc1−/+ cells. As no cell lines could be retrieved from the Tsc1−/+ mice, we established cell lines from pancreata of p48Cre/+; p53fl/fl; Tsc1fl/+ and p48Cre/+; p53fl/fl; Tsc1fl/fl (described as p53fl/fl; Tsc1fl/+ and the p53fl/fl; Tsc1fl/fl, respectively) mice as controls (see online supplementary figure S5A). No PDAC formation was observed in any of these animals. The purpose of the Pten−/−; Tsc1−/+, p53fl/fl; Tsc1fl/+ and p53fl/fl; Tsc1fl/fl cell lines was to filter out target and other ‘background’ genes of the PI3K/Akt-mTOR axis.
Using 0.001 as the statistical cut-off for the false discovery rate, 4234 genes were found to be differentially expressed between any pair of cell lines (which represent 20.4% of all genes on the array; the top 100 genes are listed in online supplementary table S2). The 20 genes specifically upregulated in KrasG12D/+; Tsc1−/+ cell lines were named ‘KrasG12D/Mek-mTOR signature’, while the 20 genes upregulated in the Pten−/−; Tsc1−/+ cell lines were labelled ‘PI3K/Akt-mTOR signature’ (figure 4A). Out of these, Cdh17 (liver-intestine cadherin), Wfdc2 (also known as HE4, WAP four-disulfide core domain 2) and Gabrp (γ-aminobutyric acid A receptor, pi) were shared by the KrasG12D/Mek-mTOR and PI3K/Akt-mTOR signatures (figure 4A, C). These genes have previously been reported to be expressed in human PDAC tissues and cell lines, indicating that the mouse cell lines at least partially represent human disease genetics.23–26

Aldh1a3 is a biomarker for oncogenic Kras/Mek/Erk/mammalian target of rapamycin (mTOR)-driven pancreatic ductal adenocarcinoma. (A) A heatmap illustrates the 20-gene signature representing different groups of cell lines and (B) expression of 20 Aldh members in the three groups of cell lines. The bar graph shows the relative expression of Cdh17, Wfdc2, Gabrp (C) as well as of Aldh1a1 and Aldh1a3 (D) in different groups of cell lines; (E) IHC demonstrates expression of Aldh1a3, Aldh1a1, Areg and Tns4 in cystic lesions and cancer cells of Pten−/−; Tsc1−/+ and KrasG12D/+; Tsc1−/+ mice, respectively; scale bar: 50 µm.
We then focused on the KrasG12D/Mek-mTOR signature. The genes for the Mek/Erk-mTOR signature were selected if they were significantly upregulated in KrasG12D/+; Tsc1−/+cell lines compared with both Pten−/−; Tsc1−/+ and control cell lines (two independent t tests, p<0.05, FC>2), yielding a gene set containing 230 genes (see online supplementary table S3). To explore the functional relevance of this signature, we analysed Gene Ontology (GO) terms and Kyoto Encyclopedia of Genes and Genomes (KEGG) pathways using the 230 preselected genes. This analysis revealed that 87 GO terms (see online supplementary table S4) were over-represented in the Mek/Erk-mTOR signature; the top GO terms are listed in online supplementary table S5. The majority of GO terms were associated with cell proliferation, cell differentiation, metabolic processes, cellular response to stress, regulation of MAP kinases and other kinase activities, which is largely in line with the known functions of Mek/Erk-mTOR signalling. Notably, KEGG pathway analysis identified ‘Glycolysis/Gluconeogenesis’ as a significant pathway (see online supplementary tables S4 and S5). These data underscore the importance of Mek/Erk-mTOR signalling for regulating glucose metabolism in pancreatic carcinogenesis, as recently described.27 The gene with the lowest p value was Aldh1a3 (aldehyde dehydrogenase 1 family, member A3). Though ALDH1 expression is an unfavourable factor for patient prognosis,28 ,29 it is unclear which ALDH1 contributes to the aggressive biology of ALDH1-expressing cancers. We, therefore, analysed expression of 20 Aldh family members in the cell lines, revealing that Aldh1a3 was associated with the KrasG12D/Mek-mTOR signature while Aldh1a1 was associated with the PI3K/Akt-mTOR signature (figure 4B, D). In vivo validation of these molecular signatures was carried out using immunohistochemistry studies for Aldh1a3, Aldh1a1 and two further proteins—Tensin 4 (Tns4) and Amphiregulin (Areg), which were among the top 20 genes of the Mek/Erk-mTOR signature (figure 4E). In line with the array data, cancer cells in KrasG12D/+; Tsc1−/+ mice were positive for Aldh1a3, Tns4 and Areg, and negative for Aldh1a1. In contrast, cystic lesions in Pten−/−; Tsc1−/+mice were positive for Aldh1a1, but negative for Aldh1a3, Tns4 and Areg (figure 4E). Importantly, one Pten−/−; Tsc1−/+ pancreas with an invasive cyst showed high levels of Aldh1a3, implying that Aldh1a3 expression is associated with malignant transformation (see online supplementary figure S3C).
Aldh1a3 promotes the growth of oncogenic Kras-dependent and Kras-independent cell lines
Because our bioinformatic analysis of the Mek/Erk-mTOR signature identified glucose metabolism as a crucial process for its oncogenic activity and because Aldh1a3 has recently been shown to promote glycolysis in glioma stem cells,30 we hypothesised that the oncogenic activity of the Mek/Erk-mTOR axis may rely on Aldh1a3. To analyse this, we confirmed Aldh1a3 and Aldh1a1 expression (as a ‘control’) in KrasG12D/+; Tsc1−/+ and Pten−/−; Tsc1−/+ cell lines, respectively (figure 5A). To substantiate whether the KrasG12D/Mek-mTOR axis controls Aldh1a3 expression, we investigated the influence of pharmacological inhibition of Mek, PI3K and/or mTOR signalling on Aldh1a3 and Aldh1a1 expression in KrasG12D/+; Tsc1−/+ (399 cells) and Pten−/−; Tsc1−/+ (926 cells) cells, respectively. In accordance with results from our pathway analyses (figure 3B), dual inhibition of Mek and PI3K reduced both the activity of the KrasG12D/Mek-mTOR axis and Aldh1a3 expression in KrasG12D/+; Tsc1−/+ cells. Inhibition of Mek, PI3K and mTOR alone had no such effect, despite the finding that single inhibition of Mek or PI3K slightly decreased Aldh1a3 expression in these cells (figure 5B). In Pten−/−; Tsc1−/+ cells, inhibition of PI3K and mTOR or dual inhibition of PI3K and Mek eliminated both mTOR activity and Aldh1a1 expression (see online supplementary figure S5B). Interestingly, KrasG12D/+; p53R172H/+ cancer cell lines (‘5M407’ and ‘110365’ cells, obtained from Pdx1-Cre; KrasG12D/+; p53R172H/+ mice, respectively) expressed significantly lower levels of Aldh1a3 as compared with KrasG12D/+; Tsc1−/+ cells (see online supplementary figure 6SA). Dual inhibition of Mek/PI3K in these cells eliminated mTOR activity but had no effect on Aldh1a3 expression (see online supplementary figure S6B).
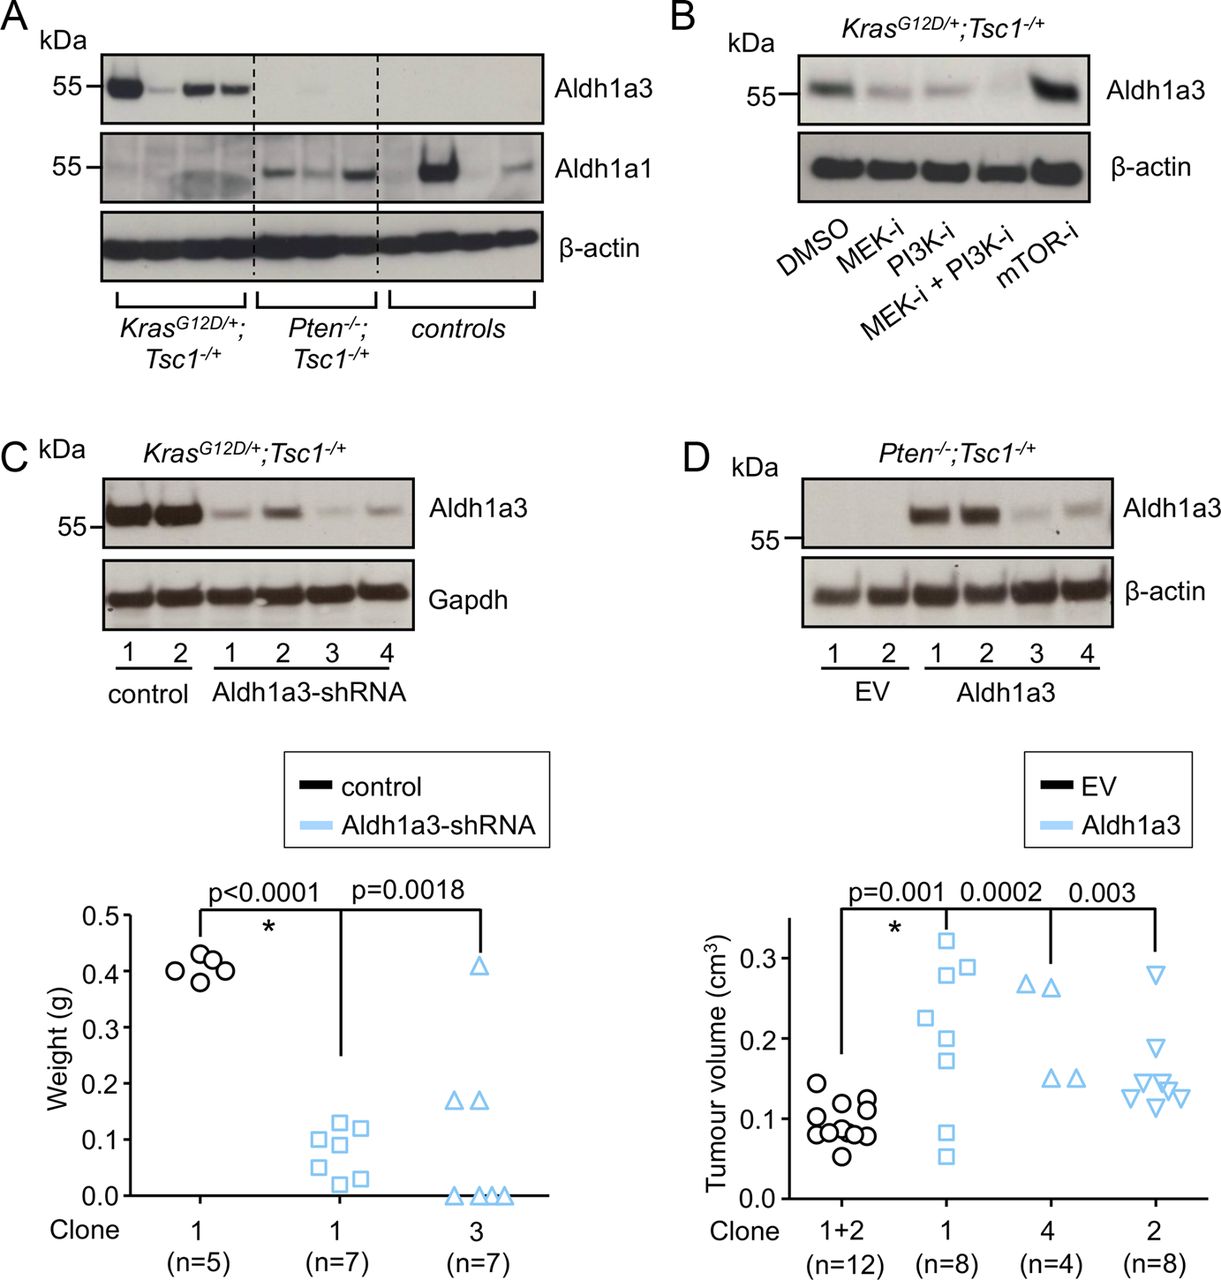
Aldh1a3 promotes the growth of oncogenic Kras-dependent and Kras-independent cell lines. (A) Western-blot analysis shows expression of Aldh1a3 and Aldh1a1 in the three groups of cell lines; (B) western-blot analysis shows Aldh1a3 expression after pharmacological inhibitions of MEK (PD 98069), PI3K (LY 294002), MEK+PI3K and mTOR (rapamycin) for 24 h in KrasG12D/+; Tsc1−/+ cells, respectively; one experiment out of three is shown; (C) western-blot analysis shows selected clones (KrasG12D/+; Tsc1−/+ cells, 399) stably expressing Aldh1a3-specific shRNA (upper panel); the tumour mass of orthotopically transplanted cancer cells (control#1, Aldh1a3-shRNA#1 and Aldh1a3-shRNA#3) in WT mice (lower panel); *<0.05; (D) western-blot analysis shows selected clones (Pten−/−; Tsc1−/+ cells, 926) stably expressing Aldh1a3 (upper panel); the tumour size shows growth of transplanted cancer cells (EV#1 and EV#2, Aldh1a3#1, Aldh1a3#2 and Aldh1a3#4) in BALB/c nude mice (lower panel); *<0.05. Tsc, tuberous sclerosis complex; mTOR, mammalian target of rapamycin; MEK-I, MEK inhibition; PI3K-I, PI3K inhibition; mTOR-I, mTOR inhibition; control, control vector; WT, wild type; EV, empty vector
To analyse the functional relevance of Aldh1a3, we reduced Aldh1a3 expression in KrasG12D/+; Tsc1−/+ cells (“399 cells”) using Aldh1a3-specific sh-RNA expression vectors (figure 5C, upper panel). In line with the bioinformatics analysis and previously reported data,30 we observed a significant reduction in the concentration of lactic acid in the supernatants following Aldh1a3 sh-RNA (see online supplementary figure S6C; cells cultured in normal medium, glucose 25 mM), suggesting impaired glycolysis. No such effect was observed when these cells were cultured in a low-glucose (0.5 mM) medium. Notably, downregulation of Aldh1a3 significantly impaired the growth of KrasG12D/+; Tsc1−/+ cells after they had been transplanted into WT mice (figure 5A, lower panel). To substantiate these findings in a non-Kras-dependent model, we generated stable Aldh1a3-expressing Pten−/−; Tsc1−/+ cell lines (termed “#926”, figure 5B, upper panel). These produced significantly larger tumours after subcutaneous transplantation into BALB/c nude mice (figure 5B, lower panel). However, overexpression of Aldh1a3 itself did not impact the activities of Erk, Akt or mTOR (see online supplementary figure S6D). In contrast, transient downregulation of Aldh1a3 using siRNA transfection slightly compromised cell growth of one of the KrasG12D/+; p53R172H/+cell lines (‘110365’ cells; 23% reduction, colony formation assay; online supplementary figure S6E).
ALDH1A3 labels an aggressive subtype of human PDAC
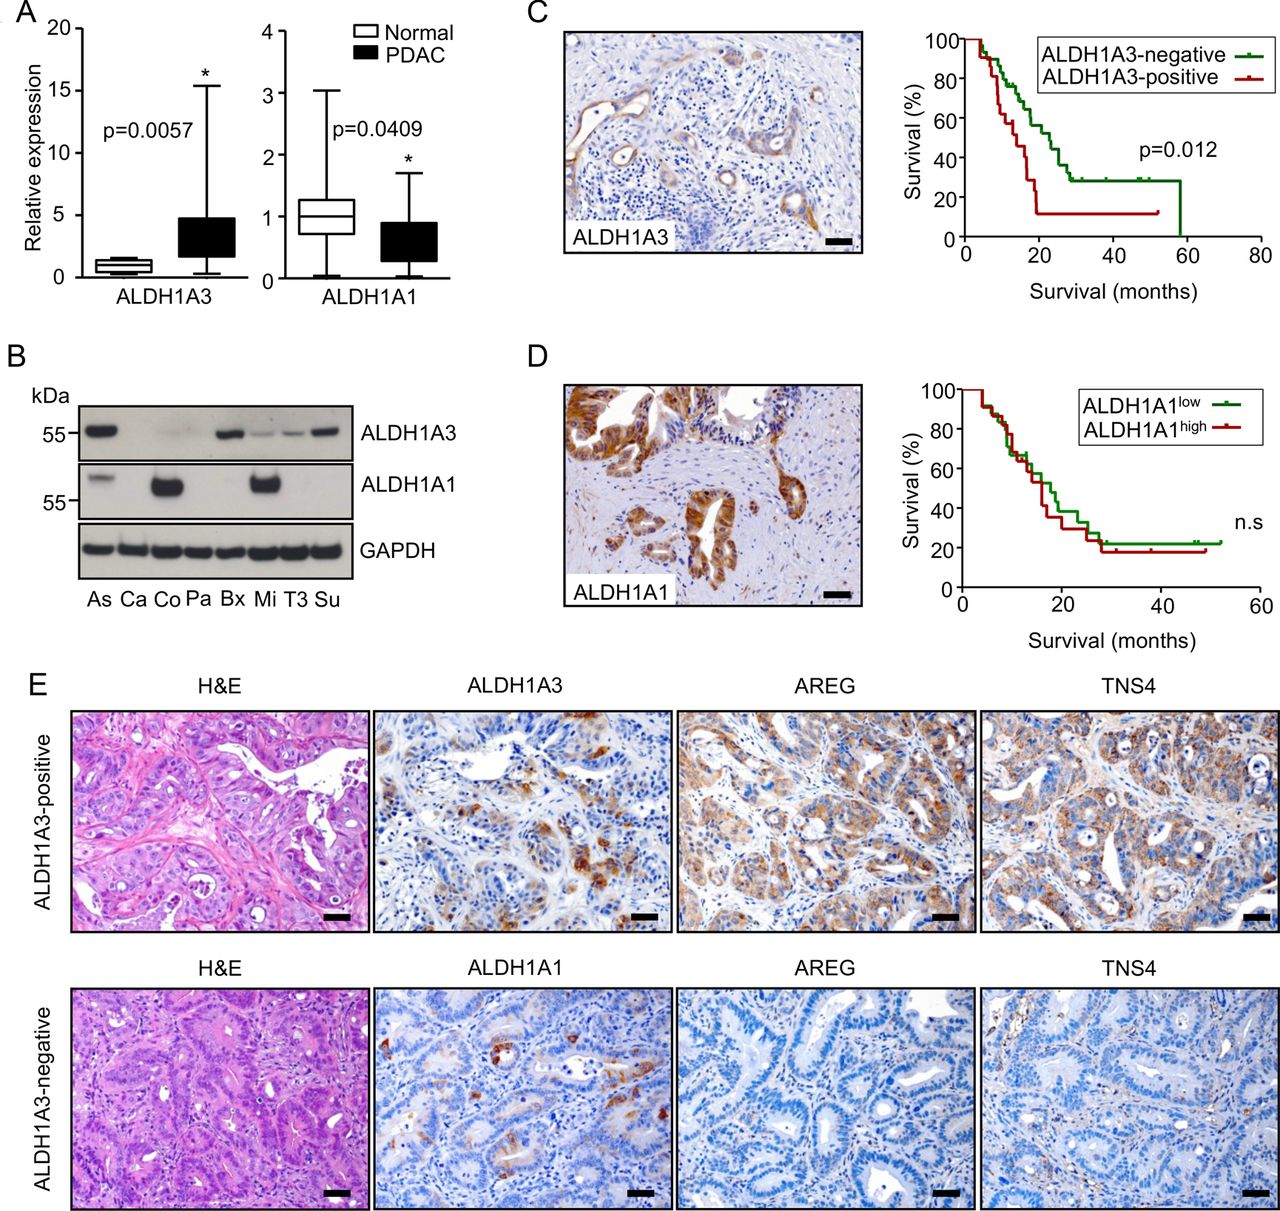
Since Aldh1a3 is a biomarker of aggressiveness in mouse KrasG12D/+; Tsc1−/+ PDACs and because it promotes tumour growth in vivo, we attempted to determine if this was the case in humans as well. ALDH1A3 mRNA was significantly upregulated in bulk PDAC (n=20) tissues (fivefold, compared with normal pancreas (n=10)), while ALDH1A1 mRNA was downregulated (figure 6A). Subsets of human PDAC cell lines expressed ALDH1A3 and/or ALDH1A1, respectively (figure 6B). In line with the results from the mouse cell lines, only dual inhibition of MEK/PI3K effectively eliminated mTOR activity and ALDH1A3 expression in human pancreatic cancer cell lines (Su86.86 and BxPC-3 cells, online supplementary figure S7A). Twenty-four-hour inhibition of PI3K or mTOR alone reduced mTOR activity in these cells; however, it elicited a feedback to AKT signalling, as also previously described.11 ,28 At the same time, it had no effect on ALDH1A3 expression. Dual inhibition of mTORC1/2, of PI3K/mTOR, or direct inhibition of AKT circumvented the feedback to AKT signalling; however, none of these inhibitions had any effect on ALDH1A3 expression (see online supplementary figure S7B). These data demonstrate that the PI3K/AKT-mTOR axis does not contribute to ALDH1A3 expression. 41% (21/50) of PDAC tissues reacted ALDH1A3-positive during immunohistochemistry (figure 6C). Kaplan-Meier survival analysis revealed that patients with cancer tissues positive for ALDH1A3 survived for a significantly shorter time after surgical resection than those testing negative for ALDH1A3 (median survival: 14.0 vs 22.8 months, figure 6C). The prognostic value of ALDH1A3 expression was validated by multivariable analysis using a Cox proportional hazards model (see online supplementary table S6, HR 2.374, p=0.040). Further analysis demonstrated that ALDH1A3 expression was associated with the lymph node (N) status of the patients on univariable analysis. Ninety-five per cent (20/21) of patients with ALDH1A3-positive tumours had cancer-positive lymph nodes at time of surgery (table 1). Though 47% (22/46) of the human PDAC tissues were strongly positive for ALDH1A1, their staining intensities did not correlate with survival (figure 6D). We stained 14 human PDAC xenograft tissues (tumours derived from primary human PDACs) for ALDH1A3, ALDH1A1, TNS4 and AREG to further validate if ALDH1A3-positive PDACs constitute a molecular subtype in humans and to potentially screen therapeutic options for this subtype. This analysis revealed that positivity of TNS4 and AREG strictly correlated with the expression of ALDH1A3 (figure 6E). Specifically, 6 of 14 (43%) PDAC tissues were positive for ALDH1A3 while 5 (5/6; 83.3%) were double-positive for TNS4 and AREG. In contrast, only 1 of 8 (12.5%) ALDH1A3-negative tissues was double-positive for TNS4 and AREG. However, 93% of the tissues (13/14) were positive for ALDH1A1 and here, no correlation to TNS4 and AREG expression was found.
Clinical characteristics and comparisons of the two pancreatic ductal adenocarcinoma cohorts

ALDH1A3 labels an aggressive subtype of human pancreatic ductal adenocarcinoma (PDAC). (A) QRT-PCR data demonstrate mRNA levels of ALDH1A1 and ALDH1A3 in normal pancreas (n=10) and PDAC tissues (n=20); data are presented as relative expression (normalised to the median expression level in normal pancreas); *p<0.05; (B) western-blot analysis show protein expression of ALDH1A1 and ALDH1A3 in human PDAC cell lines (Aspc-1 (As), Capan-1 (Ca), Colo357 (Co), Panc-1 (Pa), Bx (Bxpc-3), Mia-PaCa2 (Mi), T3M4 (T3), Su86.86 (Su)); data are presented as relative expression (normalised to the median expression level of all cell lines); (C, D) IHC pictures show ALDH1A3-expressing and ALDH1A1-expressing PDAC cells; patients with PDAC whose cancer tissues are positively stained for ALDH1A3 (n=21) survived significantly shorter than those with ALDH1A3 negativity (n=29; median survival: 14.0 vs 22.8 months, log-rank test: p=0.012); however, there is no such effect for ALDH1A1; (E) representative H&E-stained sections and immunohistochemistries show the histology and expression of ALDH1A3, ALDH1A1, AREG and TNS4 in 14 human xenograft PDACs.
Discussion
Using a set of transgenic mouse models, we performed an extensive in vivo molecular/phenotypic dissection on the physiopathological role of mTOR signalling in pancreas. In the context of Tsc1 haploinsufficiency, KrasG12D preferably activated mTOR via the Mek/Erk cascade. This was sufficient and effective enough to initiate PDAC at a 95% penetrance. These data define the Mek/Erk cascade as the backbone of mTOR activation in KrasG12D-driven PDAC. Owing to reciprocal activation and inhibition between mTOR, and its driving and downstream signals, inhibition of none of the tested signal relays within the KrasG12D/Mek-mTOR axis was sufficient to reduce its activity or to increase cancer cell apoptosis. Expression analysis of the respective cell lines identified Aldh1a3 as a key target gene of KrasG12D/Mek-mTOR, both on the expression and the function levels. Our data clearly define the KrasG12D/Mek/mTOR/Aldh1a3 axis as a major therapeutic target in a particular subset of Aldh1a3-positive PDAC.
Two recent transposon mutagenesis projects have identified and confirmed Pten as an important tumour suppressor in oncogenic Kras-driven cancers.31 ,32 A preclinical trial in transgenic mouse models discovered that KrasG12D mice with Pten deficiency were particularly sensitive to mTOR inhibition, whereas KrasG12D mice with mutant p53 were highly resistant.13 A new concept of mTOR dependency in PDAC has been proposed based on these data. It highlights a role of PI3K/Akt-driven mTOR signalling in promoting oncogenic Kras-driven carcinogenesis. The resulting tumours are, however, more susceptible to mTOR inhibition.13 Though only a subset of human PDACs (20–30%) includes genetic changes along the PI3K/AKT pathway,3 ,31 mTOR hyperactivation is found at much higher rates of approximately 80%. This indicates an alternative activation of mTOR by oncogenic Kras in the absence of genetic changes along the PI3K/AKT axis. In addition, these tumours would probably respond less to mTOR inhibition—as shown in the frustrating results of clinical trials published to date.10
In this paper, we describe a novel mouse model in which mTOR signalling is activated in the absence of active PI3K/Akt signalling by deleting one allele of Tsc1 and by concomitantly expressing oncogenic Kras. We speculate that one Tsc1 allele may affect the stability of the Tsc, which leads to a reduced activation threshold of mTOR by upstream signals such as Mek/Erk and PI3K/Akt. Notably, we observed that cancer cell lines derived from these mice expressed relatively low levels of Aldh1a3 and that dual inhibition of Mek/PI3K reduced mTOR activity. This, however, had no effect on Aldh1a3 expression, which might be due to insufficient inhibition of mTOR activity under our experimental conditions or to alternative mechanisms of control of Aldh1a3 expression (eg, through a p53 gain-of-function mutation33).
In humans, the ALDH subfamily of NAD(P)+-dependent enzymes contains 19 isoforms which are mainly responsible for aldehyde detoxification and retinoid acid signalling (http://www.aldh.org/).34 In particular, the ALDH1 family has been linked to characteristics of stem cells and cancer stem cells in various organs, including the pancreas.35 Aldh1a1 and Aldh1a7 were reported to be expressed in pancreatic progenitor cells in the adult mouse pancreas.36 Aldh1a1 and Aldh1b1 are expressed in pancreatic stem/progenitors cells in embryonic development.37 Aldh1a2 is expressed in the dorsal pancreatic mesenchyme during pancreatic organogenesis and plays a role in guiding development of the dorsal pancreas.38 However, expression of Aldh1a3 has not so far been reported under physiological circumstances in any type of pancreatic cells. Our data demonstrate that Aldh1a3 expression in pancreatic cancer cells promotes glycolysis and tumour formation in vivo which corresponds with the previously reported function of Aldh1a3 in glioma stem cells.30 Furthermore, we demonstrate that it is the high expression of ALDH1A3 that correlates with poor prognosis in human PDAC, which is in line with the phenotype of the KrasG12D/+; Tsc1−/+ mice. The data presented here also indicate that Aldh1a3 is not only a marker for these tumours but also constitutes an essential component of the KrasG12D/Mek-mTOR axis. Direct targeting of Aldh1a3 may, therefore, circumvent the feedback responses elicited by mTOR inhibition. However, there are two major questions worthwhile of further investigation: (1) How does the oncogenic Kras/Mek/Erk/mTOR axis control expression of Aldh1a3? and (2) How does Aldh1a3 affect glucose metabolism?
In conclusion, our results from mouse model and pathway analyses demonstrate the KrasG12D/Mek/mTOR/Aldh1a3 axis to be a therapeutic target in a PDAC patient subset. According to these data, about 40% of human PDAC tissues are positive for ALDH1A3. These patients might benefit from a dual inhibition of MEK and PI3K (or even ALDH1A3). Further research will be required to define the extent and timing of such a combinatorial treatment approach. Since the ALDH1A3-positive subtype also exists in human xenograft PDACs, the effectiveness of such therapies could be tested in a translational setting. The particular mouse models described here may serve as an additional testing platform.
Acknowledgments
The authors would like to thank Wilhelm Schönherr, Manja Thorwirth, Ziying Jian, Nadja Maeritz, Nataliya Valkovska and Anke Bettenbrock for their excellent technical support.
References
Supplementary materials
Supplementary Data
This web only file has been produced by the BMJ Publishing Group from an electronic file supplied by the author(s) and has not been edited for content.
Files in this Data Supplement:
- Data supplement 1 - Online supplement
Footnotes
JK and CWM contributed equally.
Contributors BK, CWM and JK designed the study. BK, WW, TC, CQ, ZJ, IR, SR and NB performed experiments and acquired data. AMS and IE provided expertise in pathological analysis. CJ collected clinical data and provided expertise in statistical analysis. SAH and AT provided xenograft tissues and pathology diagnoses. PB, MI, JB and FJT provided expertise in bioinformatics. BK and CWM drafted the manuscript. ME, HF, JTS and JK revised the manuscript critically for important intellectual content. All authors approved the final version of the manuscript.
Funding This project was supported in part by a grant from the TU Munich commission for clinical research (KKF C21-11, to BK), the Deutsche Forschungsgemeinschaft (MI 1173/5-1, to CWM, BK and JK), the Else-Kroener-Fresenius-Stiftung (2009_A146, to CWM), the European Union (FP7, PacaNet, to CWM and JK), the Deutsche Zentrum für Diabetesforschung—DZD e.V. (to JB) and the German Ministry of Science (North Rhine-Westphalia, Germany; PURE, to SAH).
Competing interests None.
Ethics approval Institutional Review Board, TU Munich, Germany.
Provenance and peer review Not commissioned; externally peer reviewed.